Abstract
Ocean acidification describes the progressive, global reduction in seawater pH that is currently underway because of the accelerating oceanic uptake of atmospheric CO2. Acidification is expected to reduce coral reef calcification and increase reef dissolution. Inorganic cementation in reefs describes the precipitation of CaCO3 that acts to bind framework components and occlude porosity. Little is known about the effects of ocean acidification on reef cementation and whether changes in cementation rates will affect reef resistance to erosion. Coral reefs of the eastern tropical Pacific (ETP) are poorly developed and subject to rapid bioerosion. Upwelling processes mix cool, subthermocline waters with elevated pCO2 (the partial pressure of CO2) and nutrients into the surface layers throughout the ETP. Concerns about ocean acidification have led to the suggestion that this region of naturally low pH waters may serve as a model of coral reef development in a high-CO2 world. We analyzed seawater chemistry and reef framework samples from multiple reef sites in the ETP and found that a low carbonate saturation state (Ω) and trace abundances of cement are characteristic of these reefs. These low cement abundances may be a factor in the high bioerosion rates previously reported for ETP reefs, although elevated nutrients in upwelled waters may also be limiting cementation and/or stimulating bioerosion. ETP reefs represent a real-world example of coral reef growth in low-Ω waters that provide insights into how the biological–geological interface of coral reef ecosystems will change in a high-CO2 world.
Keywords: coral reef persistence, inorganic cementation, ocean acidification, climate change
Atmospheric CO2 is increasing exponentially because of the unregulated combustion of fossil fuels (1). Approximately one-third of all of the CO2 released into the atmosphere since the industrial revolution has been absorbed by the oceans (2). This ongoing uptake of atmospheric CO2 is causing a drop in seawater pH at the global scale, causing an acidification of the oceans (3–5). Ocean acidification results in a decrease in seawater [CO32−] and, consequently, a decrease in the saturation state (Ω) of carbonate minerals {Ω = [Ca2+][CO32−]/K′sp, where K′sp is the apparent solubility product of a carbonate mineral (e.g., aragonite, calcite)}. Acidification is expected to reduce coral reef calcification and increase reef dissolution, and the relative rates of change will likely be related to the partial pressure of CO2 (pCO2) in surface seawater, which is directly proportional to pCO2 in the atmosphere (6–8). Calcium carbonate (CaCO3) budget studies have shown that healthy coral reefs exhibit low net accretion caused by high rates of physical, chemical, and biological erosion (9). Consequently, any disturbance that causes decreased accretion or increased erosion may tip the balance from reef growth to loss.
There are many sources of CaCO3 production on coral reefs, each of which contributes to reef building in different ways. Some CaCO3 production contributes to the reef framework (e.g., reef-building corals), some to reef sediments [e.g., detrital skeletal material, some articulated calcareous algae (e.g., Halimeda)], and some to binding reef materials (e.g., encrusting coralline algae and marine cements). We focus on one piece of this complex puzzle: early marine cementation, which is thought to be a key factor promoting the rigidity and stability of reef framework materials (10–12).
Cementation is the precipitation of secondary CaCO3 that acts to bind framework components and occlude porosity (12). The high-energy seaward margins of exposed oceanic reefs are usually the most cemented reef formations and cement abundance decreases (often to zero) as water motion decreases across reef crests and into inner shelves and lagoons (13, 14). Cement precipitation does occur outside of high-flow areas (e.g., lagoonal environments), but these cements most often occur as an unlithified mud and do not bind substrate components (15). Many processes, particularly those biogeochemical processes that affect reef porewater chemistry (10–14, , 17), have been shown to influence reef cementation. Advection of seawater supersaturated with respect to CaCO3 into reef frameworks is considered a prerequisite for extensive cementation (17, 18). As a result, anthropogenic acidification may reduce future cement precipitation (19).
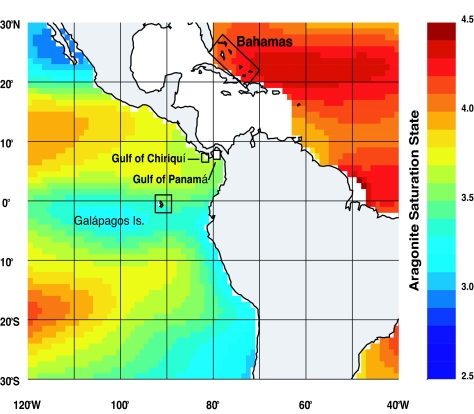
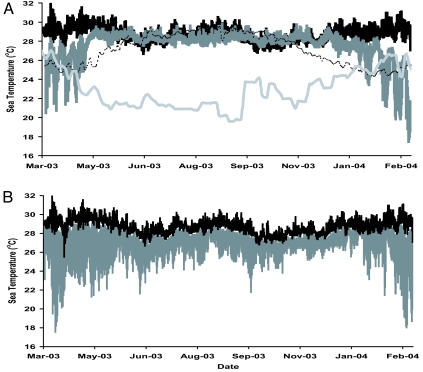
Surface waters in many parts of the eastern tropical Pacific (ETP) have lower pH, lower Ω, and higher pCO2 values relative to the rest of the tropics because upwelling processes mix CO2-enriched deep waters into the surface layers along the shallow thermocline (20) (Fig. 1). The intensity of this upwelling varies regionally and strongly influences reef development across the ETP (23). The Galápagos Islands are located along the equatorial front where the Peru Current mixes with the tropical surface water mass from the north (24). The equatorial front is characterized by sea surface temperatures (SSTs) ranging from 20°C to 24°C and salinities from 33 to 35 (25), and although the front migrates seasonally, these conditions are representative of those that influence coral communities in the Galápagos (Fig. 2A). The pacific coast of Panamá includes two separate gulfs with differing physical characteristics: the Gulf of Chiriquí and Gulf of Panamá (Fig. 3). Both gulfs experience a wet and dry season that is controlled by the position of the Intertropical Convergence Zone (26). During the wet season (end of April to mid-December), oceanographic conditions are similar in both gulfs with SSTs ranging from 27°C to 29°C and salinities from 29–33 (26, 27) (Fig. 2A). In the dry season (mid-December to the end of April), the Gulf of Panamá experiences upwelling because surface waters are advected offshore by the funneling of the northeast tradewinds through the low-lying isthmus of eastern Panamá. During upwelling, SST decreases to 16–24°C, and salinities increase to >33 (27) (Fig. 2A). The Gulf of Chiriquí does not experience upwelling because the mountainous topography of western Panamá blocks the flow of the northeast tradewinds (27). However, increased wind force in the dry season does cause shoaling of the already shallow thermocline to depths of 5–15 m (28) (Fig. 2B). Recent observations suggest that thermocline shoaling may be more common in the Gulf of Chiriquí than was previously appreciated (27).
Fig. 1.
Map showing depressed aragonite Ω (Ωarag) across the ETP in comparison to highly supersaturated waters that influence Caribbean reef sites. Aragonite is the form of CaCO3 secreted by reef-building corals and was the only type of cement found in ETP reefs. Ωarag values were estimated by combining SST, salinity, PO4, and SiO2 from the 2005 World Ocean Atlas (21) with TCO2 and TA values from the 1 × 1° gridded Global Ocean Data Analysis Project data (22).
Fig. 2.
Time series of sea temperature. (A) Uva Reef, Panamá [black line, ≈1-m mean low water (MLW)], Saboga Reef, Panamá (dark gray line, ≈1 m MLW), Lee Stocking Island, Bahamas (dashed line, ≈1 m MLW), and Galápagos (light gray line, SST). (B) Uva Reef flat (≈1 m) and 15-m depth (gray line) showing high variance in temperature at depth to illustrate apparent shoaling of shallow thermocline.
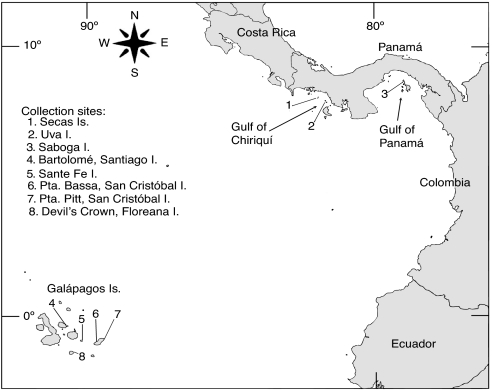
Fig. 3.
Map of the ETP indicating location of reefs sampled. Numbers denote reefs at (1) Secas Island (7° 57′18′ ′N; 82° 00′45′ ′W), (2) Uva Island (7° 48′48′ ′N; 81° 45′32“W), (3) Saboga Island (8° 37′43′ ′N; 79° 03′26′ ′W), (4) Bartolomé, Santiago Island (0° 17′17′ ′ S; 90° 33′15′ ′W), (5) Sante Fe Island (0° 48′17′ ′S; 90° 2′20′ ′W), (6) Punta Bassa (0° 49′N; 89° 32′W), (7) Pta. Pitt (0° 42′30′ ′S; 89° 15′W), San Cristóbal Island, and (8) Devil's Crown, Floreana Island (1° 12′5′ ′S; 90° 25′23′ ′W).
Regardless of the nature of the upwelling, the Ω of the surface layers in the ETP is strongly influenced by subthermocline waters. This is illustrated by the fact that the pCO2 of most surface waters in the ETP is higher than atmospheric pCO2 (29). The Ω of tropical surface waters in nonupwelling regions of the globe are near equilibrium with and controlled by the atmospheric concentration of CO2 (6).
The first scientists to visit the ETP, including Charles Darwin, commented on the apparent absence of reef development (30). Structural reefs were later discovered and found to have rapid accretion rates over the past 5,600 years, rivaling Holocene reef accretion rates elsewhere (31, 32). Despite rapid accretion in certain areas, ETP reefs are thin accumulations of CaCO3 relative to those in the Indo-Pacific and Caribbean, small in areal extent (≈1–2 hectares), limited to depths of <10 m, patchily distributed, and likely ephemeral on geologic time scales (28, 31). This poor reef development in the ETP was originally considered a consequence of colder temperatures and turbidity from frequent upwelling (28) and later the consequence of El Niño-related climate variability (33).
This study addresses whether reef cementation in the ETP reflects geographical gradients in seawater carbonate chemistry. We also address evidence that reef cementation reflects and/or plays a role in reef development in this region. Samples of coral reef framework were collected for analysis of cement abundances and types from reef sites in the Galápagos, Gulf of Chiriquí, and Gulf of Panamá (Fig. 3). For comparison, cements were also analyzed from reef framework samples from the Bahamas, a region with normal to high Ω (Fig. 1). Seawater carbonate chemistry was analyzed from discrete samples taken over several years from the ETP reef sites.
Results
CO2-System Variability Across ETP Sites.
Temperature, salinity, total CO2 (TCO2), total alkalinity (TA), pH, pCO2 and Ωarag values were significantly different across the ETP sites (Kruskal-Wallis tests, P < 0.0001 for all tests) (Table 1 and Fig. 2). In the Galápagos Islands, salinity, TCO2, TA, and pCO2 values were significantly greater than in Panamá, and temperature, pH, and Ωarag values were significantly lower (Mann–Whitney U tests, P < 0.0001 for all tests). Values of TA were no different between ETP sites when normalized to salinity (nTA: Kruskal-Wallis test, χ2 = 1.8, df = 2, P ≫ 0.1); nTCO2 values, however, were different (χ2 = 69.8, df = 2, P < 0.0001).
Table 1.
Measured environmental and geochemical variables for ETP reef sites compared to estimated average values for the Bahamas and overall tropical surface ocean
| Location | Data description | Year | n | Salinity | TCO2,μmol·kg−1 | TA,μeq·kg−1 | pH,sws | pCO2,μatm | Ωarag |
|---|---|---|---|---|---|---|---|---|---|
| Galápagos* | Field data | 2003 | 23 | 35.1 (0.01) | 2091.2 (5.27) | 2299.3 (5.39) | 7.88 (0.02) | 636 (25.4) | 2.49(0.072) |
| Panamá-G. of Panamá (Saboga Reef)† | Field data: dry season, upwelling | 2005 | 12 | 33.4 (0.04) | 1932.7 (8.02) | 2176.6 (7.00) | 8.01 (0.01) | 422 (11.7) | 2.79 (0.054) |
| Panamá-G. of Panamá (Saboga Reef)† | Field data: wet season, nonupwelling | 2007 | 12 | 28.4 (0.09) | 1624.3 (5.79) | 1869.5 (1.51) | 8.01 (0.01) | 368 (11.6) | 2.96 (0.058) |
| Panamá-G. of Chiriquí (Uva Reef)‡ | Field data: dry season, increased shoaling of thermocline | 2004, 2005, 2006 | 46 | 33.1 (0.05) | 1851.6 (8.53) | 2145.3 (6.92) | 7.98 (0.02) | 447 (22.2) | 3.50 (0.090) |
| Panamá-G. of Chiriquí (Uva Reef)‡ | Field data: wet season, nonupwelling | 2003, 2006, 2007 | 36 | 30.5 (0.08) | 1723.3 (8.40) | 2018.5 (6.30) | 8.04 (0.01) | 353 (10.3) | 3.53 (0.080) |
| Bahamas§ | Estimated | 1990s | 36.4 | 2028 | 2382 | 8.07 | 368 | 4.0 | |
| Tropical surface ocean§ | Estimated | 1880 (preindustrial) | 35.1 | 1930 | 2315 | 8.16 | 280 | 4.3 | |
| Tropical surface ocean§ | Estimated | 1990s | 35.1 | 1969 | 2315 | 8.09 | 340 | 3.8 | |
| Tropical surface ocean§ | Estimated | 2 × CO2 | 35.1 | 2061 | 2315 | 7.91 | 560 | 3.0 |
Values represent means (± SEM if applicable). Average values for the Bahamas (20–28°N, 70–80°W) and the entire tropical surface ocean (30°N to 30°S) were estimated by combining the 2005 World Ocean Atlas (21) and GLODAP dataset (22). Preindustrial and 2 × CO2 values were estimated by assuming 1990s values for salinity, PO4, SiO2, and TA, and adjusting SST and TCO2 in accordance with past records and future climate projections.
*Average SST and nutrient concentrations measured in surface layers (<5 m) near Galápagos Islands from 1980 to 2005 used for CO2-system calculations [SST = 22.3°C, PO4 = 0.6 μM, SiO2 = 4.8 μM (34)].
†CO2-system calculations for Saboga Reef in 2005 (n = 12, during upwelling pulse) all use 21°C because in situ temperature data were unavailable, so this is an approximate modal SST for upwelling pulses [range: 16- 24°C (27)]. In situ temperature was used for wet season calculations. Bi-annual nutrient concentrations were used because of the effect of seasonal upwelling [dry season (upwelling): PO4 = 0.83 μM, SiO2 = 8.93 μM; wet season (nonupwelling): PO4 = 0.21 μM, SiO2 = 3.61 μM (27)].
‡In situ temperature and annual mean nutrient concentrations measured in surface layers (<20 m) used for calculations as nutrient values did not differ significantly across seasons in the Gulf of Chiriquí [PO4 = 0.19 μM, SiO2 = 4.55 μM (27)].
§SST and nutrient concentrations for Bahamas: SST = 26.5°C, PO4 = 0.06 μM, SiO2 = 1.64 μM; for average tropical surface ocean water: SSTpre-ind. = 25.5°C, SST1990 s = 25.9°C, SST2xCO2 = 27.5°C, PO4 = 0.23 μM, SiO2 = 2.28 μM (21).
CO2-System Variability Within Panamá Sites.
Salinity, TCO2, TA, and pCO2 were significantly higher during the dry season in both gulfs because of seasonal upwelling (Tables 1 and 2). Temperature was stable year-round in the surface layers of the Gulf of Chiriquí, but was significantly depressed in the Gulf of Panamá during the dry season (Fig. 2A and Table 2). Ωarag values were lower in the dry season in both gulfs (Table 1), but this difference was only significant in the Gulf of Panamá (Table 2). In the Gulf of Chiriquí, pH was significantly depressed in the dry season, but was no different in the Gulf of Panamá (Tables 1 and 2).
Table 2.
Seasonal differences (wet vs. dry) in environmental and geochemical variables within Panamá sites
| Variable | Gulf of Chiriquí |
Gulf of Panamá |
||
|---|---|---|---|---|
| U | P | U | P | |
| Temperature | 1,371 | NS | 222 | < 0.001 |
| Salinity | 666 | < 0.0001 | 78 | < 0.001 |
| TCO2 | 753 | < 0.0001 | 78 | < 0.001 |
| TA | 721 | < 0.0001 | 78 | < 0.001 |
| pH | 1,812 | < 0.01 | 151 | NS |
| pCO2 | 1,075 | < 0.0001 | 103 | < 0.01 |
| Ωarag | 1,393 | NS | 186 | < 0.05 |
U is the calculated Mann-Whitney statistic, and P is probability that the two distributions were not significantly different. NS, not significant.
CO2-System Variability Between Panamá Sites.
When data were pooled and season was ignored, salinity, TCO2, TA, pH, and pCO2 were no different between Panamanian gulfs, yet temperature and Ωarag were significantly higher in the Gulf of Chiriquí (Table 3). During the upwelling dry season, pH and pCO2 were no different between gulfs, but salinity, TCO2, and TA were significantly lower, and temperature and Ωarag were significantly higher in the Gulf of Chiriquí (Tables 1 and 3). The higher salinity, TCO2, and TA but lower temperature and Ωarag in the Gulf of Panamá during the dry season reflects the greater intensity of upwelling there. During the nonupwelling wet season, salinity, TCO2, TA, and Ωarag were significantly depressed in the Gulf of Panamá relative to the Gulf of Chiriquí, whereas pCO2, pH, and temperature were no different (Tables 1 and 3). These differences reflect greater freshwater dilution in the surface layers of the Gulf of Panamá during the wet season (Table 1).
Table 3.
Differences in environmental and geochemical variables between Panamá sites
| Variable | Pooled data |
Wet season |
Dry season |
|||
|---|---|---|---|---|---|---|
| U | P | U | P | U | P | |
| Temperature | 818 | < 0.001 | 320 | NS | 78 | <0.0001 |
| Salinity | 1,156 | NS | 78 | <0.0001 | 502 | <0.01 |
| TCO2 | 1,254 | NS | 98 | <0.0001 | 580 | <0.0001 |
| TA | 1,142 | NS | 78 | <0.0001 | 488 | <0.05 |
| pH | 1,239 | NS | 227 | NS | 399 | NS |
| pCO2 | 1,328 | NS | 301 | NS | 356 | NS |
| Ωarag | 462 | <0.0001 | 103 | <0.0001 | 134 | <0.0001 |
Abbreviations as in Table 2.
Cement Abundances in ETP Coral Reef Frameworks.
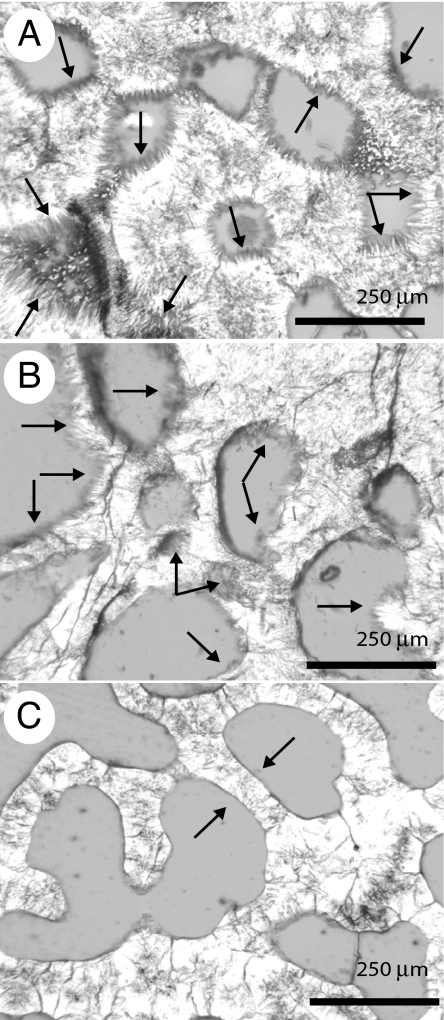
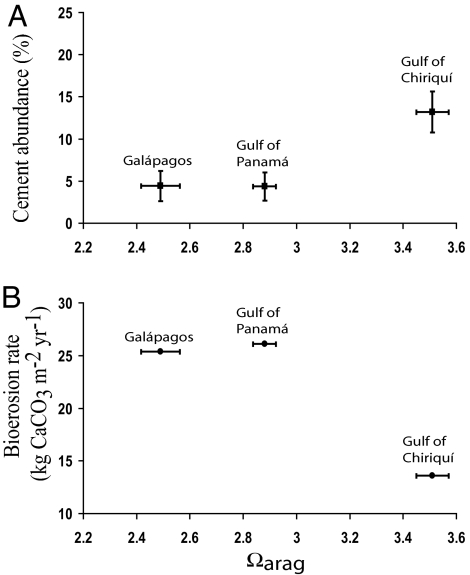
Cements were absent from most intraskeletal pores in the Panamá and Galápagos samples (Table 4 and Fig. 4). Macroborings and microborings lacked cement. The cements present were thin (typically <8 microns) fringes of acicular aragonite and in no case did cements completely occlude intraskeletal porosity. No high-Mg calcite cements were observed. Cement abundance was positively related to Ωarag, but inversely related to bioerosion rate in the ETP (Fig. 5). Cements were rarest in the Galápagos samples; 12 of the 20 samples had cement in <2% of the intraskeletal pores and 6 of these samples had no cement whatsoever. In contrast to the ETP samples, 60% of the intraskeletal pores in the reference samples from Lee Stocking Island, Bahamas contained cement (Fig. 4A).
Table 4.
Intraskeletal cement abundance of coral framework components
| Location | Site | Cement abundance, % | Range | n |
|---|---|---|---|---|
| Panamá | ||||
| G. of | Uva Reef | 16.1 (3.6) | 0–35 | 12 |
| Chiriquí | Secas Reef | 8.9 (2.5) | 4–23 | 9 |
| G. of | ||||
| Panamá | Saboga Reef | 4.4 (1.7) | 1–13 | 6 |
| Galápagos | San Cristóbal | 1.5 (0.8) | 0–6 | 7 |
| Sante Fe | 7.6 (3.7) | 0–29 | 9 | |
| Bartolomé | 0 | 2 | ||
| Devil's Crown | 4.6 (1.4) | 3–6 | 2 |
When present, the amount of marine cement is typically described as significant or extensive, and the rates of cementation are interpreted to have been fast (tens to thousands of years). For example, Perry (35) described cementation as having a “dominant” importance in the preservation of reef frameworks in Jamaica if at least 75–100% of skeletal pores contained cement or sediment, “secondary” if 50–75% of skeletal pores contained cements, and “minor” if <50% were partially filled. We also add the category of “trace” importance if <25% of skeletal pores contained cements. Mean cement abundances for all ETP samples represent trace amounts. See Fig. 3 for locations of reef sites. Data points represent the mean percentage (± SEM) of coral pores with cements by site.
Fig. 4.
Thin-section photomicrographs of cement distributions. All images are at the same magnification. (A) Abundant cementation in the intraskeletal cavities of a coral from Lee Stocking Island, Bahamas with arrows pointing to examples of aragonite cement crystals. (B) Example of most heavily cemented ETP sample from Uva Reef, Panamá. Note that even when present, the thickness, continuity, and size of the aragonite crystals are less than the cements at Lee Stocking Island (A). (C) Sample from San Cristóbal Island, Galápagos, in which no cement is present in any intraskeletal pore. Note the sharp boundary between pore and skeletal wall (arrows). (Scale bars: 250 μm.)
Fig. 5.
Ωarag for ETP reef sites plotted against cement abundance (A) and bioerosion rate (B). Data points represent means (± SEM if available). See Table 5 and references cited therein for ETP bioerosion rates.
Discussion
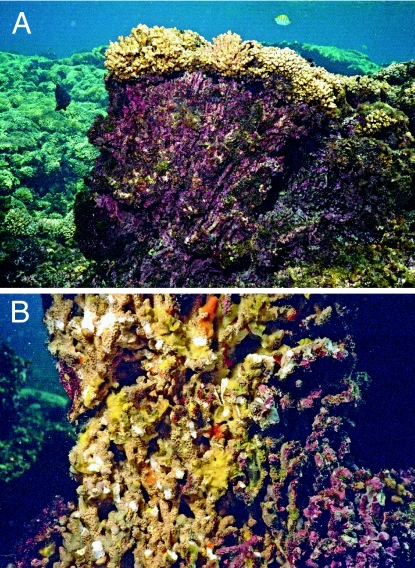
ETP reefs provide a real-world example of coral reef growth and development in low-Ω waters. The precipitation of inorganic cements is highly limited in these low-Ω reef environments. In turn, poorly cemented reef framework components are only held in place by a thin envelope of encrusting organisms, namely crustose coralline algae (CCA) and an organic matrix of sponges and other infauna (Fig. 6). This point is important given that the geologic record suggests that encrustation by CCA is insignificant and subordinate to cementation in the construction and binding of framework structures (36). Indeed, bioerosion rates in the Galápagos Islands and Panamá are among the highest measured for any reef system to date (37–39) (Table 5).
Fig. 6.
Typical ETP pocilloporid reef framework. (A) Vertical relief of framework structure ≈1 m. Dead surface is heavily encrusted with crustose coralline algae (red and purple hues). (B) Recently fractured pocilloporid reef framework. Note abundance of sponges (yellow and orange hues) growing within interlocking framework components. Diameter of Pocillopora branches are ≈1 cm. Photos were taken at Uva Reef by C.M.E. in 2003.
Table 5.
Maximum bioerosion rates in the Galápagos and Panamá compared to other reef regions
| Location and substrate | Bioerosion rate,kg CaCO3· m−2·yr−1 | Ref. |
|---|---|---|
| Galápagos(blocks of Porites lobata) | 25.4 | 37 |
| Panamá-G. of Panamá(Saboga Reef) | 26.1 | 38 |
| Panamá-G. of Chiriquí(Uva Reef) | 13.6 | 39 |
| St. Croix, US Virgin Islands | 0.2 | 40 |
| Lee Stocking I., Bahamas | 0.5 | 41 |
| Kenya reefs (based on echinoid gut contents) | 1.2 | 42 |
| Great Barrier Reef(blocks of Porites) | 2.1 | 43 |
| French Polynesia lagoons(blocks of Porites lutea) | 2.5 | 44 |
| Reunion and Moorea Reef flats | 8.0 | 45 |
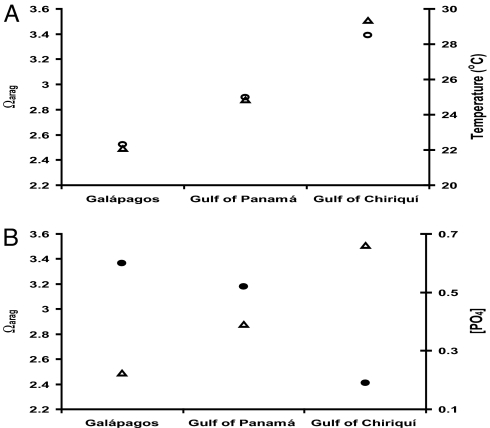
Although ETP reefs may provide insights into the future of coral reef development in a high-CO2 world, a direct extrapolation is confounded by the coincidence of low Ωarag with low temperatures and high nutrients in upwelled waters (Fig. 7). Regardless, these naturally occurring low-Ωarag reefs provide the only known real-world examples by which to estimate the future of coral reef function and structure in an acidified ocean.
Fig. 7.
Relationship of Ωarag (△ in both plots) with temperature (A; ○) and phosphate concentration [PO4] (B; ●). High phosphate levels inhibit aragonite precipitation in natural seawater (see ref. 46 and references therein) and could also be a factor in the low cementation of ETP reefs. Note inverse relationship between Ωarag and [PO4]. See Table 1 for [PO4] and temperature values. Values represent approximate annual means.
In summary, this study suggests a link between Ωarag, inorganic reef cementation, and coral reef development in the ETP. Of particular importance are the insights provided into the role of decreasing Ω on reefs beyond the prediction of reduced calcification by corals and other primary reef builders. The ETP examples suggest that coral reefs of the future could be more susceptible to erosion. These results will likely not apply to highly cemented coral reef frameworks that developed in high-Ω seawater. Rather, this study implies that new reef development and accretion may be limited in a high-CO2 world.
Materials and Methods
Carbonate Chemistry Analysis.
Seawater samples were collected in 500-ml borosilicate bottles via SCUBA from the Uva Reef during three wet (September 2003 and 2006, August 2007) and three dry seasons (March 2004, 2005, 2006) and also from five former reef sites in the Galápagos Islands in May 2003 (Fig. 3) [see ref. 47 for a description of Galápagos coral reef sites before the 1982–1983 El Niño-Southern Oscillation (ENSO) warming event]. Modest sampling (n = 12; March 2005) was performed during an upwelling pulse (dry season) and in the nonupwelling wet season (n = 12; August 2007) on the Saboga Reef in the Gulf of Panamá (Fig. 3). All seawater samples were immediately preserved with ≈200 μl of saturated HgCl2 solution. Sampling in Galápagos and the Gulf of Panamá was limited to daylight hours. For consistency, only those samples collected during the day from the Uva Reef were used for comparison and are presented. Temperature at the time of sampling in Panamá was obtained from a HOBO (Onset) thermistor fixed on the reef that logged temperature every 30 min. TCO2 was measured coulometrically, whereas TA was determined by using a gran titration (7). The calculation of seawater pCO2, pH, and Ωarag was done with the CO2SYS computer program (48) by using the dissociation constants of Mehrbach et al. (49) as refit by Dickson and Millero (50) for carbonic acid and Dickson (51) for boric acid. Ωarag was calculated according to Mucci (52). The nonparametric Mann–Whitney U test was used for statistical comparisons between two sites, whereas the Kruskal–Wallis one-way ANOVA (nonparametric) was used when more than two sites were compared.
SSTs presented for Lee Stocking Island, Bahamas were obtained from the National Oceanic and Atmospheric Administration's Integrated Coral Observing Network (ICON) pylon and represent an approximate seasonal cycle. The seasonal cycle was estimated by taking an average of all available temperature data from the ICON station from 2002 to 2006. Galápagos SSTs were obtained from advanced very high-resolution radiometer (AVHRR) satellite data available online (see coralreefwatch.noaa.gov/satellite/current/sst_series_24reefs.html for AVHRR SST data).
Reef Framework Sample Collection and Analysis.
In situ coral reef framework was collected concurrently with seawater samples from Panamá (March 2003) and the Galápagos Islands (May 2003) (Fig. 3). Sampling in Galápagos was fortuitous as coral-derived CaCO3 was sparse and in situ reef framework was absent from all sites except one (Devil's Crown, Floreana Island; Fig. 3) because of the rapid bioerosion and loss of framework structures that occurred after the mass coral mortality associated with the 1982–1983 ENSO warming event (37). Forty-seven thin sections were examined from the Gulf of Chiriquí [Uva (n = 12) and Secas (n = 9) reefs], Gulf of Panamá [Saboga Reef (n = 6)], and four Galápagos sites (n = 20). Quantification of cements was determined by delineating four to five uniformly spaced transect lines across each thin section and counting the total number of pores with and without cements that were intersected by each line.
Acknowledgments.
R. Wanninkhof and F. Millero kindly allowed access to their laboratories and equipment. E. Peltola helped with the coulometric TCO2 analysis. J. Maté provided temperature data for Panamá sites. Field assistance in Panamá was provided by R. Albright, I. Bethancourt, A. M. S. Correa, I. Enochs, G. Hockensmith, L. Max, and T. Smith. D.P.M. thanks J. Hendee for his continued support. The comments of two anonymous reviewers substantially improved this manuscript. Field support was provided by National Science Foundation Grants OCE-00002317 and OCE-0526361 (to P.W.G.).
Footnotes
The authors declare no conflict of interest.
This article is a PNAS Direct Submission.
References
- 1.Intergovernmental Panel on Climate Change. Climate Change 2007: The Physical Science Basis: Contribution of Working Group I to the Fourth Assessment Report of the Intergovernmental Panel on Climate Change. In: Solomon S, et al., editors. New York: Cambridge Univ Press; 2007. [Google Scholar]
- 2.Sabine CL, et al. The oceanic sink for anthropogenic CO2. Science. 2004;305:367–371. doi: 10.1126/science.1097403. [DOI] [PubMed] [Google Scholar]
- 3.Feely RA, et al. Impact of anthropogenic CO2 on the CaCO3 system in the oceans. Science. 2004;305:362–366. doi: 10.1126/science.1097329. [DOI] [PubMed] [Google Scholar]
- 4.Orr JC, et al. Anthropogenic ocean acidification over the 21st century and its impact on calcifying organisms. Nature. 2005;437:681–686. doi: 10.1038/nature04095. [DOI] [PubMed] [Google Scholar]
- 5.Caldeira K, Wickett ME. Anthropogenic carbon and ocean pH. Nature. 2003;425:365. doi: 10.1038/425365a. [DOI] [PubMed] [Google Scholar]
- 6.Kleypas JA, et al. Geochemical consequences of increased atmospheric carbon dioxide on coral reefs. Science. 1999;284:118–120. doi: 10.1126/science.284.5411.118. [DOI] [PubMed] [Google Scholar]
- 7.Langdon C, et al. Effect of calcium carbonate saturation state on the calcification rate of an experimental coral reef. Glob Biogeochem Cyc. 2000;14:639–654. [Google Scholar]
- 8.Yates KK, Halley RB. CO32− concentration and pCO2 thresholds for calcification and dissolution on the Molokai reef flat, Hawaii. Biogeosci Discuss. 2006;3:123–154. [Google Scholar]
- 9.Glynn PW. Bioerosion and coral reef growth: a dynamic balance. In: Birkeland C, editor. Life and Death on Coral Reefs. New York: Chapman and Hall; 1997. pp. 68–95. [Google Scholar]
- 10.Macintyre IG, Marshall JF. Submarine lithification in coral reefs: Some facts and misconceptions. In: Choat JH, et al., editors. Proceedings of the Sixth International Coral Reef Symposium; Townsville, Australia: Australian Institute of Marine Science; 1988. pp. 263–272. [Google Scholar]
- 11.Rasser MW, Riegl B. Holocene coral reef rubble and its binding agents. Coral Reefs. 2002;21:57–72. [Google Scholar]
- 12.Perry CT, Hepburn LJ. Syn-depositional alteration of coral reef framework through bioerosion, encrustation, and cementation: Taphonomic signatures of reef accretion and reef depositional events. Earth Sci Rev. 2008;86:106–144. [Google Scholar]
- 13.James NP, Ginsburg RN, Marzalek DS, Choquette PW. Facies and fabric specificity of early subsea cements in shallow Belize (British Honduras) reefs. J Sed Petrol. 1976;46:523–544. [Google Scholar]
- 14.James NP, Ginsburg RN. The Seaward Margin of Belize Barrier and Atoll Reefs. Oxford: Blackwell; 1979. [Google Scholar]
- 15.Macintyre IG, Aronson RB. Lithified and unlithified Mg-calcite precipitates in tropical reef environments. J Sed Res. 2006;76:81–90. [Google Scholar]
- 16.Tribble GW. Organic matter oxidation and aragonite diagenesis in a coral reef. J Sed Petrol. 1993;63:523–527. [Google Scholar]
- 17.Tribble GW, Sansone FJ, Buddemeier RW, Li Y-H. Hydraulic exchange between a coral reef and surface sea water. Geol Soc Am Bull. 1992;104:1280–1291. [Google Scholar]
- 18.Buddemeier RW, Oberdorfer JA. Internal hydrology and geochemistry of coral reefs and atoll islands: Key to diagenetic variations. In: Schroeder JH, Purser BH, editors. Reef Diagenesis. Heidelberg: Springer; 1986. pp. 91–111. [Google Scholar]
- 19.Andersson AJ, Mackenzie FT, Ver LM. Solution of shallow-water carbonates: An insignificant buffer against rising atmospheric CO2. Geology. 2003;31:513–516. [Google Scholar]
- 20.Millero FJ. The marine inorganic carbon cycle. Chem Rev. 2007;107:308–341. doi: 10.1021/cr0503557. [DOI] [PubMed] [Google Scholar]
- 21.Boyer TP, et al. In: World Ocean Database 2005. Levitus S, editor. Washington, DC: US Government Printing Office; 2006. [Google Scholar]
- 22.Sabine CL, et al. Global Ocean Data Analysis Project: Results and Data. Oak Ridge, TN: Carbon Dioxide Information Analysis Center, Oak Ridge National Laboratory, U.S. Department of Energy; 2005. ORNL/CDIAC-145, NDP-083. [Google Scholar]
- 23.Cortés J. Biology and geology of eastern Pacific coral reefs. Coral Reefs. 1997;16:39–46. [Google Scholar]
- 24.Fiedler PC, Talley LD. Hydrography of the eastern tropical Pacific: A review. Progr Oceanogr. 2006;69:143–180. [Google Scholar]
- 25.Glynn PW. Coral communities and coral reefs of Ecuador. In: Cortés J, editor. Latin America Coral Reefs. Amsterdam: Elsevier; 2003. pp. 449–472. [Google Scholar]
- 26.Glynn PW, Maté JM. Field guide to the Pacific coral reefs of Panamá. In: Lessios HA, Macintyre IG, editors. Proceedings of the Eighth International Coral Reef Symposium; Panama: Smithsonian Tropical Research Institute; 1997. pp. 145–166. [Google Scholar]
- 27.D'Croz L, O'Dea A. Variability in upwelling along the Pacific shelf of Panamá and implications for the distribution of nutrients and chlorophyll. Est Coastal Shelf Sci. 2007;73:325–340. [Google Scholar]
- 28.Dana TF. Development of contemporary eastern Pacific coral reefs. Mar Biol. 1975;33:355–374. [Google Scholar]
- 29.Takahashi T, et al. Global air-sea flux of CO2: An estimate based on measurements of sea–air pCO2 difference. Proc Natl Acad Sci USA. 1997;94:8292–8299. doi: 10.1073/pnas.94.16.8292. [DOI] [PMC free article] [PubMed] [Google Scholar]
- 30.Darwin C. The Structure and Distribution of Coral Reefs. London: Smith, Elder and Co; 1842. [Google Scholar]
- 31.Glynn PW, Stewart RH, McCosker JE. Pacific coral reefs of Panamá: Structure, distribution, and predators. Geol Rundsch. 1972;61:483–519. [Google Scholar]
- 32.Glynn PW, Macintyre IG. Growth rate and age of coral reefs on the Pacific coast of Panamá. In: Taylor DL, editor. Proceedings of the Third International Coral Reef Symposium; Miami: Rosenstiel School of Marine and Atmospheric Science; 1977. pp. 251–259. [Google Scholar]
- 33.Glynn PW, Colgan MW. Sporadic disturbances in fluctuating coral reef environments: El Niño and coral reef development in the eastern Pacific. Am Zool. 1992;32:707–718. [Google Scholar]
- 34.Pennington JT, et al. Primary production in the eastern tropical Pacific: A review. Progr Oceanogr. 2006;69:285–317. [Google Scholar]
- 35.Perry CT. Reef framework preservation in four contrasting modern reef environments, Discovery Bay, Jamaica. J Coastal Res. 1999;15:796–812. [Google Scholar]
- 36.Macintyre IG. Reevaluating the role of crustose coralline algae in the construction of coral reefs. In: Lessios HA, Macintyre IG, editors. Proceedings of the Eighth International Coral Reef Symposium; Panamá: Smithsonian Tropical Research Institute; 1997. pp. 725–730. [Google Scholar]
- 37.Reaka-Kudla ML, Feingold JS, Glynn PW. Experimental studies of rapid bioerosion of coral reefs in the Galápagos Islands. Coral Reefs. 1996;15:101–107. [Google Scholar]
- 38.Eakin CM. PhD dissertation. Miami: University of Miami; 1991. [Google Scholar]
- 39.Eakin CM. Where have all the carbonates gone? A model comparison of calcium carbonate budgets before and after the 1982–1983 El Niño at Uva Island in the eastern Pacific. Coral Reefs. 1996;15:109–119. [Google Scholar]
- 40.Hubbard DK, Miller AI, Scaturo D. Production and cycling of calcium carbonate in a shelf-edge reef system (St. Croix, U.S. Virgin Islands): Applications to the nature of reef systems in the fossil record. J Sed Res. 1990;60:335–360. [Google Scholar]
- 41.Vogel K, Gektidis M, Golubic S, Kiene WE, Radtke G. Experimental studies on microbial bioerosion at Lee Stocking Island, Bahamas and One Tree Island, Great Barrier Reef, Australia: Implications for paleoecological reconstructions. Lethaia. 2000;33:190–204. [Google Scholar]
- 42.Carreiro-Silva M, McClanahan TR. Echinoid bioerosion and herbivory on Kenyan coral reefs: The role of protection from fishing. J Exp Mar Biol Ecol. 2001;262:133–153. doi: 10.1016/s0022-0981(01)00288-x. [DOI] [PubMed] [Google Scholar]
- 43.Tribollet A, Golubic S. Cross-shelf differences in the pattern and pace of bioerosion of experimental carbonate substrates exposed for 3 years on the northern Great Barrier Reef, Australia. Coral Reefs. 2005;24:422–434. [Google Scholar]
- 44.Pari N, et al. Bioerosion of experimental substrates on high islands and on atoll lagoons (French Polynesia) after two years of exposure. Mar Ecol Prog Ser. 1998;166:119–130. [Google Scholar]
- 45.Peyrot-Clausade M, et al. Sea urchin and fish bioerosion in La Réunion and Moorea reefs. Bull Mar Sci. 2000;66:477–485. [Google Scholar]
- 46.Morse JW, Arvidson RS, Luttge A. Calcium carbonate formation and dissolution. Chem Rev. 2007;107:342–381. doi: 10.1021/cr050358j. [DOI] [PubMed] [Google Scholar]
- 47.Glynn PW, Wellington GM. Corals and Coral Reefs of the Galápagos Islands. Berkeley: Univ California Press; 1983. [Google Scholar]
- 48.Lewis E, Wallace DWR. Program Developed for CO2 System Calculations. Oak Ridge, TN: Carbon Dioxide Information Analysis Center, Oak Ridge National Laboratory, U.S. Dept. of Energy; 1998. ORNL/CDIAC-105. [Google Scholar]
- 49.Mehrbach C, Culberson CA, Hawley JE, Pytokwicz RM. Measurement of the apparent dissociation constants of carbonic acid in seawater at atmospheric pressure. Limnol Oceanogr. 1973;18:897–907. [Google Scholar]
- 50.Dickson AG, Millero FJ. A comparison of the equilibrium constants for the dissociation of carbonic acid in seawater media. Deep Sea Res A. 1987;34:1733–1743. [Google Scholar]
- 51.Dickson AG. Thermodynamics of the dissociation of boric acid in synthetic seawater from 273.15 to 318.15 °K. Deep Sea Res A. 1990;37:755–766. [Google Scholar]
- 52.Mucci A. The solubility of calcite and aragonite in seawater at various salinities, temperatures, and one atmosphere total pressure. Am J Sci. 1983;283:780–799. [Google Scholar]


