

Abstract
Conventional microscopy, electron microscopy, and imaging techniques such as MRI and PET commonly generate large stacks of images of the sectioned brain. In other domains, such as neurophysiology, variables such as space or time are also varied along a stack axis. Digital image sizes have been progressively increasing and in virtual microscopy, it is now common to work with individual image sizes that are several hundred megapixels and several gigabytes in size. The interactive visualization of these high-resolution, multiresolution images in 2D has been addressed previously (Sullivan & Baker, 1994). Here, we describe a method for interactive visualization of multiresolution image stacks in 3D.
The method, characterized as quad-tree based multiresolution image stack interactive visualization using a texel projection based criterion, relies on accessing and projecting image tiles from multiresolution image stacks in such a way that, from the observer’s perspective, image tiles all appear approximately the same size even though they are accessed from different tiers within the images comprising the stack. This method enables efficient navigation of high-resolution image stacks. We implement this method in a program called StackVis, which is a Windows-based, interactive 3D multiresolution image stack visualization system written in C++ and using OpenGL. It is freely available at http://brainmaps.org.
Introduction
The interactive visualization of high-resolution multiresolution images in virtual microscopy (Ferreira et al., 1997; Afework, 1998; Felten, Strauss, Okada, & Marchevsky, 1999; Romer & Suster, 2003), poses several problems. In 2-dimensional (2D) image visualization, solutions have been available, both in principle (Panusopone, Sarika, & Cheevasuvit, 1994; Rui, Huang, & Chang, 1999; Sullivan & Baker, 1994), and in practice through software applications such as Zoomify (Zoomify Inc., Santa Cruz, CA, USA). However, for 3D image visualization, existing products are not designed to handle stacks of multiresolution images, and mostly deal with volumes having nearly isotropic resolution. Here, we describe a method and system for interactive visualization of multiresolution images and image stacks in 3D. Our implementation, StackVis, is fully interactive in 3D, and has zooming, panning, and rotating capabilities.
Materials and Methods
Multiresolution Images, Quad Trees, and Image Stacks
By ‘multiresolution image’, we mean that each image consists of a hierarchical image pyramid composed of small image tiles (Figure 1A). The multiresolution images we employ are divided into tiles organized as quad-trees. A quad-tree (Finkel & Bentley, 1974; Samet, 1984) models a two-dimensional region by recursively dividing it into quadrants. These quadrants are referred to as ’children’ of the ’parent’ tile. Thus, each ’parent’ tile has up to four ’children’. By ’image stack’, we mean a set of two or more images arranged in such a way that their planes are parallel to each other.
Figure 1.

(A) Each multiresolution image consists of a multi-resolution image pyramid composed of small image tiles. Multiresolution images allow for rapid navigation through very large images by loading only the image tiles that are currently being viewed. (B) Viewing multiresolution image stacks in 3D. The method involves recursively collecting the children of loaded tiles whose texels (texture elements) project to more than a pixel or two on the screen, the result being that texels nearer the observer tend to come from higher-resolution tiers of images in the image pyramid in the multiresolution image stack.
Methodology
The method depends on correctly addressing and loading image tiles, progressively, from multiresolution image stacks. Specifically, for a given perspective adopted by the observer (or end-user) there is an optimal cut (or partition) of the quad tree for a given multiresolution image such that select texels (texture elements) of each loaded image tile do not project to more than one or two pixels on the computer screen. Image tile requests are loaded in order to adaptively reach the optimal cut of the quad tree. This method may be characterized as quad-tree based multiresolution image stack interactive visualization using a texel projection based criterion, and serves to differentiate it from alternative methods that rely on non-quad-tree based multiresolution images or alternative criteria such as camera distance based instead of texel projection based.
The result is that texels nearer the observer tend to come from higher-resolution tiers in the image pyramid corresponding to an image in the multiresolution image stack (Figure 1B). From a list of currently loaded image tiles, we take the one whose texels project to the greatest area on the screen and fetch the children, if they exist, of the parent tile, spreading the fetches over multiple frames. Using this method, it is possible to rapidly visualize and interact in 3D with high-resolution multiresolution image stacks.
From the observer’s perspective, image tiles appear approximately the same size even though they are accessed from different tiers within the multiresolution images comprising the image stack (Figure 2).
Figure 2.

Example of viewing a single multiresolution image from an image stack in 3D using StackVis. (A) The multiresolution image is a coronal Nissl-stained section from an African green monkey (Chlorocebus aethiops) brain. The ’eye’ in the lower left denotes the observer’s location, which results in the perspective given in (B). (C) With the addition of spacing between image tiles from the observer’s perspective, the image tiles appear approximately the same size even though accessed from different tiers within the multiresolution image. (D) Examining the individual image tiles that the observer sees in (B), demonstrates that image tiles closer to the observer (i.e., to the eye at lower left) ’appear’ smaller than those farther away, even though all image tiles are actually the same size (in this case, 256×256 pixels), a consequence of their being located in different tiers of the image pyramid corresponding to the multiresolution image.
Implementation
Figure 3 shows our implementation of the 3D multiresolution image stack viewer, StackVis. The data used to illustrate StackVis is fetched from our BrainMaps.org server (Mikula, Trotts, Stone, & Jones, 2007), a capability natively built-in to StackVis. Whenever the CPU is idle, StackVis does the following: It checks to see whether any pending tile downloads have ended. For each ended download, StackVis loads the 256×256 JPEG image tile from the disk and uses it to create an OpenGL texture map. Next, StackVis recursively collects the children of loaded tiles whose texels project in a certain manner to pixels on the screen (for example, if a given texel projects to more than one pixel on the screen). From the list of currently loaded image tiles, StackVis takes the tile whose texels project to the greatest area on the screen and fetches its four children from the server. When rendering the tile quad tree, StackVis uses only a cut of the tree. For example, it renders either a tile or its children but not both. Because the slides are rendered semi-transparently; a visual artifact results if a tile is rendered along with some of its children.
Figure 3.

Viewing a stack of images using either (A) perspective or (B) orthographic projections. Occlusion of sections using the perspective projection (A) is not present when using the orthographic projection (B). The dataset in both cases is a coronal Nissl-stained series from an African green monkey (Chlorocebus aethiops) brain.
Further enhancement of visual clarity is accomplished by making the backgrounds of the slides transparent. This involves fitting a mixture of Gaussians to the intensity histogram of each thumbnail image, using the Soft K-Means algorithm (MacKay, 2003) with K=4. The two Gaussians with lowest means are assumed to be grey matter and white matter or ventricles, while the upper two are assumed to be dirty slide background (which may result from dust, particles, or other sources) and clean slide background. A lookup table is then computed that maps intensities to probabilities that pixels with these intensities are in the foreground. As tiles are loaded, each of their pixels is assigned an opacity equal to its foreground probability according to this table.
Figure 3 shows a stack of images viewed using perspective and orthographic projections. The perspective projection is characterized by finite distance to the camera and a field-of-view (FOV) of 90 degrees, whereas the orthographic projection is obtained by taking the limit as the FOV goes to zero and the distance to the camera goes to infinity. Occlusion of sections using the perspective projection (A) is not present when using the orthographic projection (B). The dataset in both cases is a coronal Nissl-stained series of sections from an African green monkey (Chlorocebus aethiops) brain.
Figure 4 – Figure 6 show examples of StackVis in action using a series of coronal Nissl-stained sections from an African green monkey brain (Figure 4), a series of coronal Nissl-stained sections from a mouse brain (Figure 5), and a series of sagittal sections from a mouse brain reacted for biotinylated dextran amine (BDA) following an injection in frontal cortex (Figure 6). In Figure 6, labeled fibers can be followed within the image stack and individually labeled subcortical structures can be discerned, allowing for delineation of labeled fiber pathways and their termination within a 3D framework.
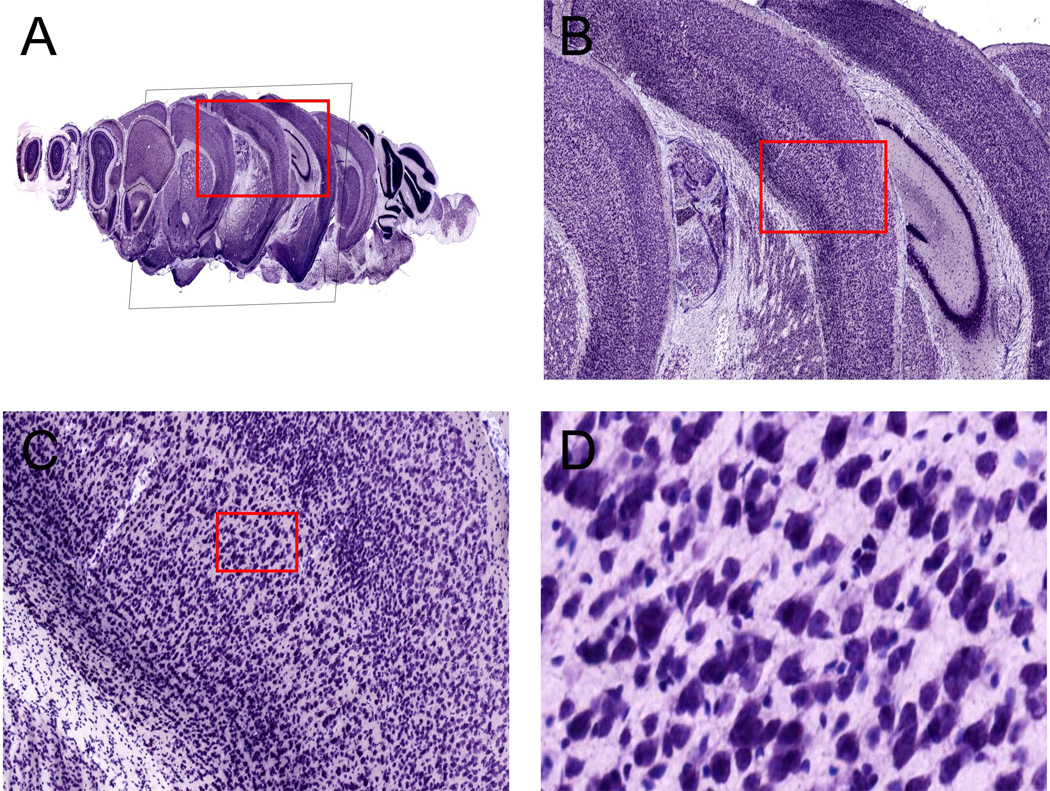
Figure 4.

StackVis example using a series of coronal Nissl-stained sections from an African green monkey brain (A). (B) is a zoomed in version of the red box in (A), (C) is a zoomed in version of the red box in (B), and (D) is a zoomed in version of the red box in (C). The resolution of the image data is 0.46 microns per pixel, or 55,000 dpi.
Figure 6.

StackVis example using a series of sagittal sections from a mouse brain reacted for biotinylated dextran amine (BDA) following an injection in frontal cortex (A). (B) is a zoomed in version of the red box in (A), (C) is a zoomed in version of the red box in (B), and (D) is a zoomed in version of the red box in (C). Labeled fibers can be followed within the image stack due to section transparency and individually labeled subcortical structures can be discerned, allowing for assessment of labeled fiber pathways and terminations within a 3D framework. The resolution of the image data is 0.46 microns per pixel, or 55,000 dpi.
Figure 5.
StackVis example using a series of coronal Nissl-stained sections from a mouse brain (A). (B) is a zoomed in version of the red box in (A), (C) is a zoomed in version of the red box in (B), and (D) is a zoomed in version of the red box in (C). The resolution of the image data is 0.46 microns per pixel, or 55,000 dpi.
Discussion
The method described for interactively visualizing multiresolution image stacks is particularly applicable to high-resolution images associated with virtual microscopy, where individual image sizes often exceed 20 gigabytes (or 70,000 megapixels) (Mikula et al., 2007). Other imaging technologies, such as electron microscopy, confocal microscopy, MRI, and PET, produce cross section images with much lower resolution than those used in virtual microscopy. However, as these imaging technologies produce increasingly larger image sizes we expect that our method will be valuable there as well.
StackVis bridges the gap between purely 2D high-resolution tiled image viewers such as Zoomify (Zoomify Inc., Santa Cruz, CA, USA) and volume rendering systems. When a user chooses to make only a single slide visible, called the current slide, the result is much like a 2D multiresolution image viewer. StackVis adds value here in that perspective shots are possible, in which case it resembles a terrain viewer, like Google Earth (http://earth.google.com). In this capacity it permits viewing of brain images or other anatomical images without variation in terrain height. When multiple slides are made visible, the result is similar to that achieved with volume rendering, except that interpolation is performed bilinearly within the images and not trilinearly between them.
It needs to be recognized that in datasets derived from microscope sections, the physical resolution at which the sections are scanned is commonly much greater than the distance between them (0.46 microns per pixel within versus a section thickness of 25–30 microns between) (Mikula et al., 2007). Hence trilinear interpolation between images is not useful. Moreover, because images of serial sections when made into a stack are not always aligned, trilinear interpolation can produce unsightly and uninformative results.
The current implementation of StackVis does not explicitly show the 3D shapes of individual brain structures as surfaces or volumes. While many of these structures can be inferred from serial 2D sections in the image stack, there are other relatively complicated or nonintuitive geometries, such as the C-shaped hippocampus or caudate nucleus, that pose more of a problem for visualization purposes. These considerations motivate our current efforts to integrate surface and volume reconstructions into StackVis.
Acknowledgments
This work was supported by Human Brain Project Grant Number MH60975 from the National Institutes of Health, United States Public Health Service. The University of California is seeking patent protection for technology described in this paper. For licensing information, contact copyright@ucdavis.edu.
Footnotes
Publisher's Disclaimer: This is a PDF file of an unedited manuscript that has been accepted for publication. As a service to our customers we are providing this early version of the manuscript. The manuscript will undergo copyediting, typesetting, and review of the resulting proof before it is published in its final citable form. Please note that during the production process errors may be discovered which could affect the content, and all legal disclaimers that apply to the journal pertain.
References
- Afework A. Digital Dynamic Telepathology: The Virtual Microscope. University of Maryland; 1998. [PMC free article] [PubMed] [Google Scholar]
- Felten C, Strauss J, Okada D, Marchevsky A. Virtual microscopy: High resolution digital photomicrography as a tool for light microscopy simulation. Human Pathology. 1999;30(4):477–483. doi: 10.1016/s0046-8177(99)90126-0. [DOI] [PubMed] [Google Scholar]
- Ferreira R, et al. The Virtual Microscope. University of Maryland; 1997. [Google Scholar]
- Finkel R, Bentley J. Quad trees a data structure for retrieval on composite keys. Acta Informatica. 1974;4(1):1–9. [Google Scholar]
- MacKay DJC. Information Theory, Inference, and Learning Algorithms. Cambridge University Press; 2003. [Google Scholar]
- Mikula S, Trotts I, Stone JM, Jones EG. Internet-Enabled High-Resolution Brain Mapping and Virtual Microscopy. NeuroImage. 2007 doi: 10.1016/j.neuroimage.2006.11.053. (In Press). [DOI] [PMC free article] [PubMed] [Google Scholar]
- Panusopone K, Sarika K, Cheevasuvit F. Progressive image transmission of variable block-size coding. Consumer Electronics, IEEE Transactions on. 1994;40(4):836–841. [Google Scholar]
- Romer D, Suster S. Use of virtual microscopy for didactic live-audience presentation in anatomic pathology. Annals of Diagnostic Pathology. 2003;7(1):67–72. doi: 10.1053/adpa.2003.50021. [DOI] [PubMed] [Google Scholar]
- Rui Y, Huang T, Chang S. Image retrieval: current techniques, promising directions and open issues. Journal of Visual Communication and Image Representation. 1999;10(4):39–62. [Google Scholar]
- Samet H. The Quadtree and Related Hierarchical Data Structures. ACM Computing Surveys (CSUR) 1984;16(2):187–260. [Google Scholar]
- Sullivan G, Baker R. Efficient quadtree coding of images and video. Image Processing, IEEE Transaction on. 1994;3(3):327–331. doi: 10.1109/83.287030. [DOI] [PubMed] [Google Scholar]