Abstract
We describe the use of four complementary biosensors (Biacore 3000, Octet QK, ProteOn XPR36, and KinExA 3000) in characterizing the kinetics of human nerve growth factor (NGF) binding to a humanized NGF-neutralizing monoclonal antibody (tanezumab, formerly known as RN624). Tanezumab is a clinical candidate as a therapy for chronic pain. Our measurements were consistent with the NGF/tanezumab binding affinity being tighter than 10 pM due to the formation of an extremely stable complex that had an estimated half-life exceeding 100 h, which was beyond the resolution of any of our methods. The system was particularly challenging to study because NGF is an obligate homodimer, and we describe various assay orientations and immobilization methods that were used to minimize avidity in our experiments while keeping NGF in as native a state as possible. We also explored the interactions of NGF with its natural receptors, TrkA and P75, and how tanezumab blocks them. The Biacore blocking assay that we designed was used to quantify the potency of tanezumab and is more precise and reproducible than the currently available cell-based functional assays.
Keywords: Biacore, Octet, ProteOn, KinExA, NGF, monoclonal antibody, tanezumab
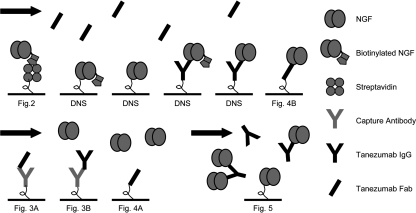
Human nerve growth factor (NGF) is involved in the transmission and sensation of inflammatory and neuropathic pain, and anti-NGF therapy has been shown to alleviate these symptoms (Sevcik et al. 2005). The currently accepted assay for measuring NGF's biological activity is its binding to and activation of TrkA, its natural receptor, as demonstrated in classical neuron survival assays (for review, see Cowan et al. 2001). We report on the in vitro biophysical characterization of a fully human monoclonal antibody (tanezumab) that neutralizes NGF and is in clinical trials as a treatment for chronic pain. Using three real-time label-free optical biosensors (General Electric's Biacore 3000, ForteBio's Octet QK, and BioRad's ProteOn XPR36), we dissected the picomolar affinity of the NGF/tanezumab interaction into its kinetic components and met the challenges imposed by an obligate homodimer and an antibody that does not tolerate regeneration. Each platform had its own advantages that we exploited in designing strategies that aimed to retain NGF's native activity while introducing minimal avidity into our assays (Fig. 1) and enabling the study of long dissociation phases in a time-efficient manner. NGF bound so stably to tanezumab that no dissociation was detected in 8 h, suggesting that the dissociation rate constant (k d) was slower than 2 × 10⁻⁶ s−1, according to the “5% rule” (Katsamba et al. 2006). The apparent association rate constant (k a) ranged from 2 × 10⁵ to 2 × 10⁶ M−1s−1, depending upon the assay orientation and how NGF was presented on the chip. These surface-based measurements were corroborated by a solution-based one using Sapidyne's Kinetic Exclusion Assay (KinExA) that indicated an affinity tighter than 10 pM that was driven by an extremely slow k d. Furthermore, we characterized the interactions of NGF with TrkA and the related receptor, P75, and the mechanism by which tanezumab blocks them. We thus developed a Biacore blocking assay that can be used to assess the potency of tanezumab and other antibodies that neutralize NGF activity, thereby providing a rapid and automated alternative to functional cell-based assays that are complicated and difficult to standardize.
Figure 1.
The various strategies used to immobilize ligands in kinetic experiments. The primary ligand was always amine-coupled to the surface. (Upper panel) Tanezumab Fab flowed over NGF on chip. (Bottom left panel) NGF flowed over tanezumab on chip. (Bottom right panel) Native tanezumab IgG and NGF were incubated together, and then free antibody-binding sites were detected via NGF-coated beads on the KinExA. (DNS) Data not shown.
Results
Kinetics of tanezumab Fab binding NGF surfaces
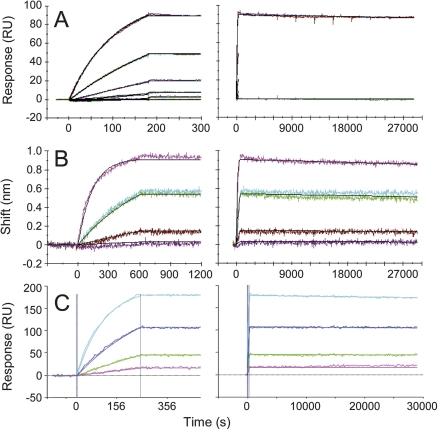
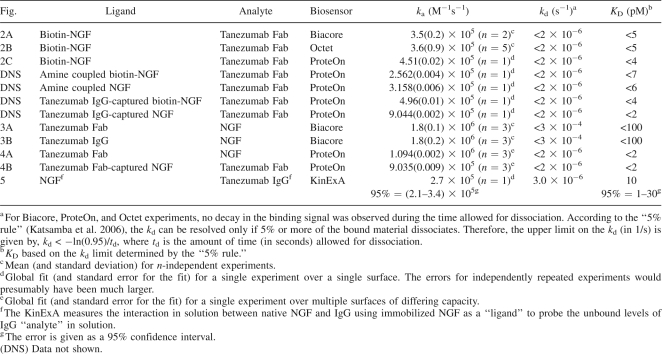
Optical biosensors, such as the Biacore 3000 system, are routinely used to determine the kinetics and affinities of antigen/antibody interactions in real time and without the use of labels. However, in order to extract meaningful kinetic rate constants from a direct binding experiment, the analyte should be a monomer, or at least behave like one, so that the data can be modeled using a simple bimolecular reaction mechanism (Myszka 1999). To avoid avidity effects associated with studying multivalent antigens, one assay orientation we studied consisted of flowing a Fab fragment of the antibody over the antigen on the chip, as depicted in Figure 1 (upper panel). Figure 2A shows duplicate injections of tanezumab Fab binding minimally biotinylated NGF captured onto a streptavidin-coated Biacore chip. Fitted kinetic and affinity constants are in Table 1. Despite collecting 8 h of dissociation data, it was not possible to resolve the k d because <5% of the bound material dissociated (Katsamba et al. 2006). When the temperature was increased from 25°C to 37°C, the k a increased twofold, but the k d was still immeasurably slow (data not shown).
Figure 2.
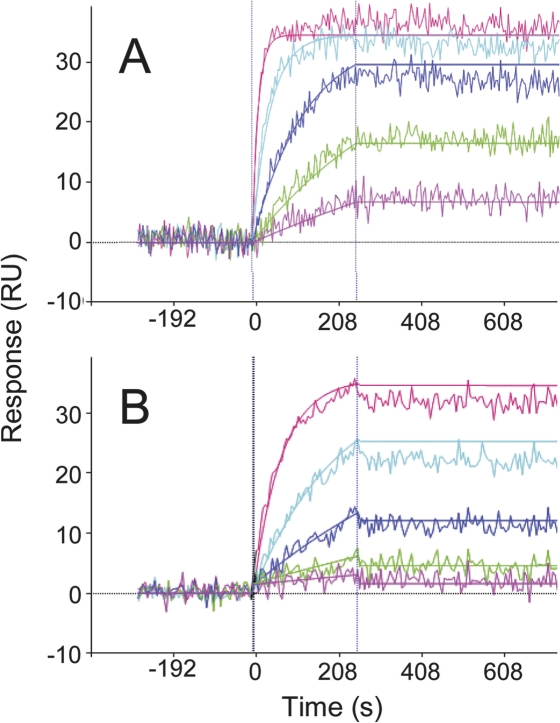
Global kinetic analysis of tanezumab Fab binding minimally biotinylated NGF on the sensor using Biacore 3000 (A), Octet (B), and ProteOn XPR36 (C) platforms. (Left panel) Enlarged view of the association phase data shown in the right panel. The mean association rate constants (k a) and standard deviation for n-independent experiments were determined to be 3.5 ± 0.2 × 10⁵ M−1s−1 (n = 2) (A) and 3.6 ± 0.9 × 10⁵ M−1s−1 (n = 5) (B). In panel C, the globally fit k a was 4.51 ± 0.02 × 10⁵ M−1s−1, where the standard error is for the fit. The Fab concentrations analyzed in panels A–C spanned 0.35–28, 0.17–21.6, and 0.49–13 nM, respectively. (Right panels) No decay in the binding signal was detected over 8 h irrespective of the biosensor used, so the k d was <2 × 10⁻⁶ s−1 and the K D was <8 pM. In panel B, the dissociation buffer contained 656 nM free NGF-binding sites to prevent any dissociated tanezumab Fab from rebinding to the NGF-coated tips. Colored and black lines in the overlay plots distinguish the measured data from the simulated fits in panels A and B, whereas noisy and smooth lines contrast the measured and simulated data in C.
Table 1.
Kinetic rate constants and affinities determined for the NGF/tanazumab interaction using four different biosensors and various assay orientations
We complemented the above analysis with a similar one on ForteBio's Octet biosensor. This platform analyzes up to eight interactions in parallel, which enabled us to collect kinetic data for an entire tanezumab Fab concentration gradient over NGF-saturated tips in a single binding cycle (Fig. 2B). Despite monitoring an 8-h dissociation phase in buffer containing NGF to prevent rebinding, no decay in the binding signal was discerned above instrument noise, confirming that the k d was too slow to measure. The Octet results were strikingly similar to those obtained on Biacore (Table 1).
We further analyzed the interaction in a two-dimensional format using Bio-Rad's ProteOn array biosensor, which can measure 36 interactions simultaneously through the use of its unique six-by-six crisscrossing flow paths (Bravman et al. 2006). In a single injection, termed “one-shot kinetics,” we took advantage of its ability to multiplex an assay in both the ligand and analyte directions. Extended dissociation phase data were collected for all members of a tanezumab Fab concentration gradient including an in-line blank while simultaneously exploring five different ways of presenting NGF on the chip (Fig. 1, upper panel). For example, NGF can be captured via pre-immobilized tanezumab IgG and still have one subunit free to bind tanezumab Fab in solution, since NGF is an obligate homodimer. Table 1 lists the k a values obtained over amine-coupled NGF (biotinylated or unmodified), streptavidin-captured biotinylated NGF (Fig. 2C), and tanezumab-captured NGF (biotinylated or unmodified). Regardless of the method used to immobilize NGF or the biosensor used, the Fab did not appear to dissociate detectably after 8 h, implying a k d < 2 × 10⁻⁶ s−1 and a K D in the single-digit picomolar range or tighter.
Kinetics of NGF binding low-capacity tanezumab surfaces
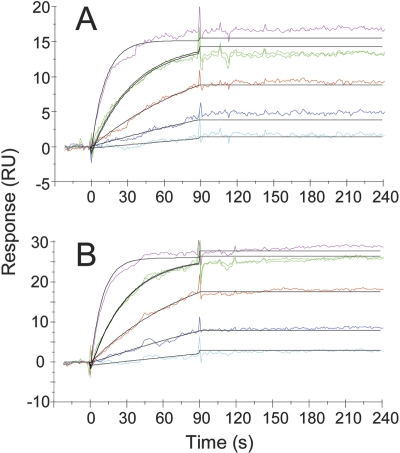
The NGF/tanezumab interaction was studied in the opposite orientation by flowing native NGF over tanezumab on the chip to provide data that was unbiased by the way in which NGF was presented on the sensor, as depicted in Figure 1 (bottom left panel). Tanezumab was captured at low levels to force NGF to bind in a tethered manner (using only one of its subunits) rather than in a cross-linked manner (using both of its subunits). To ensure that the data were not further contaminated by the bridging of NGF within the arms of a single IgG molecule, we also coated chips with low levels of Fab in an attempt to truly dilute down the antibody binding sites on the chip (Fig. 3). Using an Fc-specific rather than an (H+L)-specific anti-human polyclonal antibody to capture tanezumab IgG did not affect the binding kinetics (data not shown for the former), suggesting that the capture surfaces were not interfering with the epitope of tanezumab for NGF. The maximum binding responses (R max values) observed for NGF were consistent with the binding of a whole homodimer (26 kDa) to one tanezumab Fab (50 kDa) or one arm of an IgG (75 kDa). Once again, the k d was too slow to measure, so we could only place upper limits on the k d and K D values (Table 1).
Figure 3.
Global kinetic analysis of NGF binding low-capacity tanezumab surfaces by Biacore. (A) NGF (0, 0.6, 1.8, 5.5, 16.4, and 49.2 nM binding sites) was injected over tanezumab Fab captured via pre-immobilized anti-human (H+L)-specific polyclonal. (B) The same NGF series analyzed over full-length tanezumab IgG captured on a similar surface. The mean k a values from A and B were indistinguishable from one another (1.8 ± 0.2 × 10⁶ M−1s−1, where the error is the standard deviation for three independent experiments on each surface). No dissociation was detected over 5 min, so the k d was <2 × 10⁻⁴ s−1 and the K D was <100 pM. Colored lines contrast the measured data from the simulated fits (black).
To overcome a decaying surface, we amine-coupled tanezumab Fab as a gradient onto a ProteOn chip and performed a “one-shot” kinetic analysis of NGF (Fig. 4A). In a second injection, we saturated the tanezumab chip with NGF to create another reaction surface, namely tanezumab-tethered NGF, and in a third injection we addressed “one-shot” kinetics of tanezumab Fab across it (Fig. 4B). Thus, in the same experiment we were able to measure the stepwise saturation of NGF by tanezumab. The k a values observed for the formation of the NGF/tanezumab complex were similar in both assay orientations tested (Table 1). Again, no dissociation was detected over 8 h.
Figure 4.
One-shot kinetics on the ProteOn to address the stepwise saturation of NGF by tanezumab Fab. (A) 0.8–65.6 nM NGF-binding sites reacting with low-capacity tanezumab Fab amine-coupled to the chip. (B) 0.2–16.8 nM tanezumab Fab binding NGF that is tethered via pre-immobilized tanezumab Fab on chip. The k a values obtained for A and B in a single experiment were virtually identical to one another (1.094 ± 0.002 × 10⁶ and 9.035 ± 0.009 × 10⁵ M−1s−1, respectively), with the errors being for a global fit of three surfaces for each assay orientation tested (data from only the lowest capacity surface is shown). Noisy and smooth lines distinguish the measured data from the simulated fits. Based on there being no detectable decay in the binding signal over 8 h (data not shown), k d < 2 × 10⁻⁶ s−1 and K D < 2 pM for both interactions.
Solution affinity of the NGF/tanezumab interaction by KinExA
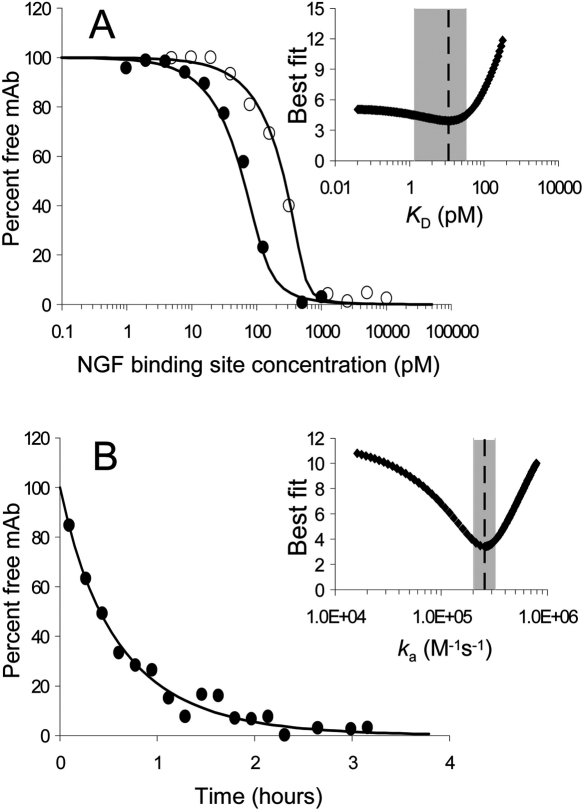
The KinExA technology was used to measure the K D and k a of the NGF/tanezumab interaction using native binding partners in solution and without immobilizing either of them (Fig. 5) as in Ohmura et al. (2001). Free tanezumab in an NGF/IgG mixture was captured via NGF-coated azlactone beads and detected by a fluorescently labeled anti-human secondary antibody (Fig. 1, bottom right panel). The lowest concentration of tanezumab that gave a strong enough signal to use, 80 pM (solid circles, Fig. 5A), was higher than the calculated K D, so there was a large uncertainty in the K D measurement (Table 1). The NGF used was only 76% active according to the dual curve analysis. This is consistent with the solution competition experiment on the Biacore that indicated the NGF was 88% active after a much shorter incubation time (Fig. 6, discussed below).
Figure 5.
KinExA analysis of the NGF/tanezumab interaction. (A) K D determination using a dual curve analysis of 0.488 pM–10 nM NGF titrated in twofold increments into intact tanezumab IgG at 400 pM (open circles) or 80 pM (solid circles) binding sites under equilibrium conditions; K D < 11.2 pM (dotted line in inset) with a broad 95% confidence interval (1.37–32 pM, gray box in inset), indicating that the calculated K D was not precise. (B) On rate determination of 600 pM tanezumab reacting with 2 nM NGF sampled every 10 min for 4 h under pre-equilibrium conditions; k a = 2.7 × 10⁵ M−1s−1 (dotted line in inset) with a sharp, well-defined 95% confidence interval (2.1–3.4 × 10⁵ M−1s−1, gray box in inset), using the empirically determined active NGF concentration of 785 pM. (Insets) Error graphs. The deduced k d was 3.0 × 10⁻⁶ s−1. All reagent concentrations are in binding sites.
Figure 6.
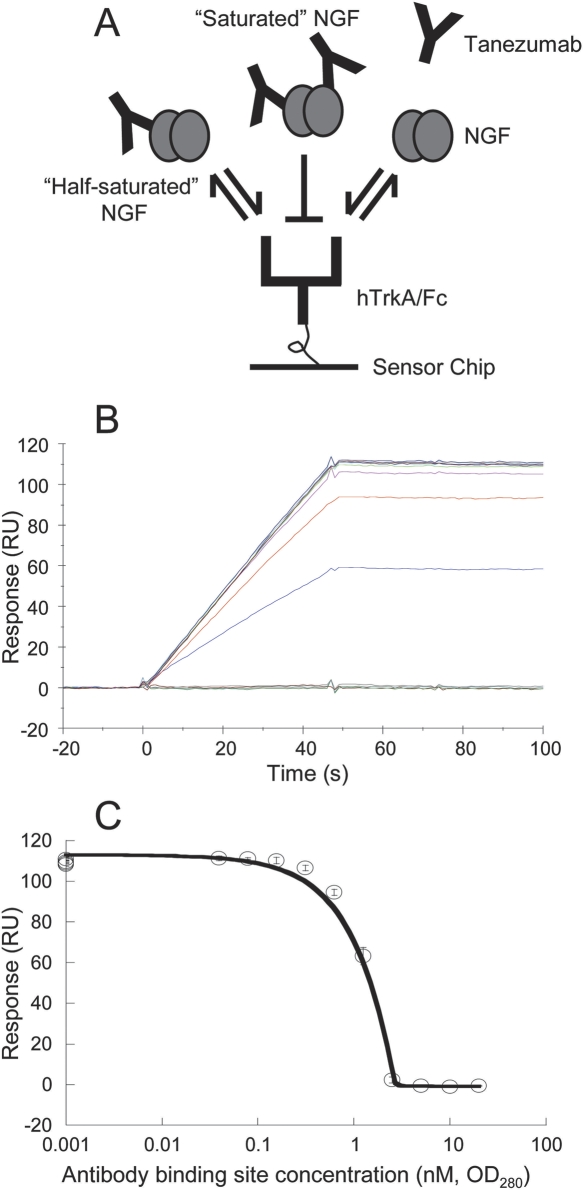
Solution competition to determine the active concentration of tanezumab by Biacore. (A) Cartoon depicting the assay strategy used. (B) Primary data for a typical analysis of 6 nM NGF (binding sites) premixed with 80 pM–40 nM (binding sites) tanezumab IgG (concentrations based on OD280) and injected over TrkA/Fc on chip. (C) Inhibition curve for three independent analyses. The symbols and error bars represent the mean binding responses and standard deviation recorded at the end of the association phase; the standard deviations were <5%. Concentrations are in binding sites. The NGF was determined to be 88% ± 5% active (standard error for the fit).
The k a was determined in a similar manner, but using a single mixture containing fixed concentrations of tanezumab and NGF, and taking measurements at regular time intervals over 4 h while they reached equilibrium (Fig. 5B; Table 1). Despite using a nonphysiological running buffer to be consistent with other reported interaction analyses of neurotrophic factors (Nykjaer et al. 2004), the KinExA measurements corroborated our surface-based biosensor measurements, which were performed in a standard HBS buffer.
Using solution competition to measure the active concentration of our reagents
All of the above measurements relied upon knowing accurately the active concentrations of tanezumab and/or NGF. Solution competition experiments were therefore performed on the Biacore to verify them as described by other investigators (Cannon et al. 2002; Darling and Brault 2004). We exploited the tight affinities of NGF for tanezumab and TrkA as the basis of a blocking assay that used tanezumab in solution to titrate out the binding of NGF to TrkA on the chip (Fig. 6A). We injected NGF at a fixed concentration of 1 nM, well above the K D of the NGF/tanezumab interaction, so that binding was antibody-controlled rather than K D-controlled (Fig. 6B), and then quantified the inhibition (Fig. 6C). In general, we found that our tanezumab IgG stocks were fully active, but our NGF stock was 88% ± 5% active from three independent measurements. This assay measures relative, not absolute, activity because it relies on using one of the binding partners as a standard. Thus, it is possible that all of our independently prepared antibody stocks are inactive to the same degree, but it does not seem likely.
Stoichiometry of NGF complexes with tanezumab or receptors
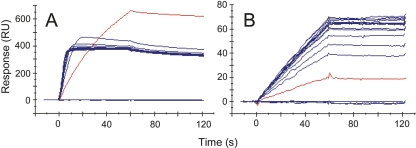
We have demonstrated that an NGF dimer bound to a single molecule of tanezumab can bind a second molecule of tanezumab (Fig. 4B). We investigated whether “half-saturated” NGF could also bind TrkA as represented in Figure 6A. This mode of binding could affect both the validity of the solution competition described above and blocking by tanezumab in vivo. To this end we repeated the solution competition experiment at high and low fixed concentrations of NGF. Our Biacore results showed that when NGF was premixed with low molar ratios of tanezumab, free NGF was able to bind TrkA on the chip. Saturating levels of tanezumab fully blocked the NGF/TrkA interaction. At equimolar concentrations of NGF and tanezumab, a significant fraction of the NGF was bound at one of its subunits by a tanezumab molecule. This NGF was able to use its second subunit to simultaneously bind TrkA on the chip, identifiable by the larger “sandwich” response seen for the NGF/tanezumab complex rather than free NGF, consistent with their different molecular masses (red curve in Fig. 7A). When these NGF/tanezumab mixtures were diluted 50-fold so that NGF no longer saturated the chip, no responses higher than those seen for free NGF were observed (Fig. 7B), consistent with our blocking data shown in Figure 6B. Although Figure 7 shows only data for the inhibition of NGF binding to TrkA by tanezumab, similar results were observed for the inhibition of NGF binding to P75 by tanezumab; P75 is another natural receptor of NGF.
Figure 7.
Solution competition to reveal the stoichiometry of tanezumab in its blocking of NGF binding TrkA on a Biacore chip. (A) Injections of 197 nM NGF (binding sites) premixed with 0.37–400 nM tanezumab IgG (binding sites). (B) A 50-fold dilution of the samples in A. The red lines indicate 1:1 binding stoichiometry. The assay strategy was the same as that shown in the cartoon in Figure 6A.
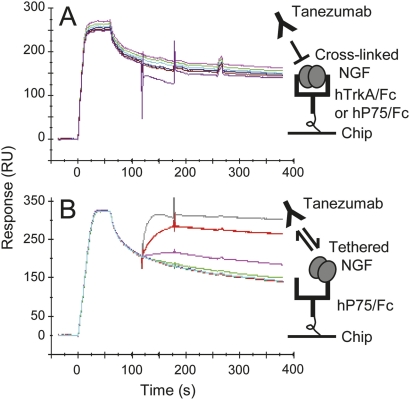
We attempted to measure the affinity of the NGF/receptor interactions by flowing NGF directly over low-capacity receptor surfaces. To a first approximation, a global analysis of the data indicated an apparent affinity in the low picomolar range, but the data were too complex to yield accurate kinetic rate constants for either receptor. This suggested that either the reagents were impure or that the data were affected by avidity as well as mass transport effects. Injecting tanezumab over NGF captured by TrkA and P75 (Fig. 8) confirmed that avidity was contaminating the analysis of NGF binding to immobilized receptors (see Discussion). The different behaviors of NGF toward the receptors are consistent with NGF having a tighter affinity for TrkA than P75 (Meakin and Shooter 1992).
Figure 8.
Tanezumab binding to NGF that is first captured via pre-immobilized TrkA (5950RU) (A) or P75 (1940RU) (B) on a Biacore chip. NGF dimer (24.6 nM in A or 12.3 nM in B) and tanezumab IgG (4.8–3000 nM dimer) were injected sequentially at times 0 and 120 s, respectively. Concentrations are given in molecules. The cartoons depict the assay strategy used and the presumptive binding of NGF in a “cross-linked” mode (A) or a “tethered” mode (B) to the receptor on chip.
Discussion
The quest for high-affinity monoclonal antibodies is a thriving area of research in developing highly specific drugs as therapeutic agents. Affinities of murine clones for their target antigen are often matured several orders of magnitude during the humanization process, which reformats the molecule to make it less immunogenic and more stable. Characterizing such high-affinity antigen/antibody interactions using in vitro biophysical tools can therefore be technically challenging as demonstrated by our analysis of the NGF/tanezumab interaction, which was further confounded by NGF being an obligate homodimer and tanezumab being impossible to regenerate.
We explored various assay orientations, immobilization methods, and surface-based biosensor platforms (Biacore 3000, Octet QK, and ProteOn XPR36) in an attempt to dissect the NGF/tanezumab interaction into its kinetic components (Fig. 1). None of these biosensors could resolve the k d because it was too slow to measure accurately within 8 h, which is one of the longest reported dissociation phases measured on any of these platforms to our knowledge (Drake et al. 2004; Navratilova et al. 2004). Therefore, we could place only an upper limit of about single-digit picomolar on the affinity. The k a values were within a measurable range, but varied according to how the NGF was presented on the chip (Table 1). Our results suggested that tethering NGF via tanezumab on the chip preserved its native conformation better than traditional immobilization methods. Alternatively, tethering NGF may have induced an allosteric conformational change in NGF that enhanced the binding affinity of its second subunit to tanezumab Fab. Further experiments are needed to distinguish between these possibilities.
The way in which the biosensors addressed samples impacted the way in which they handled long dissociation phase data. For example, while the analysis was tedious on a serial flow Biacore 3000 sensor, because the dissociation phase of only one analyte injection could be measured per binding cycle, the Octet and ProteOn platforms processed multiple samples in parallel in a single binding cycle. Furthermore, in-line blank subtraction increased the chance that the blank was a good reference for the analyte injections, since it was recorded at the same time and therefore was subject to any systematic fluctuations in the data that might have occurred during that time. The Octet allowed dissociation into buffer spiked with a competing antigen to create a “sink” that prevented any dissociated analyte from rebinding to the antigen-coated tips; even under these stringent conditions, no decay in the binding signal was detected. The Octet, however, had a worse signal-to-noise ratio than the SPR sensors, which meant that all analyses on this platform had to be conducted over ligand-saturated tips. The ProteOn allowed multiple analyte concentrations and multiple ligands to be addressed simultaneously. Thus, a single experiment revealed the effect of five different immobilization methods on NGF's binding activity. Despite these differences, the kinetic rate constants returned for the same assay orientation were very similar on the three technologies used (Fig. 2; Table 1).
Although the KinExA can determine very slow dissociation rates indirectly, via the product of the k a and K D measured in separate experiments (Darling and Brault 2004), it can do so only if the reactants are detectable at concentrations around or below their affinity for one another, which was estimated to be at least as tight as single-digit picomolar for the NGF/tanezumab interaction. Despite attempts to optimize the signal by exploring different coupling chemistries on different types of beads using different buffers, and varying the flow rate and flow volume, we could not detect antibody concentrations lower than ∼80 pM binding sites. Further optimization may have enabled us to resolve the affinity precisely.
We exploited the tight affinities of NGF for TrkA and tanezumab to develop a Biacore-based blocking assay, which validated the potency of our various stocks of tanezumab. This assay mimics a classical neuron survival assay that is considered a gold standard for assessing the functional activity of anti-NGF antibodies, since NGF's binding to and activation of its natural receptor, TrkA, is accepted as the cardinal event underlying NGF's biological activity. A drawback to this cell-based assay is that it not only demands a high level of technical expertise in culturing and imaging primary neurons, but it is laborious and prone to variation due to parameters that may be difficult to standardize, such as the age of the embryos under investigation and the culture conditions. In contrast, our Biacore assay is rapid, automated, and relatively easy to perform with minimal training.
Studying antigens that are obligate dimers complicates not only kinetic experiments but solution competition experiments as well. The direct binding of a dimer, such as NGF, could in principle distort an experiment like the one shown in Figure 6. While a monomeric analyte in a solution competition experiment can be either unbound or bound, a dimeric analyte can be unbound, “half-saturated,” or completely saturated (Fig. 6A). In an ideal assay, the “half-bound” species will give a signal half as large as the unbound form. This is the case on the KinExA since while the half-bound and unbound proteins yield the same magnitude of signal once captured, the former is captured half as often, and therefore its net signal per molecule is half as large (Ohmura et al. 2001). On the Biacore, free analyte is detected by its mass, rather than by a fluorescent label as on the KinExA. Since the “half-bound” analyte is more massive than the free analyte, it might be expected to give an artificially large binding response in an assay like the one shown in Figure 6. The free analyte being detected there has a molecular mass of only 26.4 kDa compared with NGF that is half-saturated with IgG at ∼175 kDa. However, the NGF/tanezumab mixture with the most “half-saturated” NGF gives a relatively low signal at a concentration that does not saturate the TrkA chip (Fig. 7B, red curve). The binding signal of the NGF/tanezumab complex may be particularly affected by mass transport, which was shown to affect this interaction (see below). Whatever the reason, the binding signal from “half-saturated” NGF seems to be around half that of free NGF. Experiments like the one shown in Figure 6 should thus, be only minimally affected by NGF being an obligate dimer.
We could not extract meaningful kinetics from the NGF binding data collected over TrkA and P75 on the chip because the interaction deviated from simple 1:1 binding in multiple ways (data not shown). A standard flow vary experiment (Myszka 1999) showed that the data were mass transport limited (data not shown) and contaminated by avidity even when sparse surface capacities were used. One sign that avidity was involved is that there was more heterogeneity in the dissociation phase than could be accounted for using a mass transport model. Another sign was the inability of tanezumab to bind NGF that was captured by TrkA on the chip (Fig. 8A). This implies that NGF is binding TrkA in a cross-linked manner, although we know from Figure 7A (red line) that the ternary tanezumab/NGF/TrkA complex can form when NGF is allowed to bind tanezumab prior to TrkA. Data with multiple modes of binding are very difficult to fit when the components cannot be fit separately (Myszka et al. 1996). To a somewhat lesser extent, the same is true for P75, although we did see some tanezumab binding NGF that was first captured via P75 on the chip (Fig. 8B), but the binding signal was lower than expected for a purely tethered NGF, and depended upon both the concentration at which the NGF was injected as well as the amount of NGF captured. This contrasts the binding mode of NGF to immobilized tanezumab IgG, since that NGF is capable of binding subsequently injected tanezumab (Fig. 4B). NGF's second subunit is bound neither to the same IgG as the first subunit nor to a neighboring IgG on the chip. The R max values indicate that one NGF dimer binds each captured tanezumab IgG or Fab binding site, supporting this conclusion (Fig. 3).
Our results emphasize the importance of carefully designing a biosensor assay in order to extract meaningful data, because the way in which the assay is oriented and the surface chemistry used can impact the apparent binding kinetics, especially when studying interactions of antibodies with multivalent antigens. Combining data from complementary technologies made for a robust analysis and allowed us to compare their performances head-to-head. Going beyond the traditional kinetic analysis of 1:1 interactions fostered a more complete characterization of the therapeutically important binding and blocking of NGF by the antibody tanezumab.
Materials and Methods
Materials
An Octet QK equipped with streptavidin SBC biosensor tips was purchased from ForteBio. A Biacore 3000 equipped with CM5 sensor chips, HEPES buffered saline with EDTA and surfactant P20 (HBS-EP) buffer (10 mM HEPES pH 7.4, 150 mM NaCl, 3 mM EDTA, and 0.005% v/v polysorbate P20), and coupling reagents (10 mM sodium acetate pH 5.0, N-[3-dimethylaminopropyl]-N′-ethylcarbodiimide [EDC], N-hydroxysuccinimide [NHS], and 1 M ethanolamine.HCl pH 8.5) were purchased from Biacore, now part of GE Healthcare. A ProteOn XPR36 equipped with GLC sensor chips and coupling reagents (sulpho-NHS and EDC) was purchased from BioRad. A KinExA 3000 instrument equipped with azlactone beads was from Sapidyne Instruments. Recombinant humanized anti-NGF tanezumab monoclonal antibody was prepared in-house (United States Patent Application No. 20040237124). Recombinant human β-NGF (Product No. 256-GF-100/CF) and recombinant human Fc-fused extracellular domains of receptors, TrkA and P75 (Product Nos. 175-TK-050 and 367-NR-050/CF, respectively), were either purchased from R&D systems or prepared in-house. Immunopure-grade streptavidin (Product No. 21122) and gentle IgG elution buffer (Product No. 1851520) were purchased from Pierce. NGF (0.26 mg) was minimally biotinylated with Pierce's EZ-Link sulpho-NHS-LC-LC-biotin (Product No. 21338) using a 1:10 molar ratio of linker:NGF (NGF in large excess) in a final volume of 100 μL. Reactions were incubated at 1 h at room temperature and/or overnight at 4°C and used without further purification. Fab fragment was generated from full-length tanezumab IgG using Pierce's Fab Preparation Kit (Product No. 0044885) according to the manufacturer's instructions, and the product was confirmed to be >90% pure by SDS-PAGE under reducing conditions. Horseradish peroxidase-conjugated rabbit anti-human IgG (H+L)-specific (Product No. 309-035-082) and Cy5-conjugated (fluorescent dye based on indodicarbocyanine) affinity-purified goat anti-human IgG Fcγ fragment-specific (Product No. 109-175-098), both with minimal cross-reactivity to mouse serum proteins, were purchased from Jackson ImmunoResearch Laboratories.
General interaction analysis
All experiments were conducted at 25°C in HBS-EP running buffer unless stated otherwise. Biacore and Octet data were analyzed in BiaEvaluation v. 4.1. ProteOn data were analyzed in ProteOn Manager v. 2.0. Biacore data were double-referenced, Octet data were blank-subtracted using an in-line buffer, and ProteOn data were referenced using interspots or a reference channel, and double-referenced using an in-line buffer blank. A simple model without mass transport was used for global kinetic analysis unless otherwise noted. When data were collected over multiple surfaces at the same time, data from all surfaces were fit simultaneously, excluding surfaces that perturbed the fit from that obtained locally over an optimal capacity surface.
One-shot tanezumab Fab kinetics by Octet
The Octet analysis was performed at 30°C in HBS-EP + 0.1 mg/mL BSA running buffer. Samples were agitated at 1000 rpm. Tips were saturated with 3 μg/mL biotinylated NGF for 15 min, which typically resulted in capture levels of 0.9 ± 0.1 nm within a row of eight tips. Tanezumab Fab was prepared as a fivefold serial dilution (typically 0.04, 0.17, 0.86, 4.32 in duplicate, and 21.6 nM) plus buffer blanks. Association was monitored for 10 min and dissociation was followed for 8 h into buffer alone or buffer spiked with 328 nM NGF (dimer).
One-shot kinetics by ProteOn
NGF was immobilized onto a GLC chip in a variety of ways as follows. Flow channels were activated in parallel with 1/20 diluted EDC/SNHS for 2 min at 30 μL/min. NGF, biotinylated NGF, streptavidin, and full-length tanezumab IgG were each diluted to 25 μg/mL in sodium acetate pH 5.0 and directly coupled onto separate channels for 4 min. Excess reactive esters were blocked with a 5-min injection of 1 M ethanolamine. Mean immobilization levels were 1570 RU (NGF), 1730 RU (biotinylated NGF), 280 RU streptavidin, and 1960 RU tanezumab IgG (two surfaces) with <2% variation along a strip. Three μg/mL biotinylated NGF was captured for 1 min (280 RU) on a streptavidin surface. Unmodified and biotinylated forms of NGF were diluted to 197 nM (dimer) in running buffer and each captured onto separate tanezumab-IgG surfaces for 1 min, giving final levels of 410 and 380 RU, respectively. One channel was left unmodified to provide an additional reference surface. The binding kinetics of tanezumab Fab to all six surfaces was determined in a single injection using a “one-shot” kinetic mode. Typically, the Fab was prepared as a threefold serial dilution (0, 0.49, 1.48, 4.44, 13.33, and 40 nM) and injected for 250 s at 100 μL/min. Dissociation was monitored for 8 h. Surfaces were regenerated with multiple 30-s pulses of 60 mM phosphoric acid so that the experiment could be reproduced.
Tanezumab Fab was amine-coupled as a gradient to a GLC chip at 30 μL/min by activating flow channels using a 1-min injection of EDC/SNHS that was prepared as a fivefold serial dilution spanning 1/10 to 1/6250 of the stock concentrations in the kit (200 mM EDC and 50 mM SNHS), coupling 26 μg/mL tanezumab Fab in acetate pH 5.0 for 4 min, and blocking excess reactive esters with a 5-min pulse of 1 M ethanolamine. This yielded immobilization levels spanning 97-1240 RU with <5% variation along a strip. One channel was left unmodified to provide a negative control surface. Binding kinetics of 0, 0.8, 2.4, 7.2, 22, and 65.6 nM NGF (binding sites) were measured using a single 250-s injection at 100 μL/min, allowing an 8-h dissociation time. Surfaces were then saturated with 656 nM NGF (binding sites, 250 s) to provide differing capacity reaction surfaces for a “one-shot” kinetic analysis of tanezumab Fab, which was injected as a threefold concentration series (0, 0.2, 0.6, 1.9, 5.6, and 16.8 nM) for 250 s, allowing an 8-h dissociation time.
NGF/tanezumab binding kinetics by Biacore
A standard amine-coupling method was used to prepare all Biacore surfaces, as follows. Flow cells were activated individually by injecting a freshly mixed solution of 0.2 M EDC in 0.05 M NHS for 7 min at 5 μL/min. 1–5 μg/mL NGF or 20–50 μg/mL tanezumab, rabbit anti-Human IgG (H+L)-specific polyclonal, or streptavidin were injected for 1–7 min until the desired level of immobilization was reached (typically <300 RU for NGF 3kRU for streptavidin, and 7–12 kRU for tanezumab and the capture antibody). Excess reactive esters were blocked using a 7-min injection of 1 M ethanolamine. Minimally biotinylated NGF was captured at 0.3 μg/mL for 5 min to final levels of 190 RU. An unmodified flow cell, naked streptavidin, or naked capture antibody provided a reference surface, as appropriate.
To measure the kinetics of tanezumab over NGF on the chip, a threefold serial dilution of tanezumab Fab (typically at 0, 0.35, 1.04, 3.11, 9.33, and 28 nM, with all concentrations in duplicate) was injected for 3 min at 50 μL/min, allowing a 30-s dissociation phase. The dissociation time was extended to 8 h for triplicate injections of 0 and 28 nM Fab. Surfaces were regenerated with two 100-s pulses of running buffer spiked with 60 mM phosphoric acid.
To measure the kinetics of NGF binding to tanezumab on the chip, the latter was captured at low levels in both Fab and IgG forms via pre-immobilized polyclonal anti-human antibodies. Thus, on separate flow cells, 260 μg/mL tanezumab Fab and 90 μg/mL tanezumab-IgG were injected for 3 min at 5 μL/min over a chip saturated (13–15 kRU) with amine-coupled rabbit anti-Human IgG (H+L), leaving one channel without any tanezumab to provide a reference surface. Capture levels of tanezumab were 39 ± 1 RU for Fab and 103 ± 1 RU for IgG for seven binding cycles each. A threefold concentration of NGF (0, 0.6, 1.8, 5.5, 16.4 in duplicate, and 49.2 nM binding sites) was injected for 90 s at 100 μL/min over freshly captured tanezumab. After a 5-min dissociation phase, the capture surfaces were regenerated with two 30-s pulses of 100 mM phosphoric acid.
Interaction analysis by KinExA
10 μg of NGF was immobilized onto 50 mg of azlactone beads by suspending them in 1 mL of PBS with rotation at 37°C. After 2 h, the supernatant was removed and the beads were incubated for another hour at the same temperature in 1.0 mL PBS + 10 mg/mL BSA to block nonspecific binding sites. The blocked beads were washed three times with PBS, resuspended in 30 mL of PBS, and used immediately.
Binding experiments were conducted in 10 mM HEPES pH 7.4, 150 mM (NH4)2SO4, 1.5 mM CaCl2, 1 mM EGTA, 0.005% v/v Tween 20, and 1 mg/mL BSA. The K D was determined as in Darling and Brault (2004). Briefly, full-length tanezumab (either 400 pM or 80 pM final binding sites) and NGF (respectively, 10 nM–4.88 pM or 1 nM–0.488 pM final binding sites) were incubated at room temperature for 24 h. Three to five milliliters of each mixture was applied to the beads at 0.25 mL/min, and free tanezumab binding sites were detected with Cy5-conjugated anti-human secondary antibody in PBS + 1 mg/mL BSA. The data were fit using the KinExA software.
Tanezumab (final 600 pM binding sites) and NGF (final 2 nM binding sites) were mixed in a total volume of 14 mL and sampled in 0.5-mL aliquots every 10 min for a total of 20 measurements over a fresh batch of NGF-coated beads. Data were analyzed in a similar manner as above, but this time the decay in binding signal measured over time was fitted to a simulated curve that described a best-fit k a value. The k d was deduced indirectly from the product of k a and K D.
Solution competition by Biacore
TrkA/Fc chimera (5–6 kRU) was amine-coupled to the chip to detect unbound NGF in mixtures of tanezumab and NGF. 6 nM NGF (binding sites) was injected for 48 s at 100 μL/min in the presence of tanezumab IgG or Fab, typically spanning 80 pM–40 nM (binding sites) in twofold increments. Surfaces were regenerated with a 30-s pulse of glycine pH 4.0. The binding responses recorded at the end of the association phase were plotted as a function of tanezumab concentration (based on total protein determined by OD280nm), and the inhibition curve was fit to a 1:1 binding model in KaleidaGraph v. 3.5 (Synergy Software) to converge upon a unique value for the active tanezumab concentration (in binding sites).
A similar competition experiment was performed at high and low concentrations of NGF. Thus, 197 nM NGF (binding sites) aliquots in the presence or absence of 0.37–400 nM (binding sites) tanezumab IgG were injected for 1 min at 20 μL/min over amine-coupled TrkA/Fc and P75/Fc on the chip. These solutions were also diluted 50-fold and retested in the same way. The immobilized receptors were regenerated with a 15-s pulse of a 2:1 v/v Pierce elution buffer/4M NaCl (Pierce/salt cocktail).
Tanezumab/NGF/receptor complexes by Biacore
NGF was captured at 24.6 nM dimer (1550 RU TrkA on chip) and 12.3 nM dimer (640 RU P75 on chip) for 1 min at 100 μL/min and followed by an injection of full-length tanezumab IgG (0, 4.8, 24, 120, 600, and 3000 nM dimer), also for 1 min at 100 μL/min. After a 3-min dissociation phase, the immobilized receptors were regenerated with a 15-s pulse of our Pierce/salt cocktail.
Acknowledgments
We thank Steve Lackie at Sapidyne Instruments Inc., for his technical assistance and helpful discussions. The support provided by Beth Young at Envision, funded by Pfizer Inc., consisted of internal manuscript submission, and no contribution was made to editorial content.
Footnotes
Reprint requests to: Yasmina Noubia Abdiche, Rinat Laboratories, Pfizer Inc., 230 East Grand Avenue, South San Francisco, CA 94080, USA; e-mail: Yasmina.abdiche@pfizer.com; fax: (650) 615-7351.
Article and publication are at http://www.proteinscience.org/cgi/doi/10.1110/ps.035402.108.
References
- Bravman, T., Bronner, V., Lavie, K., Notcovich, A., Papalia, G.A., Myszka, D.G. Exploring “one-shot” kinetics and small molecule analysis using the ProteOn XPR36 array biosensor. Anal. Biochem. 2006;358:281–288. doi: 10.1016/j.ab.2006.08.005. [DOI] [PubMed] [Google Scholar]
- Cannon, M.J, Myszka, D.G., Bagnato, J.D., Alpers, D.H., West, F.G., Grissom, C.B. Equilibrium and kinetic analyses of the interactions between vitamin B12 binding proteins and cobalamins by surface plasmon resonance. Anal. Biochem. 2002;305:1–9. doi: 10.1006/abio.2002.5647. [DOI] [PubMed] [Google Scholar]
- Cowan, W.M., Hamburger, V., Levi-Montalcini, R. The path to the discovery of nerve growth factor. Annu. Rev. Neurosci. 2001;24:551–600. doi: 10.1146/annurev.neuro.24.1.551. [DOI] [PubMed] [Google Scholar]
- Darling, R.J., Brault, P.A. Kinetic exclusion assay technology: Characterization of molecular interactions. Assay Drug Dev. Technol. 2004;2:647–657. doi: 10.1089/adt.2004.2.647. [DOI] [PubMed] [Google Scholar]
- Drake, A.W., Myszka, D.G., Klakamp, S.L. Characterizing high-affinity antigen/antibody complexes by kinetic- and equilibrium-based methods. Anal. Biochem. 2004;328:35–43. doi: 10.1016/j.ab.2003.12.025. [DOI] [PubMed] [Google Scholar]
- Katsamba, P.S., Navratilova, I., Calderon-Cacia, M., Fan, L., Thornton, K., Zhu, M., Bos, T.V., Forte, C., Friend, D., Laird-Offringa, I., et al. Kinetic analysis of a high-affinity antibody/antigen interaction performed by multiple Biacore users. Anal. Biochem. 2006;352:208–221. doi: 10.1016/j.ab.2006.01.034. [DOI] [PubMed] [Google Scholar]
- Meakin, S.O., Shooter, E.M. The nerve growth factor family of receptors. Trends Neurosci. 1992;9:323–331. doi: 10.1016/0166-2236(92)90047-c. [DOI] [PubMed] [Google Scholar]
- Myszka, D.G. Improving biosensor analysis. J. Mol. Recognit. 1999;12:279–284. doi: 10.1002/(SICI)1099-1352(199909/10)12:5<279::AID-JMR473>3.0.CO;2-3. [DOI] [PubMed] [Google Scholar]
- Myszka, D.G., Arulananthan, P.R., Sana, T., Wu, Z., Morton, T.A., Ciardelli, T.L. Kinetic analysis of ligand binding to interleukin-2 receptor complexes created on an optical biosensor surface. Protein Sci. 1996;5:2468–2478. doi: 10.1002/pro.5560051209. [DOI] [PMC free article] [PubMed] [Google Scholar]
- Navratilova, I., Eisenstein, E., Myszka, D.G. Measuring long association phases using Biacore. Anal. Biochem. 2004;344:295–297. doi: 10.1016/j.ab.2005.05.025. [DOI] [PubMed] [Google Scholar]
- Nykjaer, A., Lee, R., Teng, K.K., Jansen, P., Madsen, P., Nielsen, M.S., Jacobsen, C., Kliemannel, M., Schwarz, E., Willnow, T.E., et al. Sortilin is essential for proNGF-induced neuronal cell death. Nature. 2004;427:843–848. doi: 10.1038/nature02319. [DOI] [PubMed] [Google Scholar]
- Ohmura, N., Lackie, S.J., Saiki, H. An immunoassay for small analytes with theoretical detection limits. Anal. Chem. 2001;73:3392–3399. doi: 10.1021/ac001328d. [DOI] [PubMed] [Google Scholar]
- Sevcik, M.A., Ghilardi, J.R., Peters, C.M., Lindsay, T.H., Halvorson, K.G., Jonas, B.M., Kubota, K., Kuskowski, M.A., Boustany, L., Shelton, D.L., et al. Anti-NGF therapy profoundly reduces bone cancer pain and the accompanying increase in markers of peripheral and central sensitization. Pain. 2005;115:128–141. doi: 10.1016/j.pain.2005.02.022. [DOI] [PubMed] [Google Scholar]


