

Abstract
Analyses of arsenic (As) species in tissues and body fluids of individuals chronically exposed to inorganic arsenic (iAs) provide essential information about the exposure level and pattern of iAs metabolism. We have previously described an oxidation state-specific analysis of As species in biological matrices by hydride-generation atomic absorption spectrometry (HG-AAS), using cryotrapping (CT) for preconcentration and separation of arsines. To improve performance and detection limits of the method, HG and CT steps are automated and a conventional flame-in-tube atomizer replaced with a recently developed multiple microflame quartz tube atomizer (multiatomizer). In this system, arsines from AsIII-species are generated in a mixture of Tris-HCl (pH 6) and sodium borohydride. For generation of arsines from both AsIII- and AsV-species, samples are pretreated with L-cysteine. Under these conditions, dimethylthioarsinic acid, a newly described metabolite of iAs, does not interfere significantly with detection and quantification of methylated trivalent arsenicals. Analytical performance of the automated HG-CT-AAS was characterized by analyses of cultured cells and mouse tissues that contained mono- and dimethylated metabolites of iAs. The capacity to detect methylated AsIII- and AsV-species was verified, using an in vitro methylation system containing recombinant rat arsenic (+3 oxidation state) methyltransferase and cultured rat hepatocytes treated with iAs. Compared with the previous HG-CT-AAS design, detection limits for iAs and its metabolites have improved significantly with the current system, ranging from 8 to 20 pg. Recoveries of As were between 78 and 117%. The precision of the method was better than 5% for all biological matrices examined. Thus, the automated HG-CT-AAS system provides an effective and sensitive tool for analysis of all major human metabolites of iAs in complex biological matrices.
Introduction
Arsenic (As) occurs naturally in minerals and geological formations that compose Earth’s crust. Inorganic arsenic (iAs) is the most abundant form of As in soil, underground aquifers and surface water reservoirs.1 Chronic exposures to iAs in drinking water affect millions of people worldwide. In some areas with high chronic exposure to iAs, prevalences of diseases (e.g. skin lesions, diabetes, hypertension, or cancer) have reached epidemic proportions.2–4 Ingested iAs that is readily absorbed from drinking water undergoes complex metabolic transformation in human tissues. Metabolism of iAs involves sequential reactions in which AsV-species are reduced to trivalency and AsIII-species undergo oxidative methylation, yielding methylated arsenical containing pentavalent arsenic. Four methylated arsenicals have been identified as major products of iAs metabolism in humans: methylarsonous acid (MAsIII), methylarsonic acid (MAsV), dimethylarsinous acid (DMAsIII) and dimethylarsinic acid (DMAsV). These methylated arsenicals and the iAs species, arsenate (iAsV) and arsenite (iAsIII), are consistently detected in urine of individuals exposed to iAs in drinking water 5–10 and in cultures of human hepatocytes treated in vitro with iAs.11 Another methylated arsenical, which contains pentavalent arsenic, dimethythioarsinic acid (DMTA), has been identified as a metabolite in urine of Bangladeshi women chronically exposed to iAs from drinking water.12
Evidence from laboratory studies suggest that a single enzyme, As (+3 oxidation state) methyltransferase (AS3MT), catalyzes formation of both tri- and pentavalent MAs and DMAs in the course of iAs metabolism13,14. Trivalent arsenicals are generally more toxic than pentavalent arsenicals. In addition, MAsIII and DMAsIII are more toxic than either iAsV or iAsIII in some biological systems15. Thus, the rate and the pattern of iAs metabolism that determine the amounts and composition of iAs metabolites produced and retained in human tissues are believed to play key roles in modulation of chronic and acute toxicities of iAs. Comprehensive analysis of AsIII- and AsV-species in body fluids or tissues is an essential tool for evaluation of the pattern of iAs metabolism in exposed individuals, and thus, for assessment of risk of adverse health effects associated with iAs exposure. Analytical techniques for determination of tri- and pentavalent metabolites of iAs are also required for laboratory studies that examine metabolic conversion and modes of action for iAs and its metabolites in animal and in vitro models.
Several techniques have successfully been used for oxidation-state specific speciation analysis of As in biological matrices, including high-performance liquid chromatography (HPLC)-HG-atomic fluorescence spectrometry (AFS),5–7 HPLC-inductively coupled argon plasma mass spectrometry (ICP-MS),9,16 and pH-selective HG-atomic absorption spectrometry (AAS) with cryotrapping (CT) and separation of arsines based on their boiling points.8,10,11 The HPLC-based methods allow direct analysis of free AsIII- and AsV-species in human or animal urine. However, application of these methods for speciation analysis of As in more complex biological matrices requires acid digestion of samples which oxidizes all methylated AsIII-species17,18 or laborious multi-step extraction of protein-bound arsenicals with As chelators.19 By comparison, the pH-selective HG-CT-AAS is capable of direct oxidation-state specific speciation analysis of As even in a relatively complex biological matrices (e.g., cell lysates) without sample pretreatment.11 Thus, although less specific than HPLC-ICP-MS, HG-CT-AAS has been used in laboratory studies of the formation of AsIII- and AsV-metabolites during metabolism of arsenicals in cultured human and animal cells.15,20 However, utility of the original HG-CT-AAS method8 was limited by its low sensitivity. The detection limit (DL) for As species ranged from 1.1. to 6.5 ng ml−1. Largely manual operation also limited throughput for this method. Although optimization of CT and of temperature gradient conditions improved significantly DL of this method11, the procedure remained labor intensive.
We have recently described an automated system for the oxidation state specific speciation analysis of inorganic and methylated arsenicals by selective HG-CT-AAS with a multiatomizer for arsine detection.21 This is a continuous flow system in which arsines from AsIII-containing arsenicals are selectively generated in a mixture of Tris-HCl (pH 6) and sodium borohydride. To allow arsine generation from both AsIII- and AsV-containing arsenicals, pentavalent arsenicals are first reduced to trivalency by treatment with a reductant, L-cysteine (Cys). Thus, two measurements are needed for each sample to determine the contents of AsIII-containing species and AsIII+V species after treatment with Cys. The contents of AsV-containing species are then calculated as a diffierence between the two measurements. This modified method has lowered DL values for all relevant As species; automation of the CT step has improved sample throughput. The present study tested analytical performance of the automated HG-CT-AAS, using matrices generated in biological experiments, including mouse tissues and rat and human cells. Results of these tests show that the optimized HG-CT-AAS is capable of analyzing As species, including methylated trivalent arsenicals (MAsIII and DMAsIII) with DL values of 8 to 20 pg As that approach DL values described for ICP-MS systems. Thus, although this method lacks the specificity that can be attained by HPLC-based analytical approaches, the automated HG-CT-AAS system with a multiatomizer can be used as an efficient tool for a direct oxidation-state specific speciation analysis of As in biological samples which would otherwise require laborious extraction to preserve unstable methylated AsIII species.
Experimental
Instrumentation
Speciation analyses of As in biological matrices spiked with standards and in samples generated in in vitro, cell culture, and animal experiments were performed using a PerkinElmer Model 5100 PC atomic absorption spectrometer equipped with FIAS 200 (PerkinElmer, Norwalk, CT, USA) and coupled with the automated CT unit.21 An arsenic electrode-less discharge lamp (System II, Perkin-Elmer) at 390 mA was used as the radiation source. The slit width was 0.7 nm. Deuterium background correction was applied. The total As was analyzed by graphite furnace (GF)-AAS, using Perkin-Elmer model 5100 atomic absorption spectrometer equipped with an autosampler.
Reagents
Arsenicals used as standards for HG-CT-AAS analysis included sodium arsenite (99% pure; Sigma-Aldrich, St. Louis, MO), sodium arsenate (96%, Sigma), methylarsonic acid, disodium salt (98%, Chem Service, West Chester, PA), and dimethylarsinic acid (98%, Strem Chemicals, Inc., Newburyport, MA). MAsIII [(CH3AsIIIO)4], DMAsIII, iodide salt [(CH3)2AsIIII], and trimethylarsine oxide [(CH3)3AsVO; TMAsVO] were synthesized by Professor William Cullen (University of British Columbia, Vancouver, Canada).22 DMTA was prepared by Dr John T. Creed (US EPA National Exposure Research Laboratory, Cincinnati, OH), as previously described.23 The content of total As in all standards was determined by GF-AAS. Sodium borohydride (NaBH4) was from EM Science (Gibbstown, NJ). Ultrapure phosphoric acid was obtained from J. T. Baker (Phillipsburg, NJ). Ultra-pure Cys hydrochloride monohydrate was purchased from Sigma and Tris-hydrochloride purchased from EMD Chemicals Inc. (Gibbstown, NJ). All other chemicals used were the highest grade commercially available.
Cultured cells and treatments
Cultured cell lines used to prepare biological matrices for method validation or to generate samples for As speciation analysis included human hepatocellular carcinoma (HepG2) cells (HB-8065; American Type Culture Collection, Manassas, VA), SV-40 transformed normal human urothelial (UROtsa) cells (gift from Dr Unimye, West Virginia University), and a clonal UROtsa/F35 cell line that expresses rat AS3MT.20 These cell lines were cultured in 6-well plates (Costar Corning Incorporated, Corning, NY) in 2 ml of MEM medium per well (GIBCO, BRL, Grand Island, NY) containing 10% fetal bovine serum (FBS, GIBCO), 50 U penicillin ml−1 and 5 0 μg streptomycin ml−1). Primary cultures of hepatocyte from a 10 week old female Sprague-Dawley rat (CellzDirect, Pittsboro, NC) were established in 6-well culture plates in a supplemented Williams’ medium E (2 ml well−1). All cells were maintained in a humidified atmosphere with 5% CO2 at 37 °C. In metabolic experiments, 70%-confluent cultures of HepG2, UROtsa and UROtsa/F35 cells were incubated with 1 μM iAsIII for 24 h. Rat hepatocytes were incubated with 0.1 or 1 μM of iAsIII for 2 or 6 h. After incubation, media were collected and cells were lysed on ice for 5 min with cold 0.5% solution of Triton-X100 in deionized water. Media and cell lysates from control (untreated) cultures were spiked with As standards and used for method validation. Media and cell lysates from cultures incubated with iAsIII served as samples for speciation analysis by HG-CT-AAS.
Mice and treatments
Four week-old male weanling C57BL/6 mice were obtained from Jackson Laboratory (Bar Harbor, ME, USA) and housed in polycarbonate cages with corn cob bedding in the University of North Carolina Animal Facilities with a 12 h light/dark cycle at 22 ± 1 °C and 50 ± 10% relative humidity. These facilities are accredited by the American Association for Accreditation of Laboratory Animal Care. Mice were housed five per cage with free access to food (Lab Diet 5058, Nutrition International, Brentwood, MO) and drinking water without or with addition of iAsIII (50 ppm As). After 8 weeks mice were euthanized, and dissected. Collected tissues were snap frozen in liquid nitrogen and stored at −70 °C before analysis.
In vitro methylation system
In vitro methylation of iAsIII by recombinant rat AS3MT was performed as previously described.11,24 Briefly, the reaction mixture (100 μl) contained 100 mM sodium phosphate (pH 7.4), 100 mM Tris buffer (pH 7.4), 2 μM E. coli thioredoxin (Sigma), 1 mM S-adenosylmethionine (AdoMet) (Sigma), 0.25 μM rat thioredoxin reductase (American Diagnostica, Greenwich, CT), 300 μM NADPH (Sigma), 3 μM of iAsIII, and 2 μg of recombinant rat AS3MT. The mixture was incubated in capped tubes at 37 °C for 1 h or overnight.
Speciation analysis of As by HG-CT-AAS
Sample preparation and treatment
In vitro reaction mixtures, cell lysates and media from cell cultures were analyzed without digestion or extraction. Mouse tissues were homogenized in deionized water (1 : 20 w/v) and tissue homogenates were digested overnight in 2 M ultrapure phosphoric acid (90 °C) as previously described.25 Phosphoric acid in digested samples was neutralized by NaOH. For analysis of total iAs (iAsIII + iAsV), MAs (MAsIII + MAsV) and DMAs (DMAsIII + DMAsV), samples were incubated with Cys hydrochloride (2% Cys and 0.11 M HCl final concentrations; pH 1.5) for 70 min at room temperature. Preliminary tests showed that time needed for the reduction of AsV to AsIII by Cys differs for various AsV species. At least 60 min incubation was necessary for reduction and complete As recovery of all AsV-species examined in this study. Trivalent arsenicals were analyzed directly without pretreatment of samples with Cys.
HG and CT steps
An aliquot of a Cys-treated or untreated sample (500 μl each) was injected into a flow of deionized water continuously mixed with a flow of 0.75 M Tris-HCl buffer (pH 6) and a flow of 1% NaBH4 in 0.1% NaOH/0.02% antifoam B silicone emulsion. The flow rate for each component (1 ml min−1) was controlled by a multi-channel FIAS peristaltic pump. Arsines generated by reaction with NaBH4 and separated from the liquid phase in a 50 ml gas–liquid separator were swept in a helium (76 ml min−1) and hydrogen (15 ml min−1) stream into an automated CT unit. Design and operation of the CT unit were described in detail in ref. 21. Briefly, the CT unit contained a 305 mm long glass U-tube (2.5 mm id) packed with 0.8 g of Chromosorb WAW-dimethyldichlorosilane 45/60 with 15% OV-3 (Supelco, Inc., Bellefonte, PA) and wrapped with a 1.6 Ω ft−1 Ni80/Cr20 wire (Omega Engineering, Stamford, CT) providing a total resistance of 15% Ω. The U tube was inserted in a sealed 300 mm long double-walled glass cylinder (40 mm id) with an inlet for liquid N2 at the bottom and an outlet for N2 gas at the top. A FIAS-controlled solenoid valve (7/32″ inner orifice, Omega Engineering, Stamford, CT) was connected to the outlet. The cylinder with U-tube was placed in a 4.3 l Dewar flask filled with liquid N2. During the HG step, the solenoid valve was open and the glass cylinder containing the U-tube was filled with liquid N2. Following the HG reaction, the solenoid valve closed and the U tube was gradually heated to approximately 150 °C by application of an electrical current to the Ni80/Cr20 wire. Expanding N2 gas produced by heating displaced liquid N2 through the inlet at the bottom of the cylinder into the Dewar flask. The heating also permitted boiling point separation of arsines trapped in the U tube.
Detection and quantitation of As
Arsines released by heating were carried form the CT unit in a flow of helium/hydrogen into a quartz multiatomizer placed in the optical axis of the Perkin-Elmer 5100 PC atomic absorption spectrometer. The multiatomizer was electrically heated to 900 °C with 35 ml min−1 of air as outer gas.26 Atomic absorption peaks corresponding to arsine, methylarsine, dimethylarsine and tri-methylarsine were recorded during a 90 s reading window. Identities of arsines generated from biological samples were confirmed by spiking samples with As standards at several concentrations. Areas of individual peaks were used for calculation of the contents of As species. The contents of AsIII-species were determined directly from peaks detected after HG in the absence of Cys; the peaks detected after HG from Cys-treated samples were used to determine the contents of AsIII+V-species. The contents of pentavalent As species were calculated as a diffierence between the contents of AsIII+V- and AsIII-species.
Calibration
Five-point calibration curves (0.1, 0.5, 1, 2 and 5 ng As ml−1) were generated for each of the As standards. Calibration curves for analysis of AsIII+V-species in Cys-treated biological samples were generated using pentavalent As standards spiked into the corresponding matrices and pretreated for 70 min with 2% Cys. Trivalent As standards spiked into the same matrices were used to generate calibration curves for analysis of AsIII-containing species in the absence of Cys. The concentration of total speciated As for each biological sample was calculated as a sum of concentrations of iAsIII, iAsV, MAsIII, MAsV, DMAsIII, DMAsIII, and TMAsVO.
Analysis of total As
To calculate recovery of As from HG-CT-GC-AAS analysis of mouse tissues, total As contents in tissues were determined by GF-AAS. For this analysis, tissues were digested, using a Model MARS 5 microwave and following the 3052 EPA method with some modifications. Briefly, 0.1 g of tissue was completely wet digested in 70% nitric acid in a total volume of 10 ml. One milliliter of the digestate was diluted with 20% nitric acid to a final volume of 5 ml. An aliquot of 40 μl of this solution was injected into the GF along with 10 μl of a chemical modifier (5 μg of palladium and 5 μg of magnesium nitrate in 2% nitric acid). The GF program included a drying step at 130 °C for 40 s, ashing step at 1300 °C for 40 s, and atomization step at 2300 °C for 3 s. A four-point calibration curve (0.5, 1, 2 and 5 ng As ml−1) was generated for iAsV standard in 10% HNO3. Percentage recovery of As for each tissue was calculated from the ratio of the total speciated As concentration (determined by HG-CT-GC-AAS) and the total As concentration (determined by GF-AAS).
Results
Speciation analysis of As in biological matrices spiked with As standards
The first step examined the capacity of the newly configured HG-CT-AAS system to speciate As in cell lysates and culture media spiked with mixtures of As standards. The evaluation focused on As species identified in earlier epidemiological and laboratory based studies as significant metabolites of iAs in humans (iAsIII, iAsV, MAsIII, MAsV, DMAsIII, and DMAsV). These experiments used cell lysates and FBS-containing medium from control (untreated) HepG2 cultures. Fig. 1 shows chromatograms from HG-CT-AAS analyses of mixtures of AsV- and AsIII-standards in cell lysates. As described above, cell lysates spiked with AsV-standards were treated with Cys before HG. Complete baseline separation of arsine, methyl-arsine, and dimethylarsine was achieved. Similar signals were obtained for standards spiked into the culture medium (data not shown). Average retention times in seconds (mean ± SD, n = 6) for arsines generated from a mixture of trivalent arsenic standards in lysates and culture medium were 7.3 ± 0.09 for arsine, 30.5 ± 0.63 for methylarsine, and 39.9 ± 0.58 for dimethylarsine. Average retention times for arsines generated from a mixture of pentavalent arsenic standards in lysates and culture medium treated with Cys were 7.8 ± 0.11 for arsine, 30.0 ± 0.38 for methylarsine, and 39.3 ± 0.40 for dimethylarsine. Calibration curves for AsV- and AsIII-standards were linear over the range of 0.1 to 5 ng As ml−1 (Table 1) with statistically significant correlations between the signal and As concentration (R2 > 0.99, p < 0.001). Slopes of calibration curves were similar (0.84 to 1.08) despite diffierences in the oxidation state of As or the biological matrix (Table 1). This suggests that efficiencies for HG and atomization of hydrides were similar for all arsenicals tested. The DL for each As species and each matrix was determined as 3σn−1 for the area of blank (n = 10) at the corresponding retention times. HG from blanks was performed in the absence or presence of Cys to determine DL values for tri- and pentavalent arsenicals, respectively. The DL values ranged from 9 to 20 pg for trivalent species and from 8 to 20 pg for pentavalent species (Table 1). Precision of the method expressed as relative SD for arsenical standards spiked in cell lysate and culture medium at final concentrations of 0.25, 0.5, and 1 ng As was always better than 4%. Precision for a final concentration of 0.05 ng As ranged from 5.8 to 13.4%.
Fig. 1.
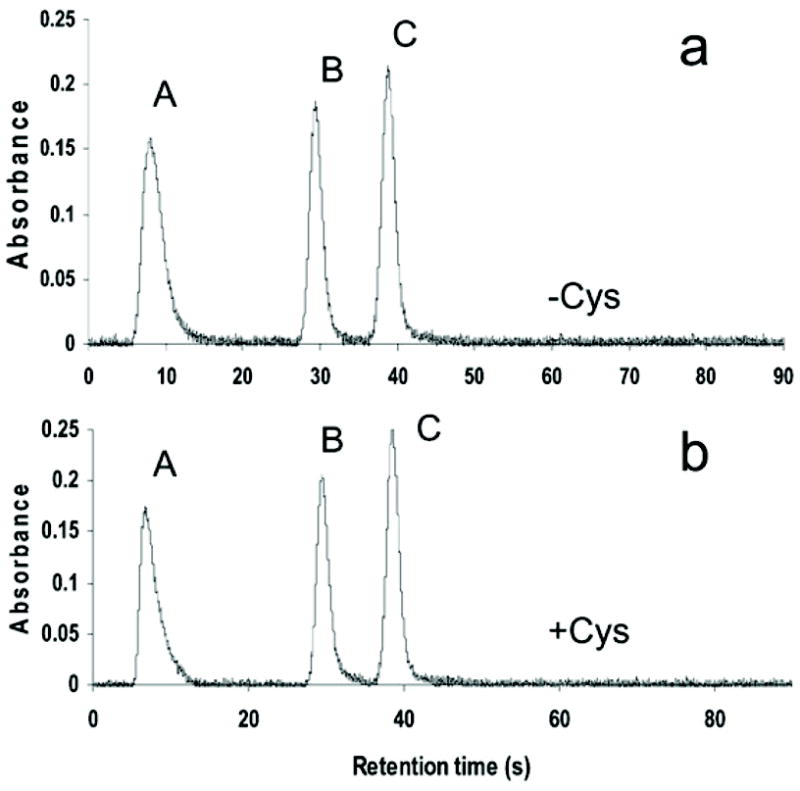
Separation and detection of arsine (A), methylarsine (B) and dimethylarsine (C) generated from HepG2 cell lysates spiked with mixtures of standards: (a) iAsIII, MAsIII and DMAsIII (0.5 ng As each) or (b) iAsV, MAsV and DMAsV (0.5 ng As each). HG was carried out in cell lysates directly (a) or after pretreatment with Cys (b).
Table 1.
The characteristics of the calibration curves and DL values for As standards spiked into HepG2 cell lysate or culture medium
| Cysa | Biological matrices | As-standard | Linear regressionb | Correlation coefficient | DL/pg Asc |
|---|---|---|---|---|---|
| − | Medium | iAsIII | y = 1.01(x) + 0.02 | 0.999 | 14 |
| MAsIII | y = 0.92(x) + 0.002 | 0.999 | 20 | ||
| DMAsIII | y = 1(x) + 0.06 | 0.999 | 19 | ||
| − | Cell lysate | iAsIII | y = 1.01(x) + 0.014 | 0.999 | 10 |
| MAsIII | y = 0.89(x) + 0.0007 | 0.999 | 18 | ||
| DMAsIII | y = 0.84(x) + 0.035 | 0.998 | 9 | ||
| + | Medium | iAsV | y = 1.02(x) + 0.046 | 0.999 | 14 |
| MAsV | y = 0.99(x) + 0.012 | 0.999 | 8 | ||
| DMAsV | y = 1.08(x) + 0.022 | 0.999 | 20 | ||
| + | Cell lysate | iAsV | y = 1.04(x) + 0.041 | 0.999 | 12 |
| MAsV | y = 0.94(x) + 0.02 | 0.999 | 17 | ||
| DMAsV | y = 1.03(x) + 0.046 | 0.999 | 13 |
Arsines from AsIII-containing matrices were generated directly without pretreatment with Cys; AsV-containing matrices were treated with 2% Cys for 70 min before HG.
The linearity of the calibration curve was determined for each As species over the range of 0.1 to 5 ng of As ml−1.
DL was calculated as 3σn−1 for the area of blanks (n = 10) at the retention times corresponding to each of the As species.
Efficiencies of HG for DMTA
To determine whether DMTA, a sulfur-containing metabolite of iAs, interferes with analysis of DMAsIII or DMAsV by HG-CT-AAS, we compared efficiencies of HG and retention times for the three dimethyl-As species. Cell lysates and medium from HepG2 cultures were spiked with DMTA, DMAsIII or DMAsV (0.25 or 2.5 ng each) and HG was carried out in the presence or absence of Cys. Fig. 2 shows chromatograms for samples spiked with 2.5 ng of each dimethyl-As standard. Similar retention times were recorded for dimethylarsine generated from each of the three standards. Relative efficiencies of HG for DMAsV and DMTA were calculated as:
Fig. 2.
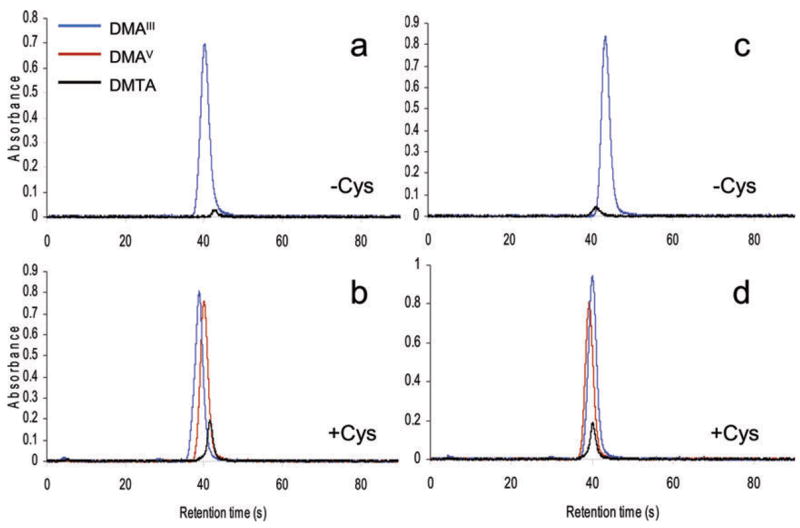
HG efficiencies for dimethyl-As species: Detection of dimethylarsine generated from HepG2 cell lysates (a,b) or culture media (c,d) spiked with DMAsIII, DMAsV or DMTA (2.5 ng As each). HG was carried out in cell lysates directly (a,c) or after pretreatment with Cys (b,d).
Relative efficiencies of HG in the absence of Cys ranged from 2.3 to 3.5% for DMAsV and from 4 to 11.7% for DMTA (Table 2). Notably, HG generation was more efficient for samples spiked with 0.25 as compared to 2.5 ng DMTA. In the presence of Cys, the efficiency of HG for DMAsV increased to 88 to 108%, but remained relatively low for DMTA (15.4 to 37%).
Table 2.
Relative efficiencies of HG for DMAIII, DMAV and DMTA spiked into HepG2 cell lysate or culture medium
| HG efficiency (%)b |
||||
|---|---|---|---|---|
| Cysa | Biological matrices | Spike/ng As | DMAV | DMTA |
| − | Cell lysate | 0.25 | 3.5 ± 0.1 | 10.0 ± 0.9 |
| − | Media | 0.25 | 2.3 ± 0.2 | 11.7 ± 0.6 |
| − | Cell lysate | 2.5 | 3.5 ± 0.1 | 5.7 ± 0.04 |
| − | Media | 2.5 | 3.0 ± 0.2 | 4.0 ± 0.1 |
| + | Cell lysate | 0.25 | 104.6 ± 2.9 | 36.7 ± 3.6 |
| + | Media | 0.25 | 88.4 ± 0.03 | 15.4 ± 0.1 |
| + | Cell lysate | 2.5 | 108.1 ± 0.7 | 18.0 ± 0.1 |
| + | Media | 2.5 | 94.1 ± 1.3 | 16.7 ± 1.7 |
HG from matrices spiked with arsenicals was carried out with or without pretreatment with 2% Cys for 70 min.
The relative efficiency was calculated as: [peak area for DMAsV (or DMTA)/peak area for DMAsIII] × 100%; mean ± SD for 3 measurements are shown for each condition.
Speciation analysis of As in cells exposed to iAsIII in culture
Biological samples for As speciation analysis by HG-CT-AAS were prepared by exposing cultured cells to 1 μM iAsIII for 24 h. HepG2 and UROtsa/F35 cells that express AS3MT and methylate iAsIII 20,27 were used in these experiments. The parental UROtsa cell line that neither expresses AS3MT nor methylates iAsIII 20 was used as a non-methylating control. Because MAsIII and DMAsIII produced by methylating cells may oxidize during the 24 h exposure, all cell lysates and media were pretreated with Cys before HG. Calibration curves for pentavalent As standards spiked in cell lysates or media from control HepG2 and UROtsa/F35 cultures that were not exposed to iAsIII were used to quantify analyses; all standards were treated with Cys before HG. Table 3 shows total iAs, MAs, and DMAs detected in media and cell lysates and calculated recoveries of the known amounts of iAsIII added into the cultures. Identities of As species were confirmed by spiking aliquots of samples with As standards. As expected, significant amounts of MAs and DMAs were found in HepG2 and UROtsa cultures exposed to iAsIII. MAs and DMAs represented, respectively 12.3% and 1.8% of total speciated As in HepG2 cells as compared to 1.9% and 41.7% of total speciated As in UROtsa/F35 cells. Methylated As species were not found in UROtsa cells. Recoveries of As ranged from 88 to 98%. No As species were detected in control cell cultures that were not exposed to iAs.
Table 3.
Speciation of As in cell lines exposed to 1 μM iAsIII (150 ng As well−1) for 24 h
| As speciesa,b |
|||||||
|---|---|---|---|---|---|---|---|
| Cell line | Sample | iAsIII+V/ng | MAsIII+V/ng | DMAsIII+V/ng | Sum of As species/ng | Total speciated As/ng | As recoveryc (%) |
| HepG2 | Cell lysate | 6.8 ± 0.2 | 5.4 ± 0.2 | 2.5 ± 0.1 | 14.7 ± 0.1 | 138.4 ± 1.2 | 92.2 ± 0.8 |
| Medium | 112 ± 1.4 | 11.7 ± 0.6 | ND | 123.7 ± 1.3 | |||
| UROtsa/F35 | Cell lysate | 2.1 ± 0.2 | 0.95 ± 0.2 | 29.3 ± 0.7 | 32.3 ± 0.9 | 132.4 ± 2.0 | 88.3 ± 1.4 |
| Medium | 72.7 ± 1.2 | 1.5 ± 0.1 | 25.9 ± 1.1 | 100.1 ± 1.7 | |||
| UROtsa | Cell lysate | 6.4 ± 0.2 | ND | ND | 6.4 ± 0.2 | 147.4 ± 1.9 | 98.1 ± 1.3 |
| Medium | 141 ± 2.0 | ND | ND | 141 ± 2.0 | |||
The total iAs (iAsIII+V), MAs (MAsIII+V), and DMAs (DMAsIII+V) were determined in samples pretreated with 2% Cys for 70 min. Mean ± SD values are shown for n = 3.
ND, not detected.
Recovery was calculated as: (total speciated As/150) × 100.
Speciation of As in tissues of mice exposed to iAsIII in drinking water
HG-CT-AAS was also used to analyze As species in the liver and quadriceps muscle of mice exposed to 50 ppm iAsIII in drinking water for 8 weeks. Because digestion in phosphoric acid oxidizes all AsIII-species in tissues to pentavalency, digestates were treated with Cys before analysis. Calibration curves were generated for pentavalent As standards prepared in phosphoric acid. In order to match the treatment of tissues, all standards were incubated at 90 °C overnight and treated with Cys before HG. Consistent with results of our previous studies,11 treatment with phosphoric acid did not result in demethylation of MAsV or DMAsV. Slopes of the calibration curves for iAsV, MAsV and DMAsV were 1.04, 0.99 and 1.03, respectively. These analyses found that the average concentration of total speciated As in liver was about two times greater than that in muscle (Table 4). In both tissues, DMAs (DMAsIII+V) was the major metabolite, representing 53.9% and 74.2% of total speciated As, respectively. On average, iAs (iAsIII+V) and MAs (MAsIII+V) represented, respectively 29.4% and 16.5% of total speciated As in the liver as compared to 13.8% and 11.8% in the muscle. To evaluate recoveries of As by HG-CT-AAS analysis, total As contents were determined by GF-AAS, using aliquots of tissues digested in nitric acid. Average recovery was 110% for quadricep and 105% for liver. The precision of the HG-CT-AAS analysis calculated as relative SD for three concentrations of iAsV, MAsV and DMAsV standards in phosphoric acid (0.25, 0.5, and 1 ng; n = 5) ranged from 1.3 to 4.4%. Notably, small amount of iAs was detected in the ultrapure phosphoric acid (126 pg ml−1) used for tissue digestion.
Table 4.
Speciation of As in the liver and quadriceps from mice exposed to iAsIII (50 ppm) in drinking water for 8 weeks
| As species determined by HG-CT-AASa |
||||||
|---|---|---|---|---|---|---|
| Tissue | iAsIII+V/ng g−1 of tissue | MAsIII+V/ng g−1 of tissue | DMAsIII+V/ng g−1 of tissue | Total speciated As/ng g−1 of tissue | Total As determined by GF-AAS/ng g−1 of tissue | As recoveryb (%) |
| Liver | 343 ± 30 | 193 ± 55 | 628 ± 139 | 1165 ± 219 | 1112 ± 137 | 105 ± 7 |
| Quadriceps | 88 ± 19 | 75 ± 5 | 472 ± 65 | 636 ± 85 | 577 ± 84 | 110 ± 12 |
The total iAs (iAsIII+V), MAs (MAsIII+V), and DMAs (DMAsIII+V) were determined in tissue digestates pretreated with 2% Cys for 70 min. Mean ± SD values are shown for n = 5.
Recovery was calculated as: (total speciated As/total As) × 100.
Oxidation state specific speciation analysis of As in biological samples
Samples for oxidation-state specific analyses of As species were generated using an in vitro assay system in which iAsIII was methylated by recombinant rat AS3MT and cultured rat hepatocytes exposed to iAsIII. Calibration curves were generated for each of these systems using tri- and pentavalent As standards spiked to the corresponding biological matrices, including the in vitro assay mixture and cell lysates and medium from a control hepatocyte culture that was not exposed to As. Biological matrices spiked with pentavalent As standards were treated with Cys before HG. Slopes of these calibration curves were similar to those reported in Table 1. Because trimethyl-As species are final products of iAs methylation by rat AS3MT,28 TMAsVO was used as an additional As standard for these analyses.
Fig. 3 shows chromatograms for analysis of As species in the in vitro assay mixture after a 1 h incubation with 3 μM iAsIII. In addition to peaks of arsine, methylarsine and dimethylarsine, a peak with a retention time corresponding to trimethylarsine was detected in reaction mixtures analyzed directly and in mixtures pretreated with Cys in which the temperature gradient and gas flow were modified to improve separation. Table 5 summarizes these analyses. All trivalent and pentavalent arsenic containing species, except MAsIII, were detected in reaction mixtures after a 1 h incubation. After overnight incubation, practically all iAsIII was methylated. TMAsVO was the major methylated metabolite found in reaction mixtures, accounting 28.9% and 80.3% of the total speciated As after 1 h and overnight incubation, respectively. Notably MAsIII was not detected at either incubation time. About 100% of As added into the reaction mixture was recovered after 1 h incubation. In contrast, As recovery after overnight incubation was only 73%.
Fig. 3.
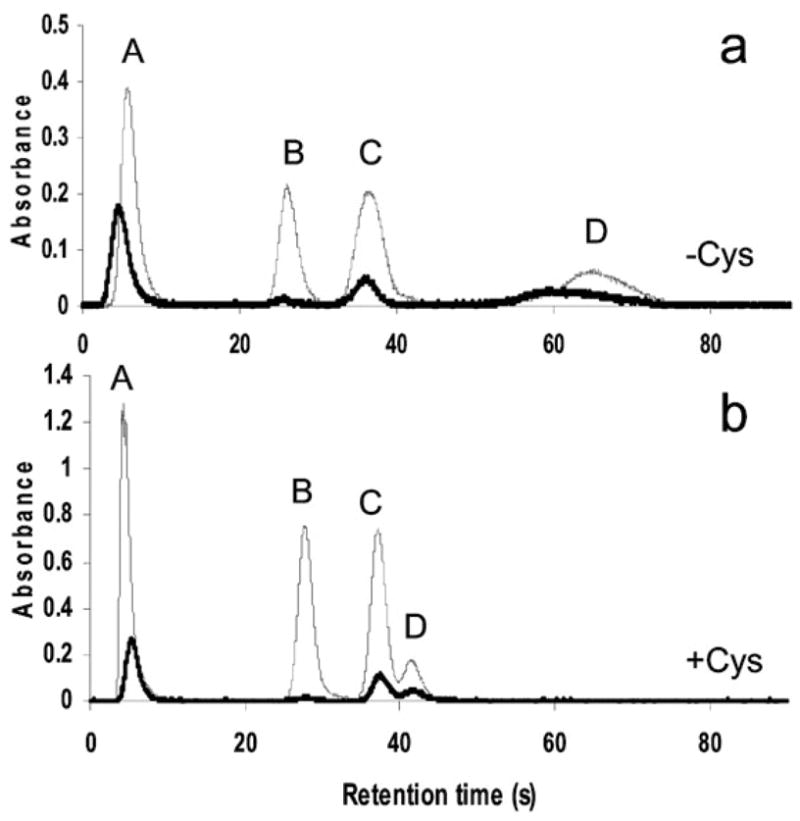
The oxidation state specific analysis of metabolites of iAsIII produced in an in vitro reaction catalyzed by rat AS3MT: The reaction mixture (100 μl) containing 100 mM sodium phosphate (pH 7.4), 100 mM Tris buffer (pH 7.4), 2 μM E. coli thioredoxin, 1 mM S-adenosylmethionine, 0.25 μM rat thioredoxin reductase, 300 μM NADPH, 3 μM of iAsIII, and 2 μg of recombinant rat AS3MT was incubated at 37 °C for 60 min. Aliquots of the mixture were analyzed by HG-CT-AAS before and after pretreatment with Cys (—). Identities of spectral peaks were confirmed, using aliquots of the reaction mixture spiked with (a) iAsIII, MAsIII, DMAsIII, and TMAsO (0.5 ng each) or (b) iAsV, MAsV, DMAsV, and TMAsO (2.5 ng As each) (—). Peaks: A, arsine; B, methylarsine; C, dimethylarsine; D, trimethylarsine.
Table 5.
The oxidation state specific speciation analysis of As in in vitro AS3MT reaction mixture incubated with 3 μM iAsIII (225 ng As)
| As speciesa,b |
|||||||||
|---|---|---|---|---|---|---|---|---|---|
| Incubation time | iAsIII/ng | MAsIII/ng | DMAsIII/ng | TMAsVO/ng | iAsV/ng | MAsV/ng | DMAsV/ng | Total speciated As/ng | As recoveryc (%) |
| 60 min | 106.1 ± 4.8 | ND | 31.2 ± 0.1 | 65.6 ± 3.0 | 11.3 ± 5.0 | 2.3 ± 0.7 | 10.3 ± 4.7 | 226.7 ± 12.6 | 100.8 ± 5.6 |
| Overnight | ND | ND | 17.4 ± 2.7 | 132.3 ± 7.4 | 4.2 ± 1.5 | ND | 10.8 ± 3.1 | 164.7 ± 1.3 | 73.2 ± 0.6 |
AsIII-species were analyzed directly without pretreatment with Cys; for analysis of AsIII+V-species, samples were treated with 2% Cys for 70 min before HG. The contents of AsV-species were calculated as a diffierence between the two measurements. Mean ± SD values are shown for n = 3.
ND, not detected.
Recovery was calculated as: (total speciated As/225) × 100.
Table 6 shows As species detected in cultured rat hepatocytes exposed to 0.1 and 1 μM iAsIII for 2 or 6 h. Fig. 4 shows chromatograms for arsines generated from lysates and medium from cultures exposed for 2 h to 1 μM iAsIII. These short exposure times were chosen to minimize oxidation of methylated AsIII-species formed during methylation of iAs. Both tri-and pentavalent MAs and DMAs were found in lysates and culture media under these conditions. DMAsV was the major methylated metabolite for all exposure times and exposure levels. TMAsVO was not detected in either lysates or culture media. After a 2 h incubation, summed methylated metabolites accounted for about 74.3% and 39.5% of total speciated As in cultures exposed to 0.1 or 1 μM iAsIII. After 6 h, summed methylated metabolites accounted for 96.7% and 83.2% in cultures at 0.1 and 1 μM iAsIII, respectively. Recoveries of As ranged from 78% to 117%.
Table 6.
The oxidation state specific speciation analysis of As in primary cultures of rat hepatocytes exposed to 0.1 μM iAsIII (15 ng As per well) or 1 μM iAsIII (150 ng As per well) for 2 or 6 h
| As speciesab |
|||||||||||
|---|---|---|---|---|---|---|---|---|---|---|---|
| Incubation time | [iAsIII]/μM | Sample | iAsIII/ng | MAsIII/ng | DMAsIII/ng | iAsV/ng | MAsV/ng | DMAsV/ng | Sum of As species/ng | Total speciated As/ng | As recovery (%)c |
| 2 h | 0.1 | Cell lysate | 0.65 ± 0.0 | 0.04 ± 0.05 | 1.3 ± 0.2 | 0.05 ± 0.02 | 0.1 ± 0.04 | 5.5 ± 0.5 | 7.7 ± 0.5 | 11.7 ± 0.6 | 77.8 ± 4.1 |
| Medium | 2.1 ± 0.3 | NDc | 0.4 ± 0.1 | 0.2 ± 0.1 | ND | 1.4 ± 0.1 | 4.0 ± 0.2 | ||||
| 1.0 | Cell lysate | 20.3 ± 1.5 | 12.7 ± 0.6 | 4.9 ± 0.8 | 0.9 ± 0.4 | 1.3 ± 0.3 | 39.3 ± 5.6 | 79.4 ± 6.8 | 175.7 ± 13.4 | 117.2 ± 8.9 | |
| Medium | 70.4 ± 1.9 | 0.5 ± 0.4 | 2.5 ± 1.3 | 14.8 ± 4.9 | 0.5 ± 0.4 | 7.6 ± 2.1 | 96.3 ± 9.7 | ||||
| 6 h | 0.1 | Cell lysate | 0.08 ± 0.01 | ND | 2.4 ± 0.6 | 0.1 ± 0.1 | ND | 7.7 ± 0.8 | 10.3 ± 0.3 | 14.4 ± 0.2 | 95.9 ± 1.5 |
| Medium | 0.02 ± 0.001 | ND | 0.71 ± 0.2 | 0.3 ± 0.01 | ND | 3.1 ± 0.03 | 4.1 ± 0.2 | ||||
| 1.0 | Cell lysate | 4.6 ± 0.3 | 3.0 ± 0.03 | 18.2 ± 1.2 | 1.6 ± 0.8 | 0.4 ± 0.1 | 66.3 ± 3.1 | 94.1 ± 1.4 | 143.1 ± 1.9 | 95.4 ± 1.3 | |
| Medium | 14.3 ± 0.3 | ND | 6.6 ± 0.3 | 3.5 ± 1.5 | ND | 24.5 ± 0.9 | 48.9 ± 1.7 | ||||
AsIII-species were analyzed directly without pretreatment with Cys; for analysis of AsIII+V-species, samples were treated with 2% Cys for 70 min before HG. The contents of AsV-species were calculated as a difference between the two measurements. Mean ± SD values are shown for n = 3.
ND, not detected.
Recovery was calculated as: (total speciated As/15 or 150) × 100.
Fig. 4.
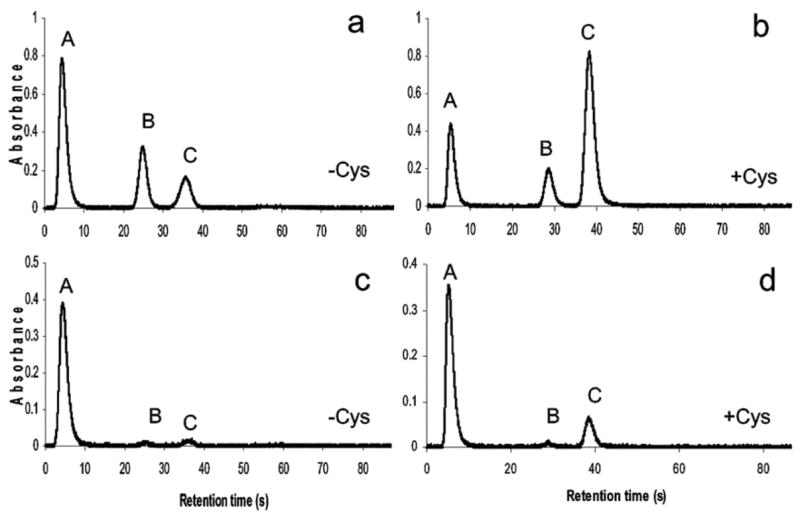
Speciation analysis of As in primary culture of rat hepatocytes exposed for 2 h to 1 μM iAsIII: HG was carried out in cell lysates (a,b) and culture media (c,d) before (a,c) or after (b,d) pretreatment with Cys. Peaks: A, arsine; B, methylarsine; C, dimethylarsine. (Note: Samples were diluted in 10 or 20 volumes of deionized water prior to analysis in the absence or presence of Cys, respectively.)
Discussion
HG-CT-AAS has played a key role in providing evidence for the formation of toxic and potentially carcinogenic methylated trivalent arsenicals, MAsIII and DMAsIII, in the pathway for methylation of iAs in humans.8,10,11,20,27 The current work describes refinement of HG-CT-AAS in which the HG and CT steps are automated and a multiatomizer is used to improve DL. These modifications increase analytical throughput and markedly improve DL values for all metabolites of iAs commonly found in human urine. DL values for these arsenicals in relatively complex biological matrices, cell lysates and culture media, range from 8 to 20 pg (i.e., 16 to 40 pg ml−1 for a 0.5 ml sample loop) and are about an order of magnitude lower that those we have reported for a manual HG-CT-AAS system equipped with a conventional atomizer (140 to 400 pg).11 These DL are comparable to DL values reported for most HPLC-AFS or HPLC-ICP-MS techniques often used for oxidation state specific analysis of As in biological samples.9,16,29–31 In addition, because slopes of the calibration curves for tri- and pentavalent iAs, MAs and DMAs spiked to cell lysates or culture media are very similar, calibration for a single As-species is sufficient for quantification. However, further optimization and validation of the HG-CT-AAS protocol may be needed for the oxidation state specific analyses of As species in other biological matrices.
The average retention times for individual arsines described above are specific for the instrumentation used in this study. These retention times depend on a variety of factors, including interferences associated with specific biological matrices, the size of U-tube, the temperature gradient used to release arsines from the cryotrap, or on flow rates of the carrier gases. In addition, the separation of arsines depends in part on chemical properties of the absorbent filled in the U-tube. Matousek et al.21 have shown that gas chromatography on Chromosorb WAW-dimethyldichlorosilane contributes to the separation of arsines during the heating step. Thus, it is essential that key parameters affecting arsine separation are optimized for each specific HG-CT-AAS system. Proper standards should be used to confirm identities of arsines released from the cryotrap. This procedure must be repeated during the analyses and specifically, every time key instrumental parts or parameters are modified. Users should be also aware of potential problems associated with memory of the HG-CT-AAS system. In our laboratory, small amounts of dimethylarsine were often detected in blanks run after DMAs-rich biological samples, indicating that dimethylarsine absorbs in the surface of the tubing or in the CT unit. In most cases, a rerun of a multiple blanks completely cleaned up the system.
Although TMAsO is not a major metabolite of iAs in humans, it is a product of iAs methylation by rat AS3MT28 and is found in urine of rats exposed to iAs or DMAsV.32–34 Here, TMAsO was identified as a major metabolite of iAs in an in vitro assay mixture in which methylation of iAs was catalyzed by recombinant rat AS3MT. Notably, low As recovery (72.3%) after the overnight incubation of the assay mixture is consistent with formation of volatile trimethylarsine, the final product of in vitro methylation of iAs by rat AS3MT. A similar As recovery (72.5%) was reported for an in vitro methylation system containing 10 μM iAsIII, recombinant rat AS3MT (5 μg), AdoMet, and a synthetic reductant, tris(2-carboxylethyl)phosphine (TCEP), after a 16 h incubation at 37 °C.35 Analysis of the gaseous phase of this system detected a significant amount of trimethylarsine. By comparison, the absence of TMAsO as a product of iAs methylation by cultured primary rat hepatocytes was likely due to a relatively high intracellular concentration of glutathione. Glutathione has been shown to inhibit the formation of both TMAsO and trimethylarsine by recombinant AS3MT.35 Previous work using the automated HG-CT-AAS21 has shown that separation of dimethylarsine and trimethylarsine generated from aqueous solutions of DMAsV and TMAsO depends on the size of the U tube and the temperature gradient applied during the heating step. In fact, a complete separation was achieved only after heating was interrupted to delay release of trimethylarsine. In the current study using a similarly designed automated HG-CT-AAS instrumentation and similar heating program, a complete separation of dimethylarsine and trimethylarsine generated from biological matrices was achieved only after HG in the absence of Cys. However, the broad peak corresponding to trimethylarsine (Fig. 3a) could be a source of errors during the signal quantification. Thus, although the current system represents an improved tool for analysis of the common human metabolites of iAs, it requires further optimization for quantitative analysis of TMAsO, the metabolite of iAs in rats.
Despite a significant improvement for DL values, the limited specificity of the HG-CT-AAS system remains a potential problem. This method detects arsines generated from arsenicals during the HG reaction, but provides only limited information about the chemical nature of these arsenicals. In addition, some arsenicals commonly found in biological matrices (e.g., arsenocholine or arsenobetaine) cannot produce arsines in the reaction with sodium borohydride, and thus cannot be detected by HG-CT-AAS. In our laboratory, HG-CT-AAS has been used specifically for examination of iAs metabolism in well-defined biological systems in which only the HG-active tri- and pentavalent MAs, and DMAs and pentavalent TMAsVO are formed in the process of AS3MT-catalyzed methylation and in which the presence of other HG-active or HG-resistant forms of As is not expected. Indeed, high As recoveries from these systems suggest that all or most As species present were accounted for. Under these conditions, a speciation error can occur only if an unknown metabolite of iAs with a HG activity similar to those of the known metabolites is formed. Several recent reports have suggested that sulfur-containing As species, specifically DMTA and dimethyldithioarsinic acid, are products of iAs metabolism in mammals.12,36,37 DMTA was found in a wide range of concentrations in urines collected from residents of arseniasis endemic areas of Bangladesh who are exposed to iAs in drinking water.12 Because DMTA forms dimethylarsine in reaction with NaBH4,37 the presence of DMTA in biological samples may interfere with HG-CT-AAS analysis of DMAsIII and/or DMAsV. The present study examined the relative HG efficiencies for DMTA, DMAsIII and DMAsV. Our data show that HG from Tris buffer (pH 6) in the absence of Cys was rather inefficient for both DMAsV and DMTA as compared to DMAsIII. In contrast, the efficiency of HG for DMTA increased in samples pretreated with Cys, reaching up to 35% of that for DMAsIII or DMAsV (Table 2). The recoveries of As in biological samples generated in this study, including mouse tissues, cultured cells or in vitro methylating systems, ranged from 78 to 117%. Lower recoveries in some of these samples might indicate the presence of small amounts of DMTA or As species other than tri- and pentavalent iAs, MAs or DMAs. These findings are consistent with the identity of DMAsIII as a product of iAs metabolism, not as an analytical artifact as has been recently suggested.12,38
In summary, the automated HG-CT-AAS equipped with the multiatomizer represents an effiective and highly sensitive method for the oxidation state specific analysis of common human metabolites of iAs, including iAsIII, iAsV, MAsIII, MAsV, DMAsIII, and DMAsV. The advantage of this system is that even more complex biological samples (e.g., cell lysates of serum-containing tissue culture media) that contain protein-bound arsenicals can be analyzed directly without prior extraction or separation, thus preserving the oxidation state of AsIII in unstable methylated species. Importantly, the presence of DMTA does not significantly interfere with analysis of DMAsIII, one of the most toxic and potentially carcinogenic products of iAs metabolism in humans. However, because of its limited specificity, HG-CT-AAS alone is not suitable for a comprehensive analysis of environmental or biological samples which contain HG-resistant As species or As species with unknown HG activity.
Acknowledgments
The authors thank Professor William R. Cullen, Department of Chemistry, University of British Columbia, who provided methylated trivalent arsenicals and TMAsO for this study and Dr Jack Creed, NERL, US EPA, for the generous gift of DMTA. We thank Ms Sharon Harper, NERL, US EPA, for assistance with GF-AAS analysis. This work was supported by NIH grants No. 1 R03 TW007057 and 1 R01 010845 to MS. This manuscript has been reviewed in accordance with the policy of the National Health and Environmental Effects Research Laboratory, US EPA, and approved for publication. Approval does not signify that the contents necessarily reflect the views and policies of the Agency, nor does mention of trade names or commercial products constitute endorsement or recommendation for use.
References
- 1.Arsenic in drinking water. National Research Council; Washington, DC: 1999. [Google Scholar]
- 2.Chen CJ, Chen CW, Wu MM, Kuo TL. Br J Cancer. 1992;66:888–892. doi: 10.1038/bjc.1992.380. [DOI] [PMC free article] [PubMed] [Google Scholar]
- 3.EHC 224 Arsenic and arsenite compounds. 2. World Health Organization; Geneva: 2001. [Google Scholar]
- 4.Some drinking water disinfectants and contaminants, including arsenic. IARC press; Lyon: 2004. [PMC free article] [PubMed] [Google Scholar]
- 5.Le XC, Lu X, Ma M, Cullen WR, Aposhian HV, Zheng B. Anal Chem. 2000a;72:5172–5177. doi: 10.1021/ac000527u. [DOI] [PubMed] [Google Scholar]
- 6.Le XC, Minsghen M, Xiufen L, Cullen WR, Aposhian HV, Zheng B. Environ Health Perspect. 2000b;108:1015–1018. doi: 10.1289/ehp.001081015. [DOI] [PMC free article] [PubMed] [Google Scholar]
- 7.Gong Z, Lu X, Cullen WR, Le XC. J Anal At Spectrom. 2001;16:1409–1413. [Google Scholar]
- 8.Del Razo LM, Styblo M, Cullen WR, Thomas DJ. Toxicol Appl Pharmacol. 2001;174:282–293. doi: 10.1006/taap.2001.9226. [DOI] [PubMed] [Google Scholar]
- 9.Mandal BK, Ogra Y, Suzuki KT. Chem Res Toxicol. 2001;14:371–378. doi: 10.1021/tx000246h. [DOI] [PubMed] [Google Scholar]
- 10.Valenzuela OL, Borja-Aburto VH, Garcia-Vargas GG, Garcia-Montalvo EA, Calderon-Aranda ES, Del Razo LM. Environ Health Perspect. 2005;113:250–254. doi: 10.1289/ehp.7519. [DOI] [PMC free article] [PubMed] [Google Scholar]
- 11.Devesa V, Del Razo LM, Adair B, Drobna Z, Waters S, Hughes M, Styblo M, Thomas DJ. J Anal At Spectrom. 2004;19:1460–1467. [Google Scholar]
- 12.Raml R, Rumpler A, Goessler W, Vahter M, Li L, Ochi T, Francesconi KA. Toxicol Appl Pharmacol. 2007 doi: 10.1016/j.taap.2006.12.014. [DOI] [PubMed] [Google Scholar]
- 13.Lin S, Shi Q, Nix FB, Styblo M, Beck MA, Herbin-Davis KM, Hall LL, Simeonsson JB, Thomas DJ. J Biol Chem. 2002;277:10795–10803. doi: 10.1074/jbc.M110246200. [DOI] [PubMed] [Google Scholar]
- 14.Thomas DJ, Li J, Waters SB, Xing W, Adair B, Drobna Z, Devesa V, Styblo M. Exp Biol Med. 2007;232:3–13. [PMC free article] [PubMed] [Google Scholar]
- 15.Thomas DJ, Styblo M, Lin S. Toxicol Appl Pharmacol. 2001;176:127–144. doi: 10.1006/taap.2001.9258. [DOI] [PubMed] [Google Scholar]
- 16.Xie R, Johnson W, Spayd S, Hall GS, Buckley B. Anal Chim Acta. 2006;113:250–254. doi: 10.1016/j.aca.2006.06.076. [DOI] [PubMed] [Google Scholar]
- 17.Mandal BK, Ogra Y, Anzai K, Suzuki KT. Toxicol Appl Pharmacol. 2004;198:307–318. doi: 10.1016/j.taap.2003.10.030. [DOI] [PubMed] [Google Scholar]
- 18.Suzuki Sakuma KT, Ogra A, Ohmichi M. Toxicol Appl Pharmacol. 2004;198:336–344. doi: 10.1016/j.taap.2003.10.029. [DOI] [PubMed] [Google Scholar]
- 19.Chowdhury UK, Zakharyan RA, Hernandez A, Avram MD, Kopplin MJ, Aposhian HV. Toxicol Appl Pharmacol. 2006;216:446–457. doi: 10.1016/j.taap.2006.06.014. [DOI] [PubMed] [Google Scholar]
- 20.Drobna Z, Waters SB, Devesa V, Harmon AW, Thomas DJ, Styblo M. Toxicol Appl Pharmacol. 2005;207:147–159. doi: 10.1016/j.taap.2004.12.007. [DOI] [PMC free article] [PubMed] [Google Scholar]
- 21.Matousek T, Hernandez-Zavala A, Svoboda M, Langerova L, Adair BM, Drobna Z, Thomas DJ, Styblo M, Dedina J. Spectrochim Acta, Part B. 2007 doi: 10.1016/j.sab.2007.11.037. submitted for publication. [DOI] [PMC free article] [PubMed] [Google Scholar]
- 22.Cullen WR, McBridge BC, Reglinski J. J Inorg Biochem. 1984;21:179–194. [Google Scholar]
- 23.Fricke MW, Zeller M, Sun H, Lai VWM, Cullen WR, Shoemaker JA, Witkowski MR, Creed JT. Chem Res Toxicol. 2005;18:1821–1829. doi: 10.1021/tx050227d. [DOI] [PubMed] [Google Scholar]
- 24.Walton FS, Waters SB, Jolley SL, LeCluyse EL, Thomas DJ, Styblo M. Chem Res Toxicol. 2003;16:261–265. doi: 10.1021/tx025649r. [DOI] [PubMed] [Google Scholar]
- 25.Hughes M, Devesa V, Adair BM, Styblo M, Kenyon EM, Thomas DJ. Toxicol Appl Pharmacol. 2005;208:186–197. doi: 10.1016/j.taap.2005.02.008. [DOI] [PMC free article] [PubMed] [Google Scholar]
- 26.Matousek T, Dedina J, Selecka A. Spectrochim Acta, Part B. 2002;57:451–452. [Google Scholar]
- 27.Drobna Z, Xing W, Thomas DJ, Styblo M. Chem Res Toxicol. 2006;19:894–898. doi: 10.1021/tx060076u. [DOI] [PMC free article] [PubMed] [Google Scholar]
- 28.Waters SB, Devesa V, Del Razo LM, Styblo M, Thomas DJ. Chem Res Toxicol. 2004;17:404–409. doi: 10.1021/tx0342161. [DOI] [PubMed] [Google Scholar]
- 29.Suzuki KT, Mandal B, Ogra Y. Talanta. 2002;58:111–119. doi: 10.1016/s0039-9140(02)00260-6. [DOI] [PubMed] [Google Scholar]
- 30.Gong Z, Lu X, Ma M, Watt C, Le XC. Talanta. 2002;58:77–96. doi: 10.1016/s0039-9140(02)00258-8. [DOI] [PubMed] [Google Scholar]
- 31.Tseng CH, Huang YK, Huang YL, Chung CJ, Yang MH, Chen CJ, Hsueh YM. Toxicol Appl Pharmacol. 2005;206:299–308. doi: 10.1016/j.taap.2004.11.022. [DOI] [PubMed] [Google Scholar]
- 32.Yoshida K, Chen H, Inoue Y, Wanibuchi H, Fukushima S, Kuroda K, Endo G. Arch Environ Contam Toxicol. 1997;32:416–421. doi: 10.1007/s002449900206. [DOI] [PubMed] [Google Scholar]
- 33.Yoshida K, Inoue Y, Kuroda K, Chen H, Wanibuchi H, Fukushima S, Endo G. J Toxicol Environ Health. 1998;54:179–192. doi: 10.1080/009841098158890. [DOI] [PubMed] [Google Scholar]
- 34.Cohen SM, Arnold LL, Uzvolgyi E, Cano M, St John M, Yamamoto S, Lu X, Le XC. Chem Res Toxicol. 2002;15:1150–1157. doi: 10.1021/tx020026z. [DOI] [PubMed] [Google Scholar]
- 35.Waters SB, Devesa V, Fricke MW, Creed JT, Styblo M, Thomas DJ. Chem Res Toxicol. 2004;17:1621–1629. doi: 10.1021/tx0497853. [DOI] [PubMed] [Google Scholar]
- 36.Suzuki KT, Mandal BK, Katagiri A, Sakuma Y, Kawakami A, Ogra Y, Yamaguchi K, Sei Y, Yamanaka K, Anzai M, Ohmichi H, Takayama H, Aimi N. Chem Res Toxicol. 2004;17:914–921. doi: 10.1021/tx049963s. [DOI] [PubMed] [Google Scholar]
- 37.Raml R, Goessler W, Francesconi KA. J Chromatogr, A. 2006;1128:164–170. doi: 10.1016/j.chroma.2006.06.061. [DOI] [PubMed] [Google Scholar]
- 38.Regmi R, Milne BF, Feldmann J. Anal Bioanal Chem. 2007 doi: 10.1007/s00216-006-1076-z. [DOI] [PubMed] [Google Scholar]