

Abstract
The higher affinity of Cd2+ for sulfur compounds than for nitrogen and oxygen led to the theoretical consideration that cadmium toxicity should result mainly from the binding of Cd2+ to sulfide, thiol groups, and sulfur-rich complex compounds rather than from Cd2+ replacement of transition-metal cations from nitrogen- or oxygen-rich biological compounds. This hypothesis was tested by using Escherichia coli for a global transcriptome analysis of cells synthesizing glutathione (GSH; wild type), γ-glutamylcysteine (ΔgshB mutant), or neither of the two cellular thiols (ΔgshA mutant). The resulting data, some of which were validated by quantitative reverse transcription-PCR, were sorted using the KEGG (Kyoto Encyclopedia of Genes and Genomes) orthology system, which groups genes hierarchically with respect to the cellular functions of their respective products. The main difference among the three strains concerned tryptophan biosynthesis, which was up-regulated in wild-type cells upon cadmium shock and strongly up-regulated in ΔgshA cells but repressed in ΔgshB cells containing γ-glutamylcysteine instead of GSH. Overall, however, all three E. coli strains responded to cadmium shock similarly, with the up-regulation of genes involved in protein, disulfide bond, and oxidative damage repair; cysteine and iron-sulfur cluster biosynthesis; the production of proteins containing sensitive iron-sulfur clusters; the storage of iron; and the detoxification of Cd2+ by efflux. General energy conservation pathways and iron uptake were down-regulated. These findings indicated that the toxic action of Cd2+ indeed results from the binding of the metal cation to sulfur, lending support to the hypothesis tested.
With the exception of that of copper, the affinities of the borderline metals of the first transition group for the ligands oxygen and sulfur increase in the same manner as those of the metals of the second group, in order from Mn2+ to Zn2+. In contrast, Cd2+ (and Pb2+) has a much higher affinity for sulfur than for oxygen (40). Thus, Cd2+ toxicity should be the result mainly of the affinity of Cd2+ for sulfur. If in a physiological complex, the first-shell ligands around a transition-metal cation are mainly nitrogen or oxygen, Cd2+ should not be able to replace that particular cation. Cadmium should replace the cations, however, if the first shell is composed of sulfur atoms predominantly. Theoretically, cadmium toxicity should be the result of the binding of Cd2+ to sulfide, generated during the biosynthesis of cysteine and of iron-sulfur centers (FeS centers); binding to thiol groups, e.g., of proteins; and the replacement of other transition-metal cations from such sulfur-rich complex compounds.
Cellular thiols may interfere with this mode of action of cadmium toxicity. The main cellular thiol in cyanobacteria and proteobacteria is glutathione (GSH), which is absent in many other prokaryotes that contain other thiol compounds like mycothiol and ergothioneine (14, 39). GSH (l-γ-glutamyl-l-cysteine-glycine) is essential in Saccharomyces cerevisiae for full cadmium resistance (18) and is the main substrate for the synthesis of the cadmium-binding polypeptide phytochelatin in many plants and fungi (11, 13). GSH is synthesized from glutamate, cysteine, and glycine in two ATP-consuming steps (involving GshA and GshB) via the intermediate γ-glutamylcysteine (γEC). The latter is the major thiol in aerobic phototrophic halobacteria (archaea) (14), while cysteine may substitute for GSH in some functions in Bacillus subtilis (24).
In Escherichia coli, GSH is necessary for full resistance to cadmium and chromate. In mutant cells with deletions of efflux systems for zinc and copper, GSH also protects against these metals (21). Despite its role as the sole thiol in halobacteria (14), γEC is not able to fulfill the function of GSH in transition-metal resistance by E. coli (21). On the contrary, ΔgshB mutant cells that contain γEC are more sensitive to transition metals than ΔgshA mutant cells that contain neither GSH nor γEC. In this work, we investigated the impact of cadmium on the global transcriptome of E. coli wild-type and ΔgshA and ΔgshB mutant cells to evaluate the molecular basis of cadmium toxicity in the presence or absence of cellular thiols. This analysis was done to test the hypothesis that cadmium toxicity is mainly the effect of the high affinity of cadmium for thiol groups and sulfide.
MATERIALS AND METHODS
Bacterial strains and growth conditions.
E. coli wild-type strain W3110 and its ΔgshA and ΔgshB mutant derivatives (21) were grown at 37°C in Tris-buffered mineral salts medium (34) containing 2 ml of glycerol and 3 g of Casamino Acids per liter (TMM). Solid medium contained 20 g of agar/liter. Antibiotics (chloramphenicol at 25 μg/ml, kanamycin at 25 μg/ml, and ampicillin at 125 μg/ml) and metals were added where appropriate.
Growth experiments.
Overnight cultures of E. coli strains were diluted 1:1,000 in fresh TMM. After 2 h, they were diluted 1:50 (wild-type and ΔgshA cells) or 1:25 (ΔgshB cells) in fresh TMM and cultivated with shaking at 37°C until the density reached 100 Klett units. CdCl2 was added or not, and incubation continued with shaking. The turbidity over 6 h was monitored with a Klett photometer. Finally, the optical density at 600 nm was measured using a SmartSpec3000 photometer (Bio-Rad, Munich, Germany) in order to calculate the dry mass of the cells for GSH content determination and atomic absorption spectroscopy (AAS).
β-Galactosidase assay and lacZ reporter construction.
Promoter-lacZ fusions were constructed and inserted into the λ attachment site as described previously (12, 20). The resulting E. coli cells containing a single-copy lacZ fusion on the bacterial chromosome were grown overnight in Luria-Bertani medium, diluted 1:100 into Tris mineral salts medium, grown overnight, and diluted 1:100 in fresh medium. After 2 h of growth, increasing concentrations of metals were added. Incubation was continued with shaking for 2 h at 37°C, and the β-galactosidase activity was determined (35).
GSH content determination.
A volume of cells corresponding to 2.5 mg (dry mass) was harvested and then suspended in 1 ml of 0.1 N HCl, and the cells were disrupted by ultrasonication for 2 min on ice with a UniEquip UW60 at 60 W and a 70% time interval. Cell debris was removed by centrifugation (15 min at 15,300 × g and 4°C). The supernatant was used to determine the protein concentration by the bicinchoninic acid assay with an assay kit from Sigma GmbH (Osterode) incorporating bovine serum albumin as the standard. The supernatant was also used to measure the GSH content by high-performance liquid chromatography (HPLC) analysis.
HPLC analyses of thiols were performed using monobromobimane derivatization as described previously (38). A volume of 0.12 ml of the cell-free supernatant was added to a mixture of 0.18 ml of 0.2 M CHES buffer [2-(cyclohexyl-amino-ethanesulfonate), pH 9.3] and 30 μl of 5 mM dithiothreitol. After incubation on ice for 1 h, 10 μl of monobromobimane (30 mM in methanol [MeOH]) was added for thiol derivatization and incubation was continued for 15 min in the dark at room temperature. The reaction was stopped with 5% acetic acid (vol/vol). HPLC analysis was carried out on a Lichrospher 60 RP Select B column (4 by 250 mm; particle size, 5 μm; Merck, Darmstadt, Germany) using a Merck-Hitachi LaChrom system equipped with a D-7000 interface, an L-7100 pump, an L-7200 autosampler, and a D-7480 fluorescence detector (excitation wavelength, 420 nm; emission wavelength, 520 nm). Mobile phase A consisted of a solution of 2% MeOH (vol/vol) in H2O with 2.5 ml of glacial acetic acid liter−1, adjusted to pH 4.3 with 10 N NaOH. Mobile phase B was composed of a solution of 90% MeOH (vol/vol) in H2O with 2.5 ml of glacial acetic acid liter−1, adjusted pH 3.9 with 0.1 N NaOH. HPLC running conditions are available upon request.
AAS.
Pelleted cells (0.1 mg [dry weight]) were broken in 0.1 ml of 10 M HNO3 and mineralized by the addition of 0.05 ml of 10 M H2O2. The volume was increased to 0.5 ml with H2O, and the metal content was measured by AAS with a ZEEnit 600/650 (Analytik Jena AG). Values determined from control experiments using blanks without cells were subtracted.
E. coli microarrays.
E. coli cells of the wild-type and ΔgshA and ΔgshB mutant strains in TMM were treated for 10 min with 100 μM Cd(II) or no metal as a control. The exposure time and concentration used were optimized in growth experiments prior to the analysis. Thus, a higher Cd(II) concentration than that used in a previously described gene array experiment was chosen (12).
The OciChip E. coli K-12 V2 arrays (Ocimum Biosolutions, Hyderabad, India) consisting of 4,239 gene-specific oligonucleotide spots plus 48 negative-control spots with DNA from Arabidopsis thaliana. Each set of conditions was tested in triplicate experiments including three independent bacterial cultures with one dye swap according to the MIAME (6) protocol (see the supplemental material).
RNA isolation and preparation of labeled cDNA.
Total RNA was isolated as described previously (19). After RNA isolation, DNase treatment was performed, followed by purification with RNeasy columns (Qiagen, Hilden, Germany). To exclude experimental artifacts resulting from DNA contamination, we used only RNA preparations that did not generate PCR fragments in a PCR with chromosomal primers and no previous reverse transcription (RT) reaction. The RNA concentration was determined photometrically, and RNA quality was checked on formamide gels (47). In an RT reaction, 50 μg of total RNA was labeled in a 40-μl labeling reaction mixture containing 9 μg of hexamer primers; a 50 μM concentration of either Cy3- or Cy5-labeled dCTP (Amersham, Freiburg, Germany); 0.5 mM (each) dATP, dGTP, and dTTP; 0.2 mM nonlabeled dCTP; 10 mM dithiothreitol; and 200 U of reverse transcriptase (SuperScript II; Invitrogen, Karlsruhe, Germany) in reaction buffer. Primers and RNA were heated to 70°C for 5 min and snap-cooled on ice. RT proceeded for 10 min at room temperature and then for 2 h at 42°C. To denature the remaining RNA, 10 μl of 1 M NaOH was added and the mixture was incubated for 10 min at 65°C, after which 10 μl of 1 M HCl was added. Unincorporated fluorescent nucleotides were removed using a QIAquick PCR purification kit (Qiagen, Hilden, Germany). The amount of cDNA and the integration of fluorescent dye were assessed as described previously (5).
Hybridization of DNA microarrays and image analysis.
Equal amounts of Cy3- and Cy5-labeled cDNA in 120 μl of hybridization buffer (salt based; Ocimum, Hyderabad, India) were denatured for 3 min at 94°C and hybridized to the OciChip E. coli K-12 V2 microarrays for 20 h at 42°C in a water bath with shaking. After hybridization, the arrays were washed in a solution of 2× SSC (1× is 0.15 M NaCl plus 0.015 M sodium citrate) containing 0.1% sodium dodecyl sulfate and then in 1× SSC and 0.1× SSC. The slides were scanned with a laser scanner (array scanner 428; Affymetrix, Santa Clara, CA) seven times per channel with increasing photomultiplier settings to expand the dynamic range of measurement. The resulting images were analyzed with the ImaGene 4.2 software (BioDiscovery, Inc., El Segundo, CA). Averages of the sensitivities were calculated by linear regression using MAVI Pro 2.6.0 software (MWG Biotech, Ebersberg, Germany).
Normalization.
For normalization and the calculation of ratios, two strategies that have previously led to identical results were used (12). First we performed the algorithm with GeneSight version 3.0 (BioDiscovery, Inc., El Segundo, CA). Second, we used our own algorithm (12), which provided more control over the steps of data processing. For a few genes, the results obtained by our method were compared to those obtained from the commercial software. In all tested cases, the results of the two procedures were similar.
Application of the KO information to the gene array results.
To get insight into the impact of gene deletion or treatment with Cd(II) on the metabolic network of E. coli, the KEGG orthology (KO) information (26) from GenomeNet (Bioinformatics Center, Institute for Chemical Research, Kyoto University; http://www.genome.jp) was applied. That way, the Q values (quotients resulting from the various comparisons of the mean gene array signals) could be grouped and analyzed. For each comparison, this procedure started with the data set “all data” (including values for controls), which in the second step was grouped into “controls” and “data”; in the third step, the entries in these groups were classified as “KO not assigned” and “KO assigned,” and in the fourth step the entries in the KO-assigned group were categorized into the level 1 groups of the KO system, as follows: 01100, “metabolism”; 01200, “genetic information processing”; 01300, “environmental information processing”; 01400, “cellular processes”; and 01500, “disease associated.” Each group of Q values was then further subgrouped into the level 2 and level 3 classes of the KO system. At each step, a list of Q values was obtained for each comparison and every KO category.
Validation of microarray data by quantitative real-time RT-PCR.
Microarray data were confirmed by quantitative RT-PCR (qRT-PCR) on a Rotor-Gene real-time PCR detection system (Corbett Life Science, Sydney, Australia). The cDNA was produced with the same RNA used for the microarray analysis. For real-time PCR, duplicate reaction mixtures (15 μl) with 0.5 μl of template cDNA and 2 pmol of primers and a QuantiTect Sybr green PCR kit (Qiagen, Hilden, Germany) were used. Details of PCR protocols and primer sequences are available upon request. Fluorescence was measured at the end of each 72°C incubation and analyzed using Rotor-Gene software. Melting-curve analyses (with temperatures ranging from 60 to 95°C in 0.5°C increments) were performed to ensure PCR specificity. The quantification of relative expression levels was done with comparative quantitation software (Rotor-Gene 6.0). The second derivative of raw data was taken to calculate the takeoff points. These points and the amplification efficiencies were used to calculate relative concentrations in each sample compared to those in the control sample. As an endogenous control, rpoZ was used. No-template control and no-RT (negative) control experiments were performed under conditions identical to those used for the target genes. Expression ratios were obtained by dividing two corresponding expression level values. The average of sextuplicate expression ratios for three independent biological samples was calculated and normalized by using the rpoZ data.
Microarray data accession number.
The microarray data were deposited in the GEO database under accession no. GSE11562.
RESULTS AND DISCUSSION
Growth and thiol state.
In a previous study (12), E. coli cells were treated with 25 μM Cd(II), which led to small changes in the global transcriptome, although the cadmium concentration was threefold higher than that used (1 μg/ml, or 8.9 μM) in yet another gene array study (55). To find the highest cadmium concentration E. coli and its GSH mutant strains are able to survive, CdCl2 was added in various final concentrations to growing E. coli cells (results for 100 μM and no CdCl2 are shown in Fig. 1; results for other concentrations are not shown except for ΔgshB cells). Wild-type and ΔgshA cells grew in the presence of up to 75 μM Cd(II) without growth retardation (data not shown) but exhibited a decreased growth rate at 100 μM Cd(II) (Fig. 1). Mutant ΔgshB cells ceased to grow upon cadmium addition but resumed growth after a lag phase that depended on the concentration of cadmium added (results for 50, 75, and 100 μM are shown in Fig. 1). For all strains, the addition of cadmium did not decrease the number of viable cells, as indicated by the determination of the CFU 10, 30, 60, and 360 min after cadmium addition (data not shown).
FIG. 1.
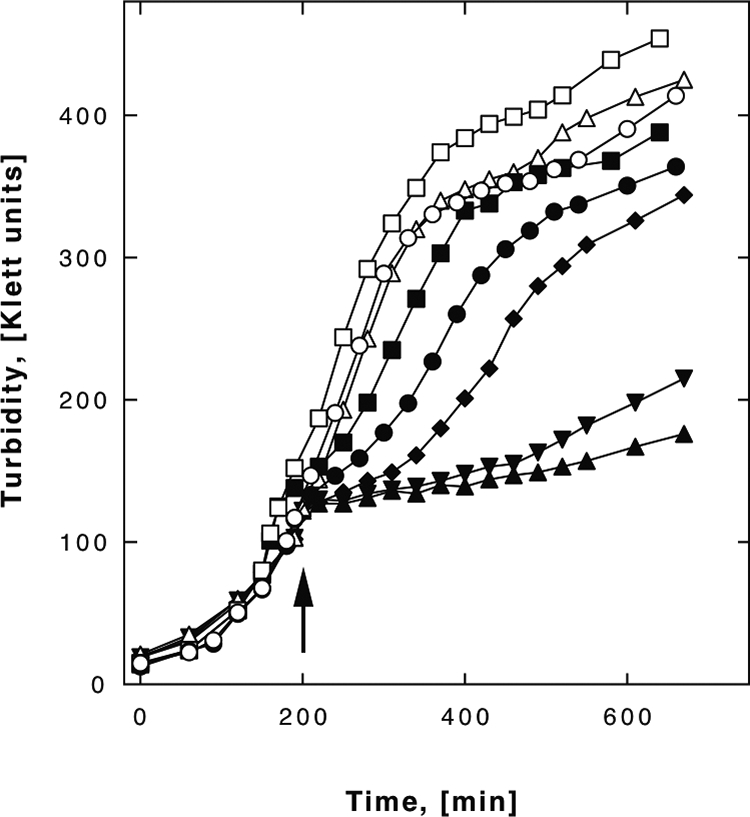
Growth of E. coli strains in the presence of cadmium. Growth curves for the E. coli strain W3110 wild type (circles) and the ΔgshA (squares) and ΔgshB (triangles and diamonds) mutant strains in TMM with 100 μM Cd(II) (closed symbols) or no Cd(II) (open symbols) are shown. For the ΔgshB strain, curves indicating growth in the presence of 50 μM CdCl2 (closed diamonds) and 75 μM CdCl2 (closed inverted triangles) are also given. The cells were cultivated with shaking until the density reached 100 Klett units, CdCl2 was added (arrow) or not, and incubation was continued with shaking. The mean values of results from three experiments are shown.
Additionally, 360 min after the addition of cadmium (Fig. 1), the cellular cadmium, GSH, cysteine, and γEC contents were determined (Fig. 2). The cadmium content in the wild-type cells (Fig. 2A) increased linearly with the cadmium concentration in the growth medium, reaching a mean ± a standard deviation of 17.4 ± 1.1 μmol/g (dry weight) of cells at 100 μM Cd(II). The mutant cells and the wild-type cells contained similar amounts of cadmium at concentrations of up to 50 μM Cd(II) in the growth medium, but the mutant cells had lower contents at 100 μM Cd(II) (ΔgshA cells) or 75 and 100 μM Cd(II) (ΔgshB cells). This failure to accumulate cadmium may have been the result of the inhibitory effect of cadmium on the cellular metabolism. As expected, neither of the mutant cell types contained GSH (Fig. 2B). In wild-type cells, the GSH content increased from 10.0 ± 6.6 μmol/g (dry weight) of cells with no Cd(II) in the medium to 16.3 ± 7.6 μmol/g with 25 μM Cd(II) in the medium but decreased to 7.6 ± 3.2 μmol/g at 100 μM Cd(II). At this concentration, the molar ratio of cadmium to GSH was 2:1; however, the distribution of cadmium between the cell wall and the cytoplasm was not known.
FIG. 2.

Cadmium and thiol contents of the E. coli cells cultivated in the presence of cadmium. Cells were cultivated in TMM at 37°C as described in the legend to Fig. 1. At the end of the growth period, the cadmium contents (A) were determined by AAS and the GSH (B), cysteine (C), and γEC (D) contents were determined by HPLC analysis. The HPLC results were expressed as the number of micromoles per gram of total protein and multiplied by 0.55, the number of grams of protein per gram (dry weight [d.w.]) of cells, for better comparison with the AAS data. Results for the E. coli wild-type (closed circles), ΔgshA (open circles), and ΔgshB (closed squares) strains are presented. Note that the y axes in panels A and B are similar but are different from those in the other two panels. The mean values of results from three experiments are shown.
Cells of the ΔgshB strain exhibited a decrease in the γEC content from about 25 μmol/g (dry weight) of cells in the absence of Cd(II) to about 5 μmol/g (dry weight) of cells in the presence of cadmium (Fig. 2D). Wild-type cells doubled their cysteine content from 0.9 ± 0.6 μmol/g (dry weight) of cells in the absence of Cd(II) to 1.9 ± 0.7 μmol/g (dry weight) of cells at 100 μM Cd(II), whereas the cysteine content in ΔgshB cells decreased slightly under these conditions (Fig. 2C). Due to the high deviations of the results, however, the difference between the cysteine contents of wild-type and ΔgshB cells was not significant. In contrast, cells of the ΔgshA mutant clearly showed an increase in the cysteine content. Thus, the cellular thiol pool was influenced by cadmium.
Influence of metals on the expression of GSH biosynthesis genes.
The promoter regions of the gshA and the gshB genes were each cloned upstream of a lacZ reporter gene and inserted as a single-copy transcriptional fusion gene into the λ att site of the ΔgshA mutant strain and the corresponding wild type. In the ΔgshA background, the expression of both promoters was on a high constitutive level (data not shown). In wild-type cells, the expression of the reporter activities from both promoters increased with increasing cadmium levels (Fig. 3) or zinc or copper concentrations (data not shown). Both promoter-reporter constructs were up-regulated about 15-fold. Cadmium, therefore, induced the expression of gshA and gshB in wild-type cells, but the GSH contents in these cells declined. This finding may indicate an efflux of cadmium-glutathionato complexes or the inhibition of the enzyme reactions leading to the production of GSH, e.g., by the sequestration of sulfide or cysteine.
FIG. 3.
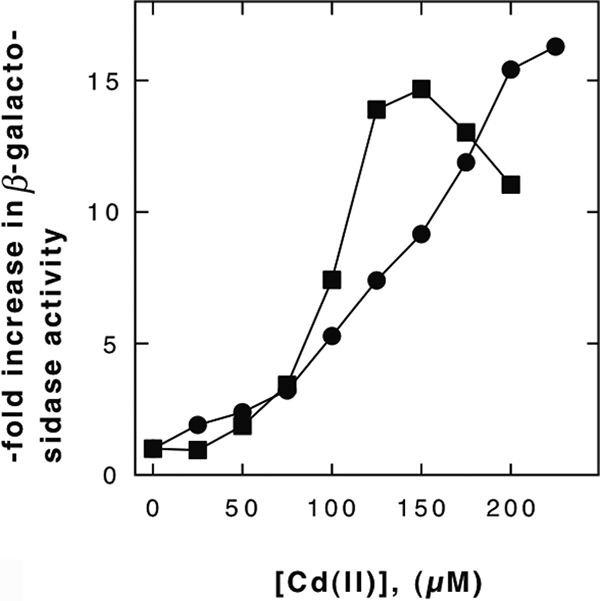
Induction of the gshAp-lacZ and gshBp-lacZ reporters by Cd(II). The promoters gshAp (squares) and gshBp (circles) were fused to the lacZ reporter gene, and the fusions were expressed as single-copy operons in strain W3110. The resulting strains were incubated for 2 h in TMM at 37°C in the presence of increasing cadmium(II) concentrations, and the specific activity of the β-galactosidase was determined and divided by the negative control activity (with no added metal). The mean values of results from three experiments are shown.
Global transcriptome response.
To test the hypothesis that Cd2+ exerts its toxic action mainly by binding to cellular sulfur, gene arrays were employed at this stage to measure the effects of cadmium on the transcriptome in the presence or absence of cellular thiols. For these experiments, cells were cultivated as described in the legend to Fig. 1 and exposed to 100 μM Cd(II) for 10 min and RNA was isolated. The gene array results were compared in three ways. First, for all three strains (the wild type and the ΔgshA and ΔgshB mutants), the Q values were calculated as the ratios of the results with Cd(II) treatment to the results without Cd(II) treatment. Second, untreated cells of the three strains were compared pairwise. The Q values were the ratios of the results for the ΔgshA and wild-type strains (indicating the effects of taking away GSH), the ΔgshB and wild-type strains (indicating the effects of changing from GSH to γEC), and the ΔgshA and ΔgshB strains (indicating the effects of taking away γEC in the absence of GSH). Third, the same comparisons were done with the gene array results for cadmium-treated cells.
For each of these nine comparisons, the Q values were marked according to their significance (Table 1; also see the supplemental material) and sorted into the corresponding metabolic groups of the KO system (26). This system groups proteins and genes into a hierarchy of four levels, starting at the highest level, level 1, with the categories “metabolism,” “genetic information processing,” “environmental information processing,” “cellular processes,” and “disease associated.” The second level contains subcategories of the level 1 categories, and so on. This grouping resulted in a list of Q values for each comparison at every KO level (see the supplemental material), which facilitated the assignment of up- or down-regulated genes to metabolic processes and cellular functions. Together with the results of earlier studies using lower (12, 55) or higher (42) Cd2+ concentrations, this work provides insight into the mechanism of action underlying cadmium toxicity in E. coli cells (as summarized in Fig. 4).
TABLE 1.
Transcriptome analysis of E. coli cells treated with cadmiuma
| Effect no. and/or descriptionb | Q value for wt cells treated with 25 μM Cd | Q value after treatment with 100 μM Cd for:
|
Q value for comparison of untreated cells of:
|
Q value for comparison of cadmium-treated cells of:
|
Gene | Gene product description | ||||||
|---|---|---|---|---|---|---|---|---|---|---|---|---|
| wt cells | ΔgshA mutant cells | ΔgshB mutant cells | ΔgshA and wt strains | ΔgshB and wt strains | ΔgshA and ΔgshB strains | ΔgshA and wt strains | ΔgshB and wt strains | ΔgshA and ΔgshB strains | ||||
| 1, Up-regulation (generally >3-fold) of genes associated with refolding of unfolded proteins, KO group 01230, including dnaKJ | 3.38 | 532.68‡ | 406.54§ | 260.66‡ | 1.18 | 1.12 | 1.05 | 0.90 | 0.55* | 1.64* | ibpB | Heat shock protein |
| 2.56 | 260.38‡ | 360.41§ | 213.79§ | 1.07 | 1.08 | 0.99 | 1.48* | 0.89* | 1.67* | ibpA | Heat shock protein | |
| 1.40 | 8.09* | 7.51* | 7.49* | 0.95 | 0.97 | 0.98 | 0.88 | 0.90 | 0.98 | clpB | Heat shock protein | |
| 1.95 | 7.82† | 11.93† | 5.83† | 0.50 | 0.98 | 0.51 | 0.76 | 0.73* | 1.05 | hslV | Heat shock protein HslVU proteasome-related peptidase subunit | |
| 1.62 | 6.19* | 8.31* | 3.07 | 0.77 | 1.10 | 0.70 | 1.03 | 0.55 | 1.90 | hslU | Heat shock protein HslVU ATPase subunit; homologous to chaperones | |
| 1.24 | 5.23 | 6.30 | 9.80* | 0.62 | 1.18 | 0.52 | 0.75 | 2.22 | 0.34 | clpA | ATP-binding component of serine protease | |
| 1.63 | 4.95† | 5.27* | 3.64* | 1.04 | 1.03 | 1.01 | 1.11 | 0.76 | 1.46 | lon | DNA-binding, ATP-dependent protease La; heat shock K protein | |
| 1.30 | 3.75* | 3.32 | 1.94 | 0.72 | 1.17 | 0.62 | 0.64 | 0.61 | 1.06 | ybbN | Putative thioredoxin-like protein | |
| 1.25 | 3.39† | 5.18† | 1.02 | 0.60* | 0.80 | 0.74 | 0.91 | 0.24† | 3.77† | mopB | GroES; 10-kDa chaperone that binds to Hsp60 in the presence of Mg-ATP; suppressor of ATPase activity | |
| 1.93 | 3.14† | 2.54* | 2.99† | 1.19 | 1.05 | 1.14 | 0.96 | 1.00 | 0.97 | yhgI | Orf hypothetical protein | |
| 1.41 | 6.60† | 9.27† | 4.45* | 0.80 | 1.10 | 0.73 | 1.12 | 0.74 | 1.51 | dnaK | Chaperone Hsp70; DNA biosynthesis protein; autoregulated heat shock protein | |
| 1.69 | 2.65* | 4.96* | 1.52 | 0.82 | 1.00 | 0.83 | 1.54 | 0.57 | 2.70* | dnaJ | Chaperone with DnaK; heat shock protein | |
| 2, Oxidative stress | 4.90 | 69.17‡ | 62.44‡ | 57.78‡ | 1.41 | 1.43 | 0.99 | 1.27 | 1.19 | 1.07 | grxA | Glutaredoxin 1 redox coenzyme for GSH-dependent ribonucleotide reductase |
| 1.08 | 0.94 | 1.31 | 0.89 | 0.79 | 0.83 | 0.96 | 1.11 | 0.78 | 1.42 | grxB | Glutaredoxin 2 | |
| 0.98 | 0.74* | 0.93 | 1.09 | 0.83 | 0.92 | 0.90 | 1.04 | 1.35* | 0.77 | grxC | Glutaredoxin 3 | |
| 1.52 | 5.29* | 7.92* | 6.54* | 1.19 | 1.24 | 0.96 | 1.78* | 1.53 | 1.16 | gor | GSH oxidoreductase | |
| 1.24 | 4.12* | 3.94* | 3.17 | 1.42 | 1.04 | 1.36 | 1.36 | 0.81 | 1.68 | gloA | Lactoylglutathione lyase | |
| 1.58 | 36.16‡ | 49.58‡ | 55.63‡ | 1.41 | 1.11 | 1.27 | 1.93* | 1.71 | 1.13 | trxC | Putative thioredoxin-like protein | |
| 0.95 | 3.35* | 3.91* | 1.99 | 1.16 | 1.19 | 0.98 | 1.36 | 0.71 | 1.92 | trxB | Thioredoxin reductase | |
| 1.10 | 1.38 | 1.32 | 1.37 | 1.26 | 0.99 | 1.27 | 1.21 | 0.98 | 1.23 | trxA | Thioredoxin 1 | |
| 4.19 | 59.62‡ | 55.26‡ | 63.28§ | 0.95 | 0.80 | 1.19 | 0.88 | 0.84* | 1.04 | katG | Catalase hydroperoxidase I(I) | |
| 2.78 | 29.34‡ | 23.86‡ | 17.75‡ | 1.09 | 1.16 | 0.94 | 0.89* | 0.70* | 1.27* | ahpF | Alkyl hydroperoxide reductase F52a subunit; involved in detoxification of hydroperoxides | |
| 2.71 | 19.88† | 19.68‡ | 11.02* | 1.13 | 1.32 | 0.86 | 1.12 | 0.73* | 1.53* | ahpC | Alkyl hydroperoxide reductase C22 subunit; involved in detoxification of hydroperoxides | |
| 3, Metabolic downshift | ||||||||||||
| F1Fo ATPase-associated changes | 0.78 | 0.63 | 0.50 | 0.72 | 0.73 | 0.90 | 0.81 | 0.58 | 1.03 | 0.57 | atpC | F1 sector epsilon subunit of membrane-bound ATP synthase |
| 0.85 | 0.58 | 0.39 | 0.56 | 1.21 | 1.10 | 1.10 | 0.82 | 1.06 | 0.77 | atpD | F1 sector beta subunit of membrane-bound ATP synthase | |
| 1.02 | 0.43* | 0.30* | 0.34* | 0.88 | 0.87 | 1.01 | 0.62 | 0.69 | 0.91 | atpG | F1 sector gamma subunit of membrane-bound ATP synthase | |
| 1.18 | 0.37* | 0.29 | 0.31 | 0.81 | 0.72 | 1.12 | 0.64 | 0.61 | 1.06 | atpA | F1 sector alpha subunit of membrane-bound ATP synthase | |
| 0.88 | 0.27† | 0.20† | 0.14† | 0.75* | 0.73* | 1.03 | 0.57 | 0.38* | 1.49 | atpH | F1 sector delta subunit of membrane-bound ATP synthase | |
| 0.86 | 0.27† | 0.25* | 0.13† | 0.67 | 1.00 | 0.66 | 0.61 | 0.50 | 1.22 | atpF | Fo sector subunit b of membrane-bound ATP synthase | |
| 1.24 | 0.27† | 0.19† | 0.11† | 1.08 | 0.91 | 1.19 | 0.74 | 0.38 | 1.93 | atpE | Fo sector subunit c of membrane-bound ATP synthase | |
| 1.22 | 0.33 | 0.14† | 0.10† | 1.78 | 1.47 | 1.21 | 0.76 | 0.43 | 1.77 | atpB | Membrane-bound ATP synthase subunit a | |
| 0.65 | 0.18* | 0.16 | 0.11* | 1.00 | 0.76 | 1.33 | 0.93 | 0.48 | 1.93 | atpI | Membrane-bound ATP synthase component; dispensable protein affecting expression of atpB | |
| Chinol oxidase-associated changes | 1.27 | 0.57 | 0.71 | 0.44 | 0.87 | 0.95 | 0.91 | 1.08 | 0.74 | 1.46 | cyoE | Protoheme IX farnesyltransferase (involved in heme O biosynthesis) |
| 1.04 | 0.56* | 0.76 | 0.42* | 0.84 | 0.94 | 0.90 | 1.14 | 0.70 | 1.62 | cyoD | Cytochrome o ubiquinol oxidase subunit IV | |
| 1.40 | 0.53* | 0.79 | 0.30 | 0.71 | 1.06 | 0.67 | 1.07 | 0.61 | 1.75 | cyoC | Cytochrome o ubiquinol oxidase subunit III | |
| 1.17 | 0.47* | 0.74* | 0.21† | 0.94 | 0.83* | 1.14 | 1.49* | 0.36* | 4.12† | cyoB | Cytochrome o ubiquinol oxidase subunit I | |
| 1.36 | 0.31* | 0.41 | 0.09† | 0.72 | 0.71 | 1.02 | 0.94 | 0.21* | 4.37* | cyoA | Cytochrome o ubiquinol oxidase subunit II | |
| Ribosome-associated changes (>3-fold down-regulation) | 1.17 | 0.26* | 0.33* | 0.12† | 1.19 | 1.03 | 1.16 | 1.51 | 0.47 | 3.20 | rpsP | 30S ribosomal subunit protein S16 |
| 1.06 | 0.28* | 0.40* | 0.21* | 1.23 | 1.27 | 0.97 | 1.79 | 0.96 | 1.87 | rplF | 50S ribosomal subunit protein L6 | |
| 0.99 | 0.29* | 0.24* | 0.10† | 1.33 | 1.14 | 1.17 | 1.12 | 0.38 | 2.95 | rplK | 50S ribosomal subunit protein L11 | |
| 2.06 | 0.29* | 0.21* | 0.14* | 1.32 | 0.86 | 1.53 | 0.93 | 0.42 | 2.23 | rpsF | 30S ribosomal subunit protein S6 | |
| 1.02 | 0.30* | 0.35* | 0.14* | 1.21 | 0.84 | 1.43 | 1.41 | 0.38 | 3.71 | rplM | 50S ribosomal subunit protein L13 | |
| 1.38 | 0.30* | 0.39* | 0.20* | 1.15 | 1.06 | 1.08 | 1.46 | 0.71 | 2.05 | rplR | 50S ribosomal subunit protein L18 | |
| 1.22 | 0.30* | 0.26* | 0.09† | 1.41 | 0.95 | 1.48 | 1.22 | 0.28 | 4.41 | rpmH | 50S ribosomal subunit protein L34 | |
| 1.17 | 0.31* | 0.51 | 0.24* | 0.95 | 0.94 | 1.01 | 1.58 | 0.72 | 2.19 | rplN | 50S ribosomal subunit protein L14 | |
| 1.50 | 0.32* | 0.39* | 0.16† | 1.24* | 1.10 | 1.13 | 1.52 | 0.55 | 2.74 | rpsJ | 30S ribosomal subunit protein S10 | |
| 1.03 | 0.32 | 0.74 | 0.26* | 0.77 | 1.21 | 0.63 | 1.78 | 0.99 | 1.80 | rplN-r | 50S ribosomal subunit protein L14 | |
| 1.23 | 0.32† | 0.34† | 0.17† | 1.03 | 0.90 | 1.14* | 1.09 | 0.49 | 2.21 | rpsN | 30S ribosomal subunit protein S14 | |
| 1.33 | 0.33† | 0.43* | 0.22* | 0.84 | 0.56* | 1.49* | 1.10 | 0.39* | 2.86 | rplX | 50S ribosomal subunit protein L24 | |
| 1.61 | 0.33† | 0.37* | 0.18† | 0.97 | 0.94 | 1.03 | 1.08 | 0.50 | 2.15 | rplE | 50S ribosomal subunit protein L5 | |
| 1.34 | 0.33† | 0.41* | 0.22† | 0.90 | 0.84* | 1.08 | 1.13 | 0.56 | 2.01 | rpsH | 30S ribosomal subunit protein S8 and regulator | |
| 4, Up-regulation of tryptophan biosynthesis | 2.59 | 4.01* | 5.25* | 0.95 | 0.71 | 0.73 | 0.97 | 0.92 | 0.17* | 5.39* | trpA | Tryptophan synthase alpha protein |
| 4.37 | 3.98* | 9.70† | 0.94 | 0.53 | 0.74 | 0.72 | 1.28 | 0.17† | 7.36† | trpB | Tryptophan synthase beta protein | |
| 3.17 | 4.65* | 9.75* | 0.85 | 0.69 | 0.74 | 0.93 | 1.44 | 0.14* | 10.63* | trpC | N-(5-Phosphoribosyl) anthranilate isomerase/indole-3-glycerolphosphate synthase | |
| 2.42 | 9.07† | 20.55† | 0.21 | 0.39 | 0.58 | 0.66 | 0.88 | 0.01‡ | 65.62† | trpD | Anthranilate synthase component II | |
| 1.75 | 9.17† | 32.63† | 0.19 | 0.25 | 0.38 | 0.65 | 0.88 | 0.01‡ | 112.92‡ | trpE | Anthranilate synthase component I | |
| 1.20 | 7.60 | 11.47* | 0.39 | 1.21 | 1.11 | 1.09 | 1.82 | 0.06* | 31.85* | trpL | trp operon leader peptide | |
| 0.64 | 0.88 | 1.10 | 0.94 | 1.37 | 1.15 | 1.20 | 1.72 | 1.22 | 1.41 | trpS | Tryptophan tRNA synthetase | |
| 0.84 | 0.72 | 1.16 | 0.71 | 1.36 | 0.93 | 1.46 | 2.19 | 0.91 | 2.40 | trpR | Regulator of trp operon and aroH; trp aporepressor | |
| 1.04 | 5.03* | 8.93* | 0.48 | 0.75 | 0.83 | 0.90 | 1.33* | 0.08* | 16.79* | mtr | Tryptophan-specific transport protein | |
| 1.39 | 0.08* | 0.18 | 0.15* | 0.69 | 0.96 | 0.71 | 1.60 | 1.83 | 0.87 | tnaA | Tryptophanase | |
| 5, Up-regulation (generally >2-fold) of genes involved in sulfur metabolism, including fliY | 2.00 | 24.98† | 33.87† | 31.21† | 1.54 | 1.18 | 1.30 | 2.09 | 1.48 | 1.41 | cbl | Transcriptional regulator of cys regulon; accessory protein affecting cysM |
| 4.04 | 22.17‡ | 17.07† | 8.68* | 1.24 | 1.17 | 1.06 | 0.95 | 0.46* | 2.08* | cysP | Thiosulfate-binding protein | |
| 3.41 | 15.94† | 14.80† | 13.98‡ | 1.32 | 1.64 | 0.81 | 1.23 | 1.44* | 0.85 | cysN | ATP-sulfurylase (ATP:sulfate adenylyltransferase); probably a GTPase | |
| 4.65 | 14.15† | 8.59† | 8.93† | 1.51 | 1.95 | 0.78 | 0.92 | 1.23 | 0.75* | cysU | Sulfate-thiosulfate transport system permease T protein | |
| 4.56 | 13.18† | 14.79† | 11.03† | 0.75 | 1.27 | 0.59 | 0.84 | 1.06 | 0.79 | cysJ | Sulfite reductase (NADPH); flavoprotein beta subunit | |
| 4.52 | 12.71‡ | 16.06† | 11.26‡ | 1.04 | 1.16 | 0.90 | 1.32* | 1.03 | 1.28* | cysD | ATP:sulfurylase (ATP:sulfate adenylyltransferase) subunit 2 | |
| 5.07 | 12.63‡ | 19.83† | 8.17* | 0.97 | 1.24 | 0.78 | 1.52* | 0.80 | 1.90* | cysH | 3′-Phosphoadenosine-5′-phosphosulfate reductase | |
| 5.02 | 9.98* | 6.73* | 9.11* | 0.84 | 1.27 | 0.66 | 0.56 | 1.16 | 0.48 | cysC | APS kinase | |
| 3.39 | 9.74† | 6.80* | 7.31† | 0.85 | 1.30 | 0.65 | 0.59 | 0.98 | 0.61 | cysW | Sulfate transport system permease W protein | |
| 3.28 | 8.57* | 9.96* | 7.07* | 0.91 | 1.32 | 0.69 | 1.06 | 1.09 | 0.98 | cysI | Sulfite reductase alpha subunit | |
| 2.86 | 8.01* | 5.42* | 5.55* | 0.91 | 1.03 | 0.88 | 0.62 | 0.71 | 0.86 | cysA | ATP-binding component of sulfate permease A protein; involved in chromate resistance | |
| 3.26 | 4.80* | 3.97* | 2.64* | 0.95 | 1.28 | 0.74 | 0.79 | 0.71 | 1.12 | cysM | Cysteine synthase B; O-acetylserine sulfhydrolase B | |
| 2.63 | 3.85* | 5.55* | 1.95 | 0.78 | 1.38 | 0.57 | 1.13 | 0.70 | 1.61 | cysK | Cysteine synthase A; O-acetylserine sulfhydrolase A | |
| 1.72 | 2.42 | 2.50 | 1.44 | 1.24 | 1.17 | 1.06 | 1.28 | 0.69 | 1.85 | cysB | Positive transcriptional regulator of cysteine regulon | |
| 2.10 | 9.20 | 30.28* | 78.72‡ | 1.83 | 1.26 | 1.46 | 6.02* | 10.74† | 0.56 | tauA | Taurine transport system periplasmic protein | |
| 1.96 | 5.16 | 13.45 | 47.14† | 1.50 | 1.30 | 1.15 | 3.91 | 11.89* | 0.33 | tauB | Taurine ATP-binding component of a transport system | |
| 0.85 | 0.91 | 2.77 | 5.27* | 1.13 | 1.23 | 0.92 | 3.45 | 7.11* | 0.48 | tauC | Taurine transport system permease protein | |
| 1.50 | 3.20 | 16.82* | 24.50* | 1.57 | 1.63 | 0.96 | 8.23* | 12.45* | 0.66 | tauD | Taurine dioxygenase; 2-oxoglutarate dependent | |
| 4.74 | 14.17‡ | 10.66† | 14.83‡ | 0.69 | 0.93 | 0.74 | 0.52† | 0.97 | 0.53* | fliY | Putative periplasmic binding transport protein | |
| 6, Changes in iron metabolism | 0.52 | 0.09* | 0.26 | 0.42 | 0.59 | 0.49 | 1.21 | 1.69 | 2.30 | 0.74 | fhuF | Orf hypothetical protein |
| 0.55 | 0.12 | 0.27 | 0.53 | 0.82 | 0.60 | 1.36 | 1.78 | 2.55 | 0.70 | fhuC | ATP-binding component of hydroxymate-dependent iron transport system | |
| 0.56 | 0.13 | 0.20 | 0.51 | 0.73 | 0.51 | 1.43 | 1.13 | 1.99 | 0.57 | fhuA | Outer membrane protein receptor for ferrichrome, colicin M, and phages | |
| 0.47 | 0.16 | 0.30 | 0.27 | 0.79 | 0.65 | 1.21 | 1.53 | 1.14 | 1.34 | entE | 2,3-Dihydroxybenzoate-AMP ligase | |
| 0.36 | 0.18 | 0.18 | 0.21 | 0.81 | 0.40 | 2.02 | 0.83 | 0.49 | 1.70 | entA | 2,3-Dihydro-2,3-dihydroxybenzoate dehydrogenase; involved in enterochelin biosynthesis | |
| 0.71 | 0.12 | 0.15 | 0.29 | 1.25 | 0.92 | 1.36 | 1.57 | 2.25 | 0.70 | fecI | Probable RNA polymerase sigma factor | |
| 0.68 | 2.91* | 2.09 | 2.85* | 1.73 | 1.29 | 1.34 | 1.24 | 1.26 | 0.98 | fur | Negative regulator | |
| 11.84 | 12.45‡ | 7.58† | 2.35* | 1.18 | 3.52* | 0.33* | 0.72* | 0.66* | 1.08 | ftn | Cytoplasmic ferritin (an iron storage protein) | |
| 3.32 | 15.84‡ | 15.59‡ | 11.61§ | 0.41* | 0.84 | 0.49* | 0.41† | 0.61† | 0.66* | dps | Global regulator under starvation conditions | |
| 1.26 | 18.87† | 18.75† | 13.95† | 1.05 | 0.92 | 1.14 | 1.04 | 0.68 | 1.53 | hemH | Ferrochelatase; final enzyme of heme biosynthesis | |
| 1.46 | 0.91 | 1.66 | 2.20* | 0.41* | 0.94 | 0.43 | 0.75* | 2.27* | 0.33* | bfr | Bacterioferrin, an iron storage homoprotein | |
| 7, Induction of ars | 2.74 | 11.60‡ | 24.74‡ | 11.77‡ | 0.60 | 1.03 | 0.58 | 1.28* | 1.05 | 1.22* | arsC | Arsenate reductase |
| 2.32 | 7.93* | 13.44† | 5.68* | 0.88 | 1.12 | 0.79 | 1.49 | 0.80 | 1.87 | arsB | Arsenic pump membrane protein | |
| 1.29 | 4.49* | 7.32* | 6.66* | 0.95 | 1.24 | 0.77 | 1.55 | 1.84 | 0.85 | arsR | Transcriptional repressor of chromosomal ars operon | |
| 8, Up-regulation (>2-fold) of genes involved in replication and DNA repair | 3.98 | 24.97‡ | 41.54‡ | 12.29† | 1.53 | 1.30 | 1.18 | 2.55† | 0.64* | 3.99† | marR | Multiple-antibiotic resistance protein; repressor of mar operon |
| 2.54 | 11.62† | 12.79† | 25.16‡ | 4.92* | 3.95* | 1.24 | 5.41† | 8.56‡ | 0.63* | yqhD | Putative oxidoreductase | |
| 0.71 | 9.42* | 4.88 | 11.62* | 0.92 | 1.10 | 0.83 | 0.47 | 1.36 | 0.35 | polB | DNA polymerase II | |
| 1.00 | 5.21* | 8.13* | 2.35 | 0.99 | 0.77 | 1.29 | 1.55 | 0.35* | 4.45* | xthA | Exonuclease III | |
| 1.02 | 3.24 | 4.45 | 2.35 | 1.46 | 1.29 | 1.13 | 2.01 | 0.94 | 2.14 | ruvB | Holliday junction helicase subunit A; involved in branch migration and repair | |
| 1.05 | 2.22 | 3.53 | 3.41* | 1.18 | 1.11 | 1.06 | 1.88 | 1.71 | 1.10 | dnaG | Involved in DNA biosynthesis; DNA primase | |
| 0.64 | 2.12 | 1.71 | 1.24 | 1.86 | 1.52 | 1.22 | 1.49 | 0.89 | 1.68 | cspI | Cold shock protein-like protein | |
| 1.16 | 2.06 | 1.60 | 1.11 | 1.05 | 1.00 | 1.05 | 0.82 | 0.54 | 1.51 | mfd | Transcription-repair-coupling factor; involved in decline of mutation frequency | |
| 9, Up-regulation of zntA | 7.66 | 9.51* | 9.62* | 12.28* | 1.57 | 1.39 | 1.13 | 1.59 | 1.80 | 0.88 | zntA | Zinc-transporting ATPase |
| 10, Changes associated with iron-sulfur proteins and their synthesis | 0.85 | 1.39 | 1.04 | 1.19 | 0.84 | 0.89 | 0.95 | 0.63 | 0.76 | 0.83 | acnB | Aconitate hydrase B |
| 1.80 | 5.29* | 8.47* | 9.83* | 0.76 | 0.89 | 0.85 | 1.21 | 1.65 | 0.73 | acnA | Aconitate hydrase 1 | |
| 1.31 | 5.83* | 12.28* | 5.30 | 1.04 | 0.98 | 1.06 | 2.18 | 0.89 | 2.46 | fumC | Fumarase C/fumarate hydratase class II; isozyme | |
| 0.69 | 0.46 | 0.57 | 0.41 | 0.91 | 1.13 | 0.80 | 1.13 | 1.01 | 1.12 | fumA | Fumarase A/fumarate hydratase class I; aerobic isozyme | |
| 0.31 | 0.74 | 0.75 | 0.80 | 0.74 | 1.00 | 0.74 | 0.75 | 1.07 | 0.70 | fumB | Fumarase B/fumarate hydratase class I; anaerobic isozyme | |
| 1.57 | 4.04 | 1.76 | 4.40 | 1.09 | 1.17 | 0.94 | 0.48 | 1.27 | 0.38 | soxR | Redox-sensing activator of soxS | |
| 1.40 | 2.13* | 5.71* | 1.47 | 0.81 | 0.72 | 1.12 | 2.17* | 0.50 | 4.35* | soxS | Regulator of superoxide response regulon | |
| 3.87 | 4.75† | 3.19* | 4.30† | 1.44 | 1.04 | 1.39 | 0.97 | 0.94 | 1.04 | b2531 | iscR, IscR transcriptional dual regulator | |
| 5.03 | 3.69† | 2.61* | 3.10† | 1.04 | 0.97 | 1.08 | 0.74* | 0.81* | 0.91 | yfhO | iscS cysteine desulfurase | |
| 3.70 | 3.64† | 2.40* | 3.34† | 1.28 | 0.88 | 1.45 | 0.84 | 0.81* | 1.04 | b2529 | iscU scaffold protein involved in iron-sulfur cluster assembly | |
| 3.25 | 3.31* | 2.60* | 3.38† | 1.26 | 1.05 | 1.20 | 0.99 | 1.07 | 0.92 | yfhF | iscA iron-sulfur cluster assembly protein | |
| 11, Up-regulation of formaldehyde and methylglyoxal detoxification | 1.55 | 13.99† | 1.00 | 1.27* | 19.30† | 27.52† | 0.70* | 1.38 | 2.50† | 0.55* | adhC | Alcohol dehydrogenase class III; formaldehyde dehydrogenase; GSH-dependent FrmA |
| 1.25 | 15.39‡ | 0.92 | 1.21 | 24.71‡ | 26.08† | 0.95 | 1.47* | 2.04* | 0.72* | yaiN | Putative alpha helix chain; FrmR | |
| 1.24 | 4.12* | 3.94* | 3.17 | 1.42 | 1.04 | 1.36 | 1.36 | 0.81 | 1.68 | gloA | Lactoylglutathione lyase | |
| 12, Up-regulation of genes involved in cofactor biosynthesis | 1.03 | 3.65* | 3.32* | 2.32* | 1.06 | 0.93 | 1.14 | 0.97 | 0.59* | 1.62 | folE | GTP cyclohydrolase I |
| 1.26 | 18.87† | 18.75† | 13.95† | 1.05 | 0.92 | 1.14 | 1.04 | 0.68 | 1.53 | hemH | Ferrochelatase; final enzyme of heme biosynthesis | |
| 2.86 | 2.28 | 2.76 | 2.26 | 1.89 | 1.25 | 1.51 | 2.28* | 1.23 | 1.85 | thiC | Involved in thiamine biosynthesis; pyrimidine moiety | |
| 4.55 | 3.39 | 1.67 | 1.73 | 4.83* | 2.40 | 2.02 | 2.38 | 1.22 | 1.94 | bioB | Involved in biotin synthesis and sulfur insertion?7 | |
| Various changes in unassigned genes (up-regulation of >15-fold or down-regulation of >10-fold) | 25.19 | 456.79‡ | 231.15§ | 329.18¶ | 0.68 | 1.19 | 0.57 | 0.34† | 0.86* | 0.40† | ycfR | Orf hypothetical protein |
| 2.35 | 42.68‡ | 111.82‡ | 82.46‡ | 0.69 | 0.85 | 0.81 | 1.80* | 1.64* | 1.10 | yjgH | Orf hypothetical protein | |
| 1.78 | 38.50† | 49.72† | 64.58† | 1.36 | 1.16 | 1.18 | 1.76 | 1.94 | 0.91 | b1758 | Putative cytochrome oxidase | |
| 0.49 | 37.43† | 53.21‡ | 25.22† | 1.46 | 1.69 | 0.86 | 2.07* | 1.14 | 1.82* | yjgI | Putative oxidoreductase | |
| 4.81 | 31.82† | 44.37‡ | 13.44† | 1.80 | 1.69 | 1.07 | 2.51* | 0.71 | 3.52† | marA | Involved in resistance to multiple antibiotics; transcriptional activator of defense systems | |
| 2.00 | 24.98† | 33.87† | 31.21† | 1.54 | 1.18 | 1.30 | 2.09 | 1.48 | 1.41 | cbl | Transcriptional regulator of cys regulon; accessory of regulatory circuit affecting cysM | |
| 4.88 | 19.62‡ | 16.17‡ | 10.92† | 1.30 | 1.14 | 1.14 | 1.07 | 0.64* | 1.68* | yeeE | Putative transport system permease protein | |
| 1.35 | 17.12† | 23.20† | 9.38* | 1.25 | 1.42 | 0.88 | 1.70* | 0.78 | 2.18* | yaaA | Orf hypothetical protein | |
| 0.61 | 0.05* | 0.07* | 0.06 | 1.08 | 0.90 | 1.21 | 1.40 | 1.06 | 1.32 | ybaN | Product of putative gene 58 | |
| 1.08 | 0.07 | 0.67 | 0.50 | 1.04 | 1.16 | 0.90 | 10.37 | 8.56 | 1.21 | gntU_1 | Low-affinity gluconate transport permease protein; interrupted | |
| 0.60 | 0.07 | 0.13 | 0.20 | 0.83 | 0.63 | 1.32 | 1.50 | 1.72 | 0.88 | b1016 | Orf hypothetical protein | |
| 0.40 | 0.08* | 0.37 | 0.22 | 0.30 | 0.68 | 0.45 | 1.40 | 1.86 | 0.75 | yhiE | Orf hypothetical protein | |
| 0.52 | 0.09* | 0.26 | 0.42 | 0.59 | 0.49 | 1.21 | 1.69 | 2.30 | 0.74 | fhuF | Orf hypothetical protein | |
| 0.26 | 0.10* | 0.14* | 0.12 | 0.59 | 0.27* | 2.21 | 0.86 | 0.31 | 2.74 | b1452 | Putative receptor | |
| Changes in transcription | 0.87 | 0.63 | 0.38* | 0.28* | 1.43 | 1.15 | 1.24 | 0.84 | 0.51 | 1.67 | rpoA | RNA polymerase alpha subunit |
| 0.87 | 0.78 | 0.72 | 0.71 | 1.34 | 1.39 | 0.97 | 1.22 | 1.25 | 0.98 | rpoB | RNA polymerase beta subunit | |
| 1.19 | 1.13 | 0.98 | 1.22 | 1.46 | 1.17 | 1.25 | 1.26 | 1.25 | 1.01 | rpoC | RNA polymerase beta prime subunit | |
| 1.21 | 1.42 | 0.82 | 0.68 | 0.17 | 0.16 | 1.04 | 0.10 | 0.08 | 1.25 | rpoD | RNA polymerase sigma 70 factor; involved in regulation of proteins induced at high temperatures | |
| 0.76 | 0.77 | 2.40 | 3.16 | 0.92 | 0.95 | 0.97 | 2.85 | 3.88* | 0.73 | rpoE | RNA polymerase sigma-E factor; involved in response to heat shock and oxidative stress | |
| 1.01 | 1.47 | 2.36 | 1.26 | 0.83 | 0.69 | 1.20 | 1.33 | 0.59 | 2.26 | rpoH | RNA polymerase sigma 32 factor; involved in regulation of proteins induced at high temperatures | |
| 1.24 | 1.22 | 1.61 | 2.52* | 0.78 | 0.99 | 0.78 | 1.03 | 2.05* | 0.50* | rpoN | RNA polymerase sigma (54 or 60) factor; involved in nitrogen and fermentation regulation | |
| 0.85 | 1.27 | 1.34 | 2.45* | 0.67 | 0.92 | 0.73 | 0.71 | 1.79 | 0.40* | rpoS | RNA polymerase sigma S (sigma 38) factor; involved in synthesis of many growth phase-related proteins | |
| 0.23 | 0.14* | 0.13* | 0.14* | 0.91 | 0.95 | 0.95 | 0.88 | 1.00 | 0.88 | fliA | Involved in flagellar biosynthesis; alternative sigma factor 28; regulator of flagellar operons | |
| 0.71 | 0.12 | 0.15 | 0.29 | 1.25 | 0.92 | 1.36 | 1.57 | 2.25 | 0.70 | fecI | Probable RNA polymerase sigma factor | |
| 0.96 | 0.65 | 0.68 | 0.25* | 0.89 | 0.68 | 1.30 | 0.94 | 0.27 | 3.50 | nusB | Involved in transcription termination; L factor | |
| 1.10 | 0.62 | 0.50* | 0.55 | 1.18 | 1.11 | 1.06 | 0.94 | 0.98 | 0.96 | nusA | Involved in transcription pausing; L factor | |
| 1.74 | 0.47 | 0.52 | 0.24* | 1.46 | 1.27 | 1.15 | 1.62 | 0.66 | 2.45* | nusG | Component of transcription antitermination system | |
These gene array results are an excerpt from the full table provided in the supplemental material. Given are the Q values, the quotients of the mean gene-specific expression signal values under one set of conditions divided by the signal values for the same genes under another set of conditions (see below). Gene signal values for wild-type (wt), ΔgshA, and ΔgshB cells treated with 100 μM cadmium for 10 min were divided by the signal values for the corresponding untreated cells. For better comparison, Q values obtained for wild-type cells treated with a lower cadmium concentration (25 μM) are provided. These values have been published previously (12). Moreover, the gene expression signal values for ΔgshA and wild-type, ΔgshB and wild-type, and ΔgshA and ΔgshB cells treated with cadmium or left untreated were also compared. In these cases, the Q values are the ratios of the mean expression signal values for the two strains under the respective condition. To obtain the Q values, three independent experiments were performed for each condition (cadmium and no cadmium treatment) and all three strains, including three independent cultivations and a dye swap. All results were normalized to a proxy number of 3,880 gene-specific mRNA signals per cell and used to calculate the mean expression signal value and the standard deviation. Boldfaced Q values are significant. (The level of significance was defined by the difference in the two mean expression signal values divided by the sum of the two standard deviations. The level of significance was <−1 for Q values showing significant down-regulation, and the level of significance was >1 for Q values indicating significant up-regulation.) To score and rank Q values, a score was calculated as the product of the Q value, the level of significance, and the higher of the two mean expression signal values. Thus, high scores indicate significant Q values associated with high-level expression under one or more conditions tested. The Q values are marked to indicate the scores as follows: ‡, <−1,000; †, <−100; *, <−10; not marked, <−1; underlined, between −1 and 1; not marked, >1; *, >10; †, >100; ‡, >1,000; §, >10,000; and ¶, >100,000.
Effects on wild-type cadmium-treated cells are listed; effects on other cell types and under other conditions were sometimes different, as indicated by the data presented.
FIG. 4.

Road map of cadmium-mediated toxicity in E. coli. The inhibitory effect of Cd2+ as demonstrated by a global transcriptome analysis is shown. Closed-headed arrows indicate biochemical reaction or synthesis routes, and open-headed arrows indicate activations. Thin dashed black lines with crosses show inhibitions, and a thick dashed line with a cross represents cadmium efflux catalyzed by ZntA. ROS is reactive oxygen species, NMeTrp is N-methyltryptophan, HyMeγEC is hydroxymethyl-γEC, CH2O is formaldehyde, HCOOH is formiate, TCC is tricarboxylic acid cycle, OAcSer is O-acetyl-l-serine, SoxRred is reduced SoxR, and SoxRox is oxidized SoxR. Hypothetical connections are marked with a question mark. Please refer to Discussion for references and details.
First, the impact of cadmium and/or the variation of the cellular thiol content on the transcriptome of E. coli was evaluated by comparing the Q values corresponding to the various KO groups (data not shown). Here, (i) cadmium treatment had similarly strong impacts on all three bacterial strains, affecting also the same KO metabolic group, “genetic information processing,” in all three strains. (ii) In cadmium-treated cells, the loss of γEC in the absence of GSH (examined by the ΔgshA mutant-ΔgshB mutant comparison) had a stronger impact than the other two changes. (iii) In untreated cells, the loss of γEC in the absence of GSH had almost no effect, and the other two alterations had only small impacts.
The gene array results were validated by qRT-PCR analyses of selected genes (Table 2). Q values obtained by qRT-PCR verified a lack of change in gene regulation or the up-regulation or down-regulation of genes as indicated by the microarray (Table 2). The biases of regulation obtained by the two methods were similar, but the magnitudes varied. Usually, qRT-PCR data are more sensitive and indicate a greater change in regulation, as we observed previously (10). For only two genes tested, either the up-regulation indicated by the microarray could not be verified by qRT-PCR (msbA) or qRT-PCR indicated down-regulation that was not observed by using the microarray (yoiI). Altogether, the microarray data could be verified by the independent method.
TABLE 2.
Verification of microarray data by quantitative real-time RT-PCR analysisa
| Gene | Q value after treatment with 100 μM Cd for:
|
Q value for comparison of untreated cells of:
|
Q value for comparison of cadmium-treated cells of:
|
|||||||||||||||
|---|---|---|---|---|---|---|---|---|---|---|---|---|---|---|---|---|---|---|
| wt cells
|
ΔgshA mutant cells
|
ΔgshB mutant cells
|
ΔgshA and wt strains
|
ΔgshB and wt strains
|
ΔgshA and ΔgshB strains
|
ΔgshA and wt strains
|
ΔgshB and wt strains
|
ΔgshA andΔgshB strains
|
||||||||||
| qRT-PCR | Microarray | qRT-PCR | Microarray | qRT-PCR | Microarray | qRT-PCR | Microarray | qRT-PCR | Microarray | qRT-PCR | Microarray | qRT-PCR | Microarray | qRT-PCR | Microarray | qRT-PCR | Microarray | |
| gshA | 2.93 ± 0.5 | 1.39 | NA | NA | 1.03 ± 0.91 | 1.55 | NA | NA | 1.31 ± 0.26 | 0.93 | NA | NA | NA | NA | 0.69 ± 0.41 | 1.03 | NA | NA |
| ompF | 0.78 ± 0.19 | 0.36 | 0.59 ± 0.25 | 0.40 | 0.32 ± 0.19 | 0.21 | 1.63 ± 1.32 | 1.09 | 1.17 ± 0.63 | 0.87 | 1.39 ± 0.66 | 1.25 | 1.46 ± 1.34 | 1.24 | 0.41 ± 0.24 | 0.53 | 3.2 ± 1.91 | 2.36 |
| cysP | 28.2 ± 7.00 | 22.2 | 55.2 ± 75.6 | 17.1 | 6.59 ± 2.75 | 8.7 | 1.53 ± 1.27 | 1.24 | 2.36 ± 0.99 | 1.17 | 0.55 ± 0.45 | 1.06 | 0.80 ± 0.48 | 0.95 | 0.51 ± 0.13 | 0.46 | 1.46 ± 0.67 | 2.08 |
| gshB | 3.70 ± 0.28 | 1.65 | 2.61 ± 0.85 | 2.04 | NA | NA | 1.32 ± 0.71 | 0.93 | NA | NA | NA | NA | 0.94 ± 0.51 | 1.14 | NA | NA | NA | NA |
| msbA | 1.34 ± 0.32 | 12.0 | 1.00 ± 0.25 | 10.7 | 1.54 ± 2.01 | 13.2 | 1.66 ± 0.20 | 1.35 | 1.78 ± 0.52 | 1.22 | 3.96 ± 5.24 | 1.11 | 1.26 ± 0.35 | 1.21 | 0.55 ± 0.26 | 1.34 | 2.58 ± 1.05 | 0.90 |
| yojI | 0.09 ± 0.03 | 0.72 | 0.04 ± 0.01 | 0.74 | 0.13 ± 0.11 | 0.68 | 1.67 ± 0.78 | 1.33 | 0.91 ± 0.44 | 1.21 | 1.98 ± 1.08 | 1.10 | 0.68 ± 0.30 | 1.36 | 1.01 ± 0.44 | 1.15 | 0.68 ± 0.17 | 1.19 |
| yeeX | 1.76 ± 1.48 | 0.85 | 1.02 ± 0.38 | 0.87 | 1.70 ± 0.30 | 1.29 | 1.50 ± 0.96 | 0.98 | 1.67 ± 1.63 | 1.64 | 1.15 ± 0.37 | 0.60 | 1.29 ± 1.12 | 1.01 | 1.62 ± 0.73 | 2.49 | 0.70 ± 0.39 | 0.40 |
| yeeE | 24.0 ± 10.7 | 19.6 | 89.7 ± 134 | 16.2 | 6.56 ± 1.73 | 10.9 | 2.00 ± 1.75 | 1.30 | 1.95 ± 0.62 | 1.14 | 0.92 ± 0.85 | 1.14 | 1.52 ± 1.04 | 1.07 | 0.57 ± 0.23 | 0.64 | 2.42 ± 0.93 | 1.68 |
| feoA | 0.07 ± 0.02 | 0.03 | 0.07 ± 0.02 | 0.12 | 0.16 ± 0.08 | 0.13 | 0.81 ± 0.36 | 0.44 | 0.78 ± 0.35 | 0.32 | 1.04 ± 0.19 | 1.36 | 0.79 ± 0.33 | 1.50 | 1.74 ± 0.79 | 1.26 | 0.46 ± 0.11 | 1.19 |
| adhC (frmA) | 17.3 ± 6.77 | 14.0 | 0.98 ± 0.24 | 1.00 | 0.94 ± 0.51 | 1.27 | 27.9 ± 10.8 | 19.3 | 43.8 ± 22.1 | 25.5 | 0.68 ± 0.13 | 0.70 | 1.88 ± 1.44 | 1.38 | 2.14 ± 0.70 | 2.50 | 0.81 ± 0.38 | 0.55 |
| marA | 36.4 ± 16.0 | 31.8 | 42.5 ± 17.3 | 44.4 | 10.8 ± 0.58 | 13.4 | 1.86 ± 1.27 | 1.80 | 1.84 ± 0.78 | 1.69 | 1.02 ± 0.58 | 1.07 | 2.23 ± 1.41 | 2.51 | 0.65 ± 0.41 | 0.71 | 3.42 ± 0.2 | 3.52 |
| ycfR (frmR) | 397 ± 212 | 457 | 192 ± 79.4 | 231 | 354 ± 37.6 | 329 | 2.50 ± 0.90 | 0.68 | 1.83 ± 0.85 | 1.19 | 1.45 ± 0.26 | 0.57 | 1.26 ± 0.44 | 0.34 | 1.93 ± 1.49 | 0.86 | 0.82 ± 0.4 | 0.40 |
| trpA | 5.56* | 4.01 | 5.15 ± 5.61 | 5.25 | 1.54 ± 0.85 | 0.95 | 1.36 ± 0.73 | 0.71 | 1.53 ± 0.98 | 0.73 | 1.02 ± 0.33 | 0.97 | 0.87* | 0.92 | 0.41* | 0.17 | 4.26 ± 5.02 | 5.39 |
| trpC | 7.07* | 4.65 | 11.0 ± 9.00 | 9.75 | 2.07 ± 2.42 | 0.85 | 1.09 ± 0.72 | 0.69 | 1.81 ± 1.32 | 0.74 | 0.68 ± 0.18 | 0.93 | 1.17* | 1.44 | 0.37* | 0.14 | 11.0 ± 15.1 | 10.63 |
| trpE | 7.88* | 9.17 | 32.5 ± 19.7 | 32.63 | 0.4 ± 0.32 | 0.19 | 0.78 ± 0.62 | 0.25 | 0.97 ± 0.81 | 0.38 | 0.86 ± 0.09 | 0.65 | 1.39* | 0.88 | 0.05* | 0.01 | 103 ± 101 | 113 |
The results of three independent qRT-PCR experiments (normalized by using rpoZ) are shown with standard deviations (an asterisk indicates the mean value obtained from two determinations). NA, not applicable.
Cadmium treatment of wild-type cells.
To acquire more insights into the metabolic effect of a cadmium shock on wild-type cells (Table 1), the regulatory ups and downs for the genes in the level 2 KO categories were analyzed (data not shown). The strengths of the responses of the genes declined in order from those of the genes in the category “protein folding, sorting, and degradation” to those of the genes in the categories “amino acid metabolism,” “membrane transport,” “cell motility,” “replication and repair,” and “energy metabolism,” and small responses of genes in eight additional metabolic groups were observed. The respective genes were identified and could be assigned to specific effects that resulted from cadmium treatment of wild-type cells, as follows (data are summarized in Table 1; the full table is provided in the supplemental material).
Effect 1 (the strongest), the up-regulation of a variety of genes that encode factors required for the refolding of unfolded proteins or their degradation, e.g., IpbAB, HslUV, ClpAB, DnaKJ, and MopAB. This effect indicates that the strongest result of a cadmium shock was an increase in the number of damaged proteins.
Effect 2, the up-regulation of genes encoding proteins to repair disulfide bonds in proteins (glutaredoxin 1 [GrxA], the GSH oxidoreductase Gor, and the thioredoxin reductase TrxB) or proteins that detoxify increased amounts of hydrogen peroxide (the catalase hydroperoxidase I, or KatG, and alkyl hydroperoxidase AhpCF).
Effect 3, a general downshift in energy conservation (shown in Table 1 for F1Fo ATPase, cytochrome o oxidase, and some ribosomal genes; for other data, see the supplemental material).
Effect 4, the up-regulation of tryptophan biosynthesis and uptake and the down-regulation of tryptophanase TnaA, indicating Trp starvation under cadmium stress. This unexpected result was also shown with real time RT-PCR (Table 2).
Effect 5, the up-regulation of most genes involved in the uptake or assimilation of sulfur compounds, including the gene for FliY, a periplasmic protein that may bind cystine (8).
Effect 6, decreased iron uptake but increased iron storage.
Effect 7, the induction of the chromosomal ars determinant for the detoxification of arsenate.
Effect 8, the up-regulation of MarR, the repressor of the mar operon involved in multiple-drug resistance, and the up-regulation of PolB and DnaG, indicating trouble with DNA replication.
Effect 9, the up-regulation of ZntA, the P-type ATPase that exports and detoxifies Cd2+.
Effect 10, changes associated with important proteins that contain iron-sulfur clusters. Aconitase A (AcnA) and fumarase C (FumC) were up-regulated, as was the SoxRS system, which triggers the cellular response to superoxide stress and controls a variety of other genes. SoxR is also an iron-sulfur protein. The iron-sulfur assembly Isc system was also up-regulated.
Effect 11, the up-regulation of both the gene for AdhC (FrmA), a GSH-dependent formaldehyde dehydrogenase under the control of FmrR (YaiN), and the FmrR gene itself.
Effect 12, the up-regulation of some genes involved in the biosynthesis of cofactors, mostly those dealing with sulfur or iron insertion.
Most of these effects of Cd2+ on E. coli cells may indeed be derived from the affinity of Cd2+ for sulfur (Fig. 4). The solubility constant of CdS is 10−28 (57); thus, sulfide availability in E. coli cells should be compromised significantly by the presence of cytoplasmic Cd2+. The genes for proteins involved in cysteine biosynthesis were strongly up-regulated (Table 1), and this pattern has been observed before in E. coli (55) and other organisms (37). The up-regulated genes are all under the control of the LysR-type dual regulator CysB, which senses O-acetyl-l-serine (31), and O-acetyl-l-serine reacts with sulfide to form cysteine. Thus, cadmium seemed to inhibit cysteine formation from O-acetyl-L-serine, and this inhibition occurred to similar extents in all three strains. This effect may be caused by the sequestration of the product of the sulfite reduction, H2S, by Cd2+, forming the highly insoluble CdS, which can be seen in E. coli cells as a product of cadmium stress when the cells express cysteine desulfhydrase (56). Although the cysteine levels in E. coli could be maintained at 1 μmol/g (dry weight) of cells, even under cadmium stress (Fig. 2C), the inhibition of cysteine biosynthesis may have been sufficient to diminish GSH biosynthesis and other processes, most importantly, the synthesis of FeS clusters. All iron uptake systems were down-regulated, and all iron storage systems were up-regulated (Table 1). Sufficient or even surplus amounts of iron in the cell may be simply the result of a lack of cysteine and, moreover, CdS precipitation of the sulfide released from cysteine during FeS synthesis (50), leading to a double effect of cadmium on FeS cluster synthesis.
Additionally, the binding of Cd2+ to the thiols of FeS clusters may damage them and release iron, which in turn contributes to the cellular iron availability, leading again to the down-regulation of iron uptake and the up-regulation of iron storage. Two genes for the nonheme iron enzymes aconitase (acnA) and fumarase (fumC) of the tricarboxylic acid cycle were up-regulated after cadmium shock. Although these two genes were up-regulated, the other two fumarase genes, fumA and fumB, and the gene acnB for the second aconitase were not (Table 1).
The two aconitases in E. coli both catalyze the reversible isomerization of citrate and isocitrate via cis-aconitate. The acnA gene product is more stable, has a higher affinity for citrate, and is active over a wider pH range than the acnB gene product. The main role of the AcnA enzyme is maintenance or survival during nutritional or oxidative stress. The AcnB enzyme functions as the main catabolic enzyme but is a very sensitive protein (25) due to its unusual FeS cluster. Cadmium seems to damage AcnB, and the cell compensates for this toxic effect by the up-regulation of acnA expression.
There are three fumarase isozymes in E. coli, the products of the genes fumA, fumB, and fumC. Fumarase A is the major active enzyme under microaerophilic conditions (1 to 2% oxygen) and is constitutively synthesized under fermentation and aerobic growth conditions. Fumarase B has higher affinity for malate than for fumarate, so it functions as an alternative enzyme during anaerobiosis. Fumarase B also has some activity under microaerophilic conditions. Both fumarases A and B have decreased activity when oxygen levels are greater than 15%. Fumarase C has low-level activity during anaerobic growth but is highly active under aerobic growth (in 21% oxygen). This pattern provides the cell with an active fumarase under highly oxidative conditions (>4% oxygen), a situation in which fumarase A is inactivated (53). Fumarase C is not as sensitive as aconitase B but is under the control of SoxR, while the other two fumarases are not (16). SoxR belongs to the MerR family of transcriptional regulators and controls the three genes fumC, soxS, and soxR. Each SoxR polypeptide contains a 2Fe-2S cluster that senses the redox state of the cell. All three forms of SoxR (apo-SoxR, SoxR with a reduced FeS cluster, and SoxR with an oxidized FeS cluster) bind to promoter regions, but only oxidized SoxR is an allosteric activator, while reduced SoxR acts as a repressor. Oxidized iron-sulfur clusters oxidize SoxR and activate it, and genes in the rsx operon and the rseC gene of the rpoE-rseABC alternative sigma factor operon reduce SoxR again (29). The SoxS protein in turn regulates several other genes involved in the response to oxidative stress and is switched off automatically due to the short half-life of the protein (17, 23).
In cadmium-shocked wild-type cells, soxR, soxS, and the third SoxR target gene, fumC, were activated (Table 1). The fumC gene is under the double positive control of SoxR and SoxS, soxS is under the positive control of SoxR but under negative autocontrol, and soxR is under only negative autocontrol (16). This arrangement demonstrates that cadmium shock may lead to oxidated FeS clusters in the cell in addition to the damage of those clusters, as in the case of AcnB, and that cadmium may interact directly with SoxR, both effects resulting in increased soxS expression followed by up-regulated fumC expression.
Cd2+ binding to thiol groups should also influence GSH as the major thiol in E. coli. The expression of the two GSH synthesis genes gshA and gshB was slightly enhanced within the 10-min time period of the gene array experiment (Table 1) but was clearly enhanced when a 3-h experiment with the promoter of either gene fused to a reporter gene was performed (Fig. 3). Despite this up-regulation, the GSH level in wild-type cells declined with increasing cadmium concentrations (Fig. 2B). The same effect was observed for γEC in ΔgshB cells (Fig. 2D). As possible explanations, first, a significant portion of GSH or γEC may be in a chemical form that cannot be modified by monobromobimane and thus is invisible to the detection method used. Second, cadmium-bis-glutathionato or -γEC complexes may be exported by a yet-unknown detoxification system. Finally, there may be a lack of substrates for GSH (and γEC) biosynthesis, especially cysteine. The up-regulation of the cys pathway (Table 1) argues for this possibility.
Moreover, Cd2+ should bind to GSH (or γEC) and thus decrease the cellular concentration of free GSH in two ways, by the inhibition of its synthesis and by the sequestration of the compound. GSH is needed to reduce the glutaredoxins 1, 2, and 3, and reduced glutaredoxins are needed to repair oxidized proteins. The up-regulation of grxA (encoding glutaredoxin 1) but not grxB, grxC, and grxD/ydhD (encoding glutaredoxins 2, 3, and 4) was observed (Table 1). While glutaredoxins 1 to 3 are dithiol glutaredoxins that are reduced by GSH, glutaredoxin 4 is a monothiol glutaredoxin that can serve as a substrate of thioredoxin reductase (15). The differences between the up-regulated grxA gene on one hand and the other three genes on the other hand is that grxA is under the control of OxyR (15) while the others seem not to be. Other genes also under the positive control of OxyR as listed by EcoCyc (27) are hemH, ahpCF, uof-fur, dps, sufABCDSE, trxC, gor, yhjA, and katG. The genes for the alkyl hydroperoxide reductase AhpCF and the catalase KatG, the thioredoxin-like protein TrxC, and the GSH oxidoreductase Gor were indeed up-regulated (Table 1), as were those for the iron uptake regulator Fur, the ferrochelatase HemH, and the iron storage protein of starved cells Dps (Table 1). Since the LysR-like regulator OxyR is an activator only in its oxidized form (49), Cd2+ treatment obviously led to strong oxidative stress. Cd2+ is not redox active but the disturbance of the iron metabolism, especially the prevention of FeS cluster synthesis or the demetalation of FeS clusters, may lead to uncontrolled cytoplasmic Fe2+, which is in turn highly redox active. The resulting oxidative damage of DNA by Fenton's reaction is also in agreement with the observed effect 8 (Table 1).
Cadmium-induced oxidative stress has been shown previously in S. cerevisiae (33, 37, 54), a freshwater macrophyte (2), pea cells (46), and Xanthomonas campestris (3). In the X. campestris, the up-regulation of the OxyR regulon has also been shown previously (3). H2O2 activates OxyR by the formation of a disulfide bond (59), which is reduced again by glutaredoxin 1, which itself is reduced by GSH. Thus, the double inhibition of GSH action by Cd2+ may be the cause of the oxidative stress in E. coli after cadmium shock (42). Moreover, since Cd2+ may inhibit thioltransferases (10), the level of reduced glutaredoxin may decline even further. Thus, Cd2+ may cause a three-way limitation of the repair capacity for oxidatively damaged proteins, and this effect should also be visible in E. coli cells suffering cadmium shock.
Consequently, the strongest effect of cadmium treatment was the up-regulation of the heat shock proteins IbpB and IbpA, the “inclusion body-associated proteins” (1). Both proteins form a functional triad of chaperones together with ClpB and DnaK (36), which were also up-regulated by cadmium shock (Table 1). IbpA/IbpB and ClpB independently and cooperatively support the DnaK system in reversing protein aggregation. Other proteins also up-regulated were DnaJ, ClpA, and HslVU, an ATP-dependent protease forming a four-ring structure that resembles a proteasome (44). Thus, cadmium shock led to protein unfolding and denaturation in E. coli cells, which may result from the oxidative damage of proteins and compromised repair of this damage. In pea cells, cadmium leads to oxidative damage of proteins (45). Additionally, Cd2+ may also bind to thiol-containing side chains of proteins, inflicting a second kind of damage.
The binding of Cd2+ to thiol groups may also be the reason for the up-regulation of the zinc-cadmium-lead-exporting P-type ATPase ZntA, which is regulated by ZntR (7, 41), and the induction of the ars operon (Table 1). ZntA is needed to detoxify cytoplasmic Cd2+ by efflux to the periplasm and is therefore an important cadmium defense system (48). Cells without ZntA are much more sensitive to Cd2+ than cells without GSH; however, in the absence of ZntA, GSH contributes to cadmium resistance to a large extent (21). In contrast to the induction of this cadmium defense system, the induction of ars seems futile. E. coli possesses chromosomal genes encoding a defense system against arsenate. This ars determinant encodes the arsenate reductase ArsC, which forms arsenite from arsenate, and the arsenite efflux pump ArsB. Some E. coli cells may contain a second, more complicated arsenate resistance determinant on a plasmid (4). Both determinants are regulated by the repressor ArsR, which binds arsenite in its metallic As3+ form to thiol groups (43). Cd2+ may mimic As3+ and thus lead to the induction of the ars operon.
Thus, for wild-type cells, the observed effects of cadmium on changes in gene expression were all in agreement with the hypothesis that cadmium toxicity is the effect primarily of the binding of Cd2+ to sulfide (appearing during cysteine and FeS cluster synthesis in the cells) and thiol groups. A ΔgshA mutant that does not contain GSH (Fig. 2) would be expected to show the same effects but much more enhanced.
Cadmium treatment of ΔgshA mutant cells.
Cadmium treatment of ΔgshA mutant cells led to responses similar to those of wild-type cells, but only a few genes were significantly up-regulated (Table 1): dnaKJ (effect 1), trxC (effect 2), tauA (effect 5), and fumC and soxS (effect 10). The up-regulation of these genes was likely due to an increase in the amount of damaged proteins in ΔgshA cells compared to that in wild-type cells after cadmium treatment. Consistent with this interpretation, sigma factors RpoH and RpoE were also up-regulated in ΔgshA cells, presumably to maintain the integrity of cytoplasmic and envelope proteins. The two strains differed most in the expression of genes of the formaldehyde reduction pathway. While cadmium treatment led to increased production of the dehydrogenase FrmA (AdhC) and the regulator FrmR (YaiN) in wild-type cells, the expression of frmA was not up-regulated in cadmium-treated ΔgshA cells (Table 1, effect 11). This result was also verified by RT-PCR analysis (Table 2).
The frm operon encodes a formaldehyde detoxification pathway. Formaldehyde reacts spontaneously with GSH, forming S-hydroxymethylglutathione. This compound is oxidized by the NAD(P)H- and GSH-dependent formaldehyde dehydrogenase FrmA (AdhC). The S-formylglutathione hydrolase FrmB releases formiate and GSH again. The frm operon is under the control of FrmR (YaiN), which, interestingly, is related to the regulator RcnR of the cobalt-nickel efflux pump RncA (28). FrmR acts as a repressor, and the corresponding inducer is formaldehyde (22). This toxic substance originates from the repair of methylated DNA bases, e.g., the repair of N3-methylcytosine or N1-methyladenine by AlkB (58).
How is formaldehyde being detoxified in ΔgshA cells? EcoCyc (27) does not list another formaldehyde detoxification pathway in E. coli. Only one other enzyme that interacts with formaldehyde is mentioned, the N-methyltryptophan oxidase SolA (30). Maybe SolA is able to run in the reverse direction to detoxify formaldehyde, supporting the Frm detoxification pathway in the presence of GSH and serving as a substitute pathway in ΔgshA cells. The strong up-regulation of the Trp biosynthesis pathway in wild-type cells and the even stronger up-regulation in ΔgshA cells after cadmium shock (effect 4) support this assumption.
Thus, in agreement with the results from the growth curves (Fig. 1), GSH was not essential for protecting wild-type cells against cadmium shock. Obviously, the efflux of Cd2+ by ZntA, the repair of the damage done by Cd2+, and the operation of the functionally redundant thiol redox system (52) provided sufficient flexibility to allow further growth of E. coli, and there was no needed for further up-regulation of defense or repair factors. Alternatively, some of the concerned genes may have already been at their highest expression levels in wild-type cells. From these data, it could not be expected that the presence of γEC instead of GSH in ΔgshB mutant cells (Fig. 2) would change this picture.
Cadmium treatment of ΔgshB mutant cells.
Indeed, cells with γEC present instead of GSH exhibited the same results as wild-type cells for most effects, again with a few exceptions (Table 1). The genes mopB and dnaJ in ΔgshB cells were not up-regulated after cadmium treatment, but those in ΔgshA and wild-type cells were. Similar to those in ΔgshA cells, the genes of the formaldehyde detoxification pathway in ΔgshB cells were not induced. Sigma factors RpoN and RpoS were up-regulated significantly only in ΔgshB cells after cadmium treatment but not in the other two strains. This finding indicated starvation conditions, matching the growth results. Moreover, RpoE was up-regulated in ΔgshB cells, but not RpoH. The up-regulation patterns of the sox genes in the three strains after cadmium treatment were also different. In wild-type cells, soxR was up-regulated fourfold and soxS was up-regulated twofold. In ΔgshA cells, soxR was not up-regulated but soxS was up-regulated sixfold. In ΔgshB cells, soxR was up-regulated fourfold, but soxS was not. The biggest difference, however, was observed for tryptophan biosynthesis, which was not up-regulated in ΔgshB cells but was up-regulated in cells of the two other strains (Table 1). How did this fit with the growth impairment of ΔgshB cells after cadmium treatment?
The reason for this finding should be connected to the three groups of genes showing different degrees of regulation in the three strains. First, the genes for tryptophan biosynthesis differed as described above. Second, the taurine ABC uptake system, encoded by the tau operon, was especially up-regulated in ΔgshB (γEC-containing) cells under cadmium shock but less so in ΔgshA cells (Table 1). Finally, the genes needed for the detoxification of formaldehyde, frmA (adhC) and frmR (yaiN), were up-regulated in cadmium-shocked wild-type cells but in neither of the two mutant cell types (Table 1).
In the case of the tau genes, expression was up-regulated by cadmium shock in wild-type cells, even more strongly up-regulated in ΔgshA cells (without GSH or γEC), and again more strongly up-regulated in ΔgshB cells (containing γEC). The tauABCD operon is under the control of CysB but is additionally under the control of a second LysR-type regulator, Cbl, that is inhibited by adenosine-5′-phosphosulfate (APS) (9). This arrangement indicates increasingly low levels of APS in cadmium-treated wild-type cells, ΔgshA cells, and ΔgshB cells. The phospho-APS (PAPS) reductase uses thioredoxin as the electron donor for the reduction of PAPS to sulfide and forms a glutathionylated adduct (32). The enzyme uses its single cysteine residue as an electron donor for PAPS reduction, leading to sulfite and an enzyme dimer linked by a Cys-Cys dithiol, which is oxidized (and activated) again by thioredoxin. The glutathionylated form may thus regulate the activity of PAPS reductase in vivo (32) and inhibit the enzyme in the presence of sufficient GSH, or sufficient sulfur. Consequently, the absence of GSH in the mutant strains led to increased activity of PAPS reductase, lower concentrations of APS, and thus, Cbl-mediated up-regulation of the tau operon. We speculate that γEC may rapidly split the dimeric protein into two monomer-γEC adducts, which react quickly with thioredoxin. Thus, γEC may uncouple the already activated cysteine biosynthesis pathway, leading to an energy-wasting rapid production of sulfide, which is in turn precipitated as CdS.
Cbl also controls the expression of the ssuEADCB (ycbPONME) operon, which encodes a two-component alkanesulfonate monooxygenase (31) for the utilization of sulfonates as a sulfur source. Genes in this operon were not up-regulated (see the supplemental material) because the operon is inhibited by Cbl, contrary to the tau operon, which is activated by this regulator.
The frm operon was up-regulated in cadmium-shocked wild-type cells but not in either mutant strain (Table 1). This result indicated that cadmium led to increased production of formaldehyde, maybe by increased methylation of DNA bases (51); the polB gene for the DNA repair polymerase and the primase gene dnaG were also up-regulated (Table 1, effect 8). The detoxification of formaldehyde, however, should be compromised in ΔgshA cells without GSH, and frm expression in ΔgshA cells was indeed up-regulated compared to that in wild-type cells. Although γEC should react with formaldehyde to form S-hydroxymethyl-γEC, this compound seems not to be an FrmA substrate, because frm expression in the ΔgshB cells was up-regulated compared to that in wild-type cells. The sharp decrease of γEC with increasing cadmium concentrations (Fig. 2D) may indicate the formation of S-hydroxyl-γEC, which would not have been detected by the HPLC method used.
Could tryptophan serve as the substrate for an alternative formaldehyde detoxification pathway using N-methyltryptophan oxidase SolA, running in the reverse direction, as discussed above? The tryptophan biosynthesis pathway was up-regulated in cadmium-shocked wild-type and ΔgshA (thiol-free) cells but not in ΔgshB cells (Table 1). Since the trp operon is controlled in a dual mode by the repressor TrpR and by attenuation (58), this up-regulation suggests tryptophan starvation induced by cadmium in cells containing GSH (wild type) or no thiol (ΔgshA mutant) but not in γEC-containing ΔgshB cells. In the ΔgshB cells, formaldehyde could rapidly end up as toxic S-hydroxyl-γEC, escaping the speculative SolA detoxification pathway. However, added tryptophan had no influence on the growth of the three strains in the presence or absence of cadmium (data not shown), and solA was not up-regulated either by cadmium treatment or by differences in the three strains (see the supplemental material).
Thus, the reason for the increased cadmium sensitivity of the ΔgshB mutant compared to that of the ΔgshA mutant could not be unambiguously defined. The uncoupling associated with the PAPS reductase or the escape of formaldehyde into S-hydroxyl-γEC before SolA-mediated detoxification can occur may contribute to this effect. Both processes are speculative, but each is leading to a clear hypothesis that awaits experimental attention.
Conclusion.
The sequestration of sulfide by Cd2+ led to a lack of cysteine and, as a second effect, to the inhibition of FeS cluster synthesis. Additionally, those clusters were damaged by cadmium. All these effects result in a release of cytoplasmic iron, which may be the cause of the observed oxidative damage, leading to the up-regulation of the Sox and the OxyR pathways. Additionally, proteins may be damaged by the binding of cadmium to thiol groups. This double effect may be the cause of the up-regulation of small heat shock factors, the main effect of cadmium shock on E. coli cells. Finally, the removal of formaldehyde seems to be compromised by cadmium. Together, protein denaturation; oxidative damage; formaldehyde; insufficient and damaged FeS centers, especially in the aconitase AcnB; and cysteine and tryptophan starvation should be sufficient to cause a severe interruption of the cellular metabolism, as manifested in growth curves (Fig. 1) and the global transcriptome (Table 1).
All these effects may be linked to the binding of the cadmium cation to sulfur atoms in sulfide, thiols, and iron-sulfur centers. This possibility is consistent with the tested hypothesis that cadmium toxicity may be the result of the strong affinity of Cd2+ for sulfur. One may illustrate the cell as an energy landscape for Cd2+ with depressions being sulfur-rich cadmium-binding sites. These sites are being filled with the metal cation, starting with the deepest accessible hole (the kinetically accessible binding site with the lowest energy). The cation fills the sites according to the Boltzmann distribution. As can be seen (Fig. 4), binding is unfocused and nonspecific. One of these depressions should be the substrate-binding site of the efflux pump ZntA, the only system able to detoxify cadmium by removing it from its nonspecific binding sites. An accompanying paper investigates the interplay between efflux systems and GSH with respect to the toxicities of cadmium and other metals (21).
Supplementary Material
Acknowledgments
We thank Gregor Grass for carefully reading the manuscript and Grit Schleuder for her kindly assistance in the lab.
This work was supported by the Deutsche Forschungsgemeinschaft (Graduiertenkolleg Stress) and a grant to the government of Land Sachsen-Anhalt to found the international graduate school (including the life science sector) at the Martin-Luther-University Halle-Wittenberg.
Footnotes
Published ahead of print on 6 June 2008.
Supplemental material for this article may be found at http://jb.asm.org/.
REFERENCES
- 1.Allen, S. P., J. O. Polazzi, J. K. Gierse, and A. M. Easton. 1992. Two novel heat shock genes encoding proteins produced in response to heterologous protein expression in Escherichia coli. J. Bacteriol. 1746938-6947. [DOI] [PMC free article] [PubMed] [Google Scholar]
- 2.Aravind, P., M. Narasimha, and V. Prasad. 2005. Modulation of cadmium-induced oxidative stress in Ceratophyllum demersum by zinc involves ascorbate-glutathione cycle and glutathione metabolism. Plant Physiol. Biochem. 43107-116. [DOI] [PubMed] [Google Scholar]
- 3.Banjerdkij, P., P. Vattanaviboon, and S. Mongkolsuk. 2005. Exposure to cadmium elevates expression of genes in the OxyR and OhrR regulons and induces cross-resistance to peroxide killing treatment in Xanthomonas campestris. Appl. Environ. Microbiol. 711843-1849. [DOI] [PMC free article] [PubMed] [Google Scholar]
- 4.Bhattacharjee, H., and B. P. Rosen. 2007. Arsenic metabolism in prokaryotic and eukaryotic microbes, p. 371-406. In D. H. Nies and S. Silver (ed.), Molecular microbiology of heavy metals, vol. 6. Springer-Verlag, Berlin, Germany. [Google Scholar]
- 5.Bowtell, D., and J. Sambrook. 2003. DNA microarrays: a molecular cloning manual. Cold Spring Harbor Laboratory Press, Cold Spring Harbor, NY.
- 6.Brazma, A., P. Hingamp, J. Quackenbush, G. Sherlock, P. Spellman, C. Stoeckert, J. Aach, W. Ansorge, C. A. Ball, H. C. Causton, T. Gaasterland, P. Glenisson, F. C. P. Holstege, I. F. Kim, V. Markowitz, J. C. Matese, H. Parkinson, A. Robinson, U. Sarkans, S. Schulze-Kremer, J. Stewart, R. Taylor, J. Vilo, and M. Vingron. 2001. Minimum information about a microarray experiment (MIAME)—towards standards for microarray data. Nat. Genet. 29365-371. [DOI] [PubMed] [Google Scholar]
- 7.Brocklehurst, K. R., J. L. Hobman, B. Lawley, L. Blank, S. J. Marshall, N. L. Brown, and A. P. Morby. 1999. ZntR is a Zn(II)-responsive MerR-like transcriptional regulator of zntA in Escherichia coli. Mol. Microbiol. 31893-902. [DOI] [PubMed] [Google Scholar]
- 8.Butler, J. D., S. W. Levin, A. Facchiano, L. Miele, and A. B. Mukherjee. 1993. Amino acid composition and N-terminal sequence of purified cystine binding protein of Escherichia coli. Life Sci. 521209-1215. [DOI] [PubMed] [Google Scholar]
- 9.Bykowski, T., J. R. van der Ploeg, R. Iwanicka-Nowicka, and M. M. Hryniewicz. 2002. The switch from inorganic to organic sulphur assimilation in Escherichia coli: adenosine 5′-phosphosulphate (APS) as a signalling molecule for sulphate excess. Mol. Microbiol. 431347-1358. [DOI] [PubMed] [Google Scholar]
- 10.Chrestensen, C. A., D. W. Starke, and J. J. Mieyal. 2000. Acute cadmium exposure inactivates thioltransferase (glutaredoxin), inhibits intracellular reduction of protein-glutathionyl-mixed disulfides, and initiates apoptosis. J. Biol. Chem. 27526556-26565. [DOI] [PubMed] [Google Scholar]
- 11.Cobbett, C., and P. Goldsbrough. 2002. Phytochelatins and metallothioneins: roles in heavy metal detoxification and homeostasis. Annu. Rev. Plant Biol. 53159-182. [DOI] [PubMed] [Google Scholar]
- 12.Egler, M., C. Grosse, G. Grass, and D. H. Nies. 2005. Role of the extracytoplasmic function protein family sigma factor RpoE in heavy metal resistance of Escherichia coli. J. Bacteriol. 1872297-2307. [DOI] [PMC free article] [PubMed] [Google Scholar]
- 13.Ernst, W. H. O., G.-J. Krauss, J. A. C. Verkleij, and D. Wesenberg. 2008. Interaction of heavy metals with the sulphur metabolism in angiosperms from an ecological point of view. Plant Cell Environ. 31123-143. [DOI] [PubMed] [Google Scholar]
- 14.Fahey, R. C. 2001. Novel thiols of prokaryotes. Annu. Rev. Microbiol. 55333-356. [DOI] [PubMed] [Google Scholar]
- 15.Fernandes, A. P., M. Fladvad, C. Berndt, C. Andrésen, C. H. Lillig, P. Neubauer, M. Sunnerhagen, A. Holmgren, and A. Vlamis-Gardikas. 2005. A novel monothiol glutaredoxin (Grx4) from Escherichia coli can serve as a substrate for thioredoxin reductase. J. Biol. Chem. 28024544-24552. [DOI] [PubMed] [Google Scholar]
- 16.Fuentes, A. M., J. J. Díaz-Mejía, R. Maldonado-Rodríguez, and C. F. Amábile-Cuevas. 2001. Differential activities of the SoxR protein of Escherichia coli: SoxS is not required for gene activation under iron deprivation. FEMS Microbiol. Lett. 201271-275. [DOI] [PubMed] [Google Scholar]
- 17.Gaudu, P., N. Moon, and B. Weiss. 1997. Regulation of the soxRS oxidative stress regulon. Reversible oxidation of the Fe-S centers of SoxR in vivo. J. Biol. Chem. 2725082-5086. [DOI] [PubMed] [Google Scholar]
- 18.Gharieb, M. M., and G. M. Gadd. 2004. Role of glutathione in detoxification of metal(loid)s by Saccharomyces cerevisiae. Biometals 17183-188. [DOI] [PubMed] [Google Scholar]
- 19.Grosse, C., G. Grass, A. Anton, S. Franke, A. Navarrete Santos, B. Lawley, N. L. Brown, and D. H. Nies. 1999. Transcriptional organization of the czc heavy-metal homoeostasis determinant from Alcaligenes eutrophus. J. Bacteriol. 1812385-2393. [DOI] [PMC free article] [PubMed] [Google Scholar]
- 20.Haldimann, A., and B. L. Wanner. 2001. Conditional-replication, integration, excision, and retrieval plasmid-host systems for gene structure-function studies of bacteria. J. Bacteriol. 1836384-6393. [DOI] [PMC free article] [PubMed] [Google Scholar]
- 21.Helbig, K., C. Bleuel, G. J. Krauss, and D. H. Nies. 2008. Glutathione and transition-metal homeostasis in Escherichia coli. J. Bacteriol. 1905431-5438. [DOI] [PMC free article] [PubMed] [Google Scholar]
- 22.Herring, C. D., and F. R. Blattner. 2004. Global transcriptional effects of a suppressor tRNA and the inactivation of the regulator frmR. J. Bacteriol. 1866714-6720. [DOI] [PMC free article] [PubMed] [Google Scholar]
- 23.Hidalgo, E., V. Leautaud, and B. Demple. 1998. The redox-regulated SoxR protein acts from a single DNA site as a repressor and an allosteric activator. EMBO J. 172629-2636. [DOI] [PMC free article] [PubMed] [Google Scholar]
- 24.Hochgräfe, F., J. Mostertz, D.-C. Pöther, D. Becher, J. D. Helmann, and M. Hecker. 2007. S-Cysteinylation is a general mechanism for thiol protection of Bacillus subtilis proteins after oxidative stress. J. Biol. Chem. 28225981-25985. [DOI] [PubMed] [Google Scholar]
- 25.Jordan, P. A., Y. Tang, A. J. Bradbury, A. J. Thomson, and J. R. Guest. 1999. Biochemical and spectroscopic characterization of Escherichia coli aconitases (AcnA and AcnB). Biochem. J. 344739-746. [PMC free article] [PubMed] [Google Scholar]
- 26.Kanehisa, M., S. Goto, M. Hattori, K. F. Aoki-Kinoshita, M. Itoh, S. Kawashima, T. Katayama, M. Araki, and M. Hirakawa. 2006. From genomics to chemical genomics: new developments in KEGG. Nucleic Acids Res. 34D354-D357. [DOI] [PMC free article] [PubMed] [Google Scholar]
- 27.Karp, P. D., I. M. Keseler, A. Shearer, M. Latendresse, M. Krummenacker, S. M. Paley, I. Paulsen, J. Collado-Vides, S. Gama-Castro, M. Peralta-Gil, A. Santos-Zavaleta, A. I. Peñaloza-Spínol, C. Bonavides-Martinez, and J. Ingraham. 2007. Multidimensional annotation of the Escherichia coli K-12 genome. Nucleic Acid Res. 357577-7590. [DOI] [PMC free article] [PubMed] [Google Scholar]
- 28.Koch, D., D. H. Nies, and G. Grass. 2007. The RcnRA (YohLM) system of Escherichia coli: a connection between nickel, cobalt and iron homeostasis. Biometals 20759-771. [DOI] [PubMed] [Google Scholar]
- 29.Koo, M. S., J. H. Lee, S. Y. Rah, W. S. Yeo, J. W. Lee, K. L. Lee, Y. S. Koh, S. O. Kang, and J. H. Roe. 2003. A reducing system of the superoxide sensor SoxR in Escherichia coli. EMBO J. 222614-2622. [DOI] [PMC free article] [PubMed] [Google Scholar]
- 30.Koyama, Y., and H. Ohmori. 1996. Nucleotide sequence of the Escherichia coli solA gene encoding a sarcosine oxidase-like protein and characterization of its product. Gene 181179-183. [DOI] [PubMed] [Google Scholar]
- 31.Kredich, N. M. 1992. The molecular basis for positive regulation of cys promoters in Salmonella typhimurium and Escherichia coli. Mol. Microbiol. 62747-2753. [DOI] [PubMed] [Google Scholar]
- 32.Lillig, C. H., A. Potamitou, J. D. Schwenn, A. Vlamis-Gardikas, and A. Holmgren. 2003. Redox regulation of 3′-phosphoadenylylsulfate reductase from Escherichia coli by glutathione and glutaredoxins. J. Biol. Chem. 27822325-22330. [DOI] [PubMed] [Google Scholar]
- 33.Liu, J. H., Y. M. Zhang, D. J. Huang, and G. Song. 2005. Cadmium induced MTs synthesis via oxidative stress in yeast Saccharomyces cerevisiae. Mol. Cell. Biochem. 280139-145. [DOI] [PubMed] [Google Scholar]
- 34.Mergeay, M., D. Nies, H. G. Schlegel, J. Gerits, P. Charles, and F. van Gijsegem. 1985. Alcaligenes eutrophus CH34 is a facultative chemolithotroph with plasmid-bound resistance to heavy metals. J. Bacteriol. 162328-334. [DOI] [PMC free article] [PubMed] [Google Scholar]
- 35.Miller, J. H. 1972. Experiments in molecular genetics. Cold Spring Harbor Press, Cold Spring Harbor, NY.
- 36.Mogk, A., E. Deuerling, S. Vorderwülbecke, E. Vierling, and B. Bukau. 2003. Small heat shock proteins, ClpB and the DnaK system form a functional triade in reversing protein aggregation. Mol. Microbiol. 50585-595. [DOI] [PubMed] [Google Scholar]
- 37.Momose, Y., and H. Iwahashi. 2001. Bioassay of cadmium using a DNA microarray: genome-wide expression patterns of Saccharomyces cerevisiae response to cadmium. Environ. Toxicol. Chem. 202353-2360. [DOI] [PubMed] [Google Scholar]
- 38.Newton, G. L., and R. C. Fahey. 1995. Determination of biothiols by bromobimane labeling and high-performance liquid chromatography. Methods Enzymol. 251148-166. [DOI] [PubMed] [Google Scholar]
- 39.Newton, G. L., and R. C. Fahey. 2002. Mycothiol biochemistry. Arch. Microbiol. 178388-394. [DOI] [PubMed] [Google Scholar]
- 40.Nies, D. H. 2007. Bacterial transition metal homeostasis, p. 118-142. In D. H. Nies and S. Silver (ed.), Molecular microbiology of heavy metals, vol. 6. Springer-Verlag, Berlin, Germany. [Google Scholar]
- 41.Outten, C. E., and T. V. O'Halloran. 2001. Femtomolar sensitivity of metalloregulatory proteins controlling zinc homeostasis. Science 2922488-2492. [DOI] [PubMed] [Google Scholar]
- 42.Pacheco, C. C., J. F. Passos, A. R. Castro, P. Moradas-Ferreira, and P. D. De Marco. 2008. Role of respiration and glutathione in cadmium-induced oxidative stress in Escherichia coli K-12. Arch. Microbiol. 189271-278. [DOI] [PubMed] [Google Scholar]
- 43.Qin, J., H. L. Fu, J. Ye, K. Z. Bencze, T. L. Stemmler, D. E. Rawlings, and B. P. Rosen. 2007. Convergent evolution of a new arsenic binding site in the ArsR/SmtB family of metalloregulators. J. Biol. Chem. 28234346-34355. [DOI] [PMC free article] [PubMed] [Google Scholar]
- 44.Rohrwild, M., G. Pfeifer, U. Santarius, S. A. Müller, H. C. Huang, A. Engel, W. Baumeister, and A. L. Goldberg. 1997. The ATP-dependent HslVU protease from Escherichia coli is a four-ring structure resembling the proteasome. Nat. Struct. Biol. 4133-139. [DOI] [PubMed] [Google Scholar]
- 45.Romero-Puertas, M. C., J. M. Palma, M. Gomez, L. A. Del Rio, and L. M. Sandalio. 2002. Cadmium causes the oxidative modification of proteins in pea plants. Plant Cell Environ. 25677-686. [Google Scholar]
- 46.Romero-Puertas, M. C., M. Rodriguez-Serrano, F. J. Corpas, M. Gomez, L. A. Del Rio, and L. M. Sandalio. 2004. Cadmium-induced subcellular accumulation of O2− and H2O2 in pea leaves. Plant Cell Environ. 271122-1134. [Google Scholar]
- 47.Sambrook, J., E. F. Fritsch, and T. Maniatis. 1989. Molecular cloning: a laboratory manual, 2nd ed. Cold Spring Harbor Laboratory, Cold Spring Harbor, NY.
- 48.Sharma, R., C. Rensing, B. P. Rosen, and B. Mitra. 2000. The ATP hydrolytic activity of purified ZntA, a Pb(II)/Cd(II)/Zn(II)-translocating ATPase from Escherichia coli. J. Biol. Chem. 2753873-3878. [DOI] [PubMed] [Google Scholar]
- 49.Storz, G., L. A. Tartaglia, and B. N. Ames. 1990. The OxyR regulon. Antonie van Leeuwenhoek 58157-161. [DOI] [PubMed] [Google Scholar]
- 50.Takahashi, Y., and M. Nakamura. 1999. Functional assignment of the ORF2-iscS-iscU-iscA-hscB-hscA-fdx-ORF3 gene cluster involved in the assembly of Fe-S clusters in Escherichia coli. J. Biochem. 126917-926. [DOI] [PubMed] [Google Scholar]
- 51.Takiguchi, M., W. E. Achanzar, W. Qu, G. Li, and M. P. Waalkes. 2003. Effects of cadmium on DNA-(cytosine-5) methyltransferase activity and DNA methylation status during cadmium-induced cellular transformation. Exp. Cell Res. 286355-365. [DOI] [PubMed] [Google Scholar]
- 52.Toledano, M. B., C. Kumar, N. Le Moan, D. Spector, and F. Tacnet. 2007. The system biology of thiol redox system in Escherichia coli and yeast: differential functions in oxidative stress, iron metabolism and DNA synthesis. FEBS Lett. 5813598-3607. [DOI] [PubMed] [Google Scholar]
- 53.Tseng, C. P., C. C. Yu, H. H. Lin, C. Y. Chang, and J. T. Kuo. 2001. Oxygen- and growth rate-dependent regulation of Escherichia coli fumarase (FumA, FumB, and FumC) activity. J. Bacteriol. 183461-467. [DOI] [PMC free article] [PubMed] [Google Scholar]
- 54.Vido, K., D. Spector, G. Lagniel, S. Lopez, M. B. Toledano, and J. Labarre. 2001. A proteome analysis of the cadmium response in Saccharomyces cerevisiae. J. Biol. Chem. 2768469-8474. [DOI] [PubMed] [Google Scholar]
- 55.Wang, A. Y., and D. E. Crowley. 2005. Global gene expression responses to cadmium toxicity in Escherichia coli. J. Bacteriol. 1873259-3266. [DOI] [PMC free article] [PubMed] [Google Scholar]
- 56.Wang, C. L., A. M. Lum, S. C. Ozuna, D. S. Clark, and J. D. Keasling. 2001. Aerobic sulfide production and cadmium precipitation by Escherichia coli expressing the Treponema denticola cysteine desulfhydrase gene. Appl. Microbiol. Biotechnol. 56425-430. [DOI] [PubMed] [Google Scholar]
- 57.Weast, R. C. 1984. CRC handbook of chemistry and physics, 64th ed. CRC Press, Inc., Boca Raton, FL.
- 58.Yu, B., W. C. Edstrom, J. Benach, Y. Hamuro, P. C. Weber, B. R. Gibney, and J. F. Hunt. 2006. Crystal structures of catalytic complexes of the oxidative DNA/RNA repair enzyme AlkB. Nature 439879-884. [DOI] [PubMed] [Google Scholar]
- 59.Zheng, M., F. Aslund, and G. Storz. 1998. Activation of the OxyR transcription factor by reversible disulfide bond formation. Science 2791718-1721. [DOI] [PubMed] [Google Scholar]
Associated Data
This section collects any data citations, data availability statements, or supplementary materials included in this article.