

Abstract
Ca2+-triggered, synchronized synaptic vesicle fusion underlies interneuronal communication. Complexin is a major binding partner of the SNARE complex, the core fusion machinery at the presynapse. The physiological data on complexin, however, have been at odds with each other, making delineation of its molecular function difficult. Here we report direct observation of two-faceted functions of complexin using the single-vesicle fluorescence fusion assay and EPR. We show that complexin I has two opposing effects on trans-SNARE assembly: inhibition of SNARE complex formation and stabilization of assembled SNARE complexes. Of note, SNARE-mediated fusion is markedly stimulated by complexin, and it is further accelerated by two orders of magnitude in response to an externally applied Ca2+ wave. We suggest that SNARE complexes, complexins and phospholipids collectively form a complex substrate for Ca2+ and Ca2+-sensing fusion effectors in neurotransmitter release.
Complexins are small proteins (~ 15 kDa) that are mainly found in the presynaptic part of neuronal cells1–3 and that show an α-helical propensity near the N-terminus but no apparent tertiary structure4,5. The α-helical structure is probably responsible for complexin binding to the groove between the synaptobrevin and the syntaxin helices in the neuronal SNARE complex4,5, which itself is a tight bundle of four α-helices6–13.
Despite the seemingly simple structure and binding mode of complexin, physiological studies have suggested diverse functions. Overexpression of complexin14–16 in chromaffin14 and PC12 (ref. 15) cells or expression as a fusion protein to synaptobrevin16 substantially diminishes neurotransmitter release, suggesting an inhibitory role of complexin. In contrast, knockout of complexin isoforms from hippocampal neurons selectively impairs the synchronous component of exocytosis17,18, indicating a stimulatory role of complexin in late fusion steps. Biophysical studies4,5,16,19,20 have also reported either stimulatory4,5 or inhibitory effects of complexin, although the recent results primarily support an inhibitory role of complexin as a clamp for SNARE-driven membrane fusion19–21. This knowledge gap between these contrasting viewpoints in physiological and molecular analyses remains largely unfilled up to this point, making it difficult to gain further insights into precisely how complexins function in neurotransmitter release.
In this work, we used a single-vesicle fluorescence resonance energy transfer (FRET) fusion assay and EPR spectroscopy, which have proven powerful in dissecting individual fusion steps along the pathway of SNARE-mediated membrane fusion22,23. The combined analyses, performed using rat brain proteins, show that complexin I promotes membrane fusion by directly interacting with the trans neuronal SNARE complex. Notably, complexin further accelerates fusion by two orders of magnitude upon introduction of the Ca2+ ion under physiologically relevant conditions, resulting in synchronization of fusion on the timescale of seconds. By contrast, high micromolar complexin inhibits vesicle docking through a weak interaction with the target membrane (t-) SNARE complex, reconciling previous conflicting findings.
RESULTS
Single-vesicle FRET fusion assay
In the single-vesicle fusion assay, vesicles containing synaptic vesicle (v-) SNARE proteins (synaptobrevin) and membrane-specific acceptor fluorophores (2 molar percent DiD) were tethered to a quartz imaging surface coated with poly-ethyleneglycol (Fig. 1a, left). Then vesicles containing t-SNARE proteins (syntaxin and SNAP-25) and donor fluorophores (2 molar percent DiI) were added in solution to induce SNARE complex formation and membrane fusion between a pair of single t- and v-SNARE vesicles (Fig. 1a, middle and right). A single-vesicle fusion event leads to an increase in the FRET efficiency, E, defined as IA / (ID + IA) where ID and IA are the donor and the acceptor fluorescence intensities, respectively. Docking (or early fusion steps) shows low E values, smaller than 0.25, and the full-fusion state gives E ≈ 0.7 (ref. 22). By imaging over 100 fusion events in single-vesicle complexes in parallel, we probed how individual fusion steps were modulated by the regulatory factors present, such as complexin.
Figure 1.
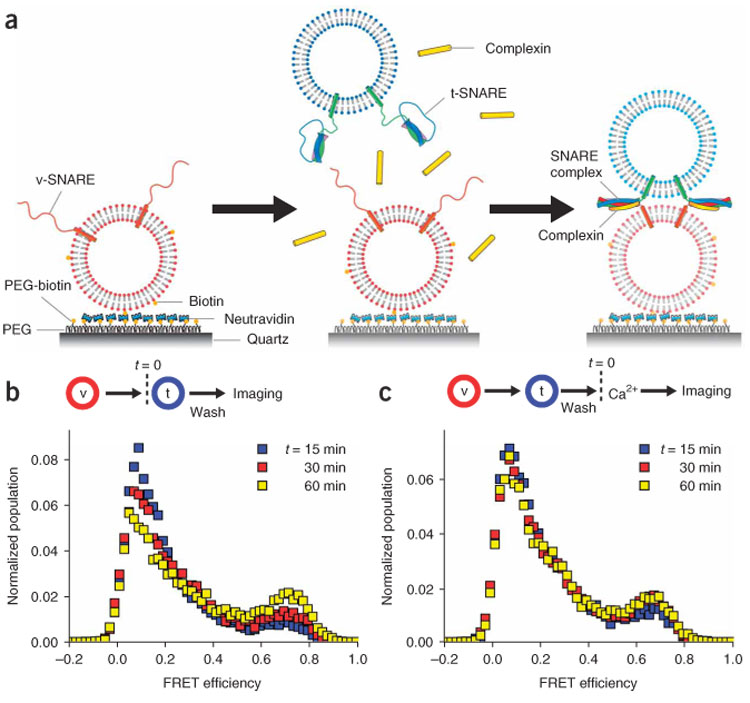
Single-vesicle FRET analysis of neuronal SNARE-induced membrane fusion. (a) Schematics of the single-vesicle FRET assay. Some t-SNARE vesicles dock to single v-SNARE vesicles immobilized on the surface through formation of trans-SNARE complexes, and complexin I binds to the trans-SNARE complexes. Membrane fusion between t- and v-SNARE vesicles and resultant lipid mixing will produce an increase in the FRET efficiency. (b,c) FRET distribution of basal, neuronal SNARE-mediated membrane fusion. t-SNARE vesicles were flowed in to surface-immobilized v-SNARE vesicles. After incubation for 12 minutes at 37 °C, residual, undocked t-SNARE vesicles were removed by fusion buffer either with 1 mM EGTA (b) or 1 mM Ca2+ (c). A lipid composition of 65:35 (mol/mol) POPC:DOPS was used. FRET values of single-vesicle complexes formed on the surface were measured at times t = 15, 30 and 60 min while the temperature of the flow chamber was maintained at 37 °C. The numbers of vesicle complexes included in statistics are 9,602 (blue), 7,410 (red), and 6,032 (yellow) for b and 11,037 (blue), 12,324 (red), and 9,479 (yellow) for c.
We first imaged fusion mediated by the SNARE proteins only, that is, in the absence of complexin and Ca2+. The FRET efficiency histogram of single-vesicle complexes formed by a pair of t- and v-SNARE vesicles 15 min after addition of t-SNARE vesicles (37 °C; Fig. 1b, blue symbols) showed a small full-fusion population (E ≈ 0.7) with the vast majority remaining at the docked state (E ≈ 0.1). In the absence of SNAP-25, we did not observe any full-fusion population, indicating that the ternary SNARE complex is required for fusion (Supplementary Fig. 1a online). The full-fusion peak grew with time (Fig. 1b, red and yellow symbols) but on a slow timescale of tens of minutes. Addition of 1 mM Ca2+ to pre-formed neuronal SNARE complexes did not change the fusion kinetics (Fig. 1c and Supplementary Fig. 1b). As neurotransmitter release occurs on a much faster millisecond timescale, the slow fusion by SNAREs suggests that the combined effect of fusion effectors should be primarily in accelerating fusion.
Complexin inhibits docking between v- and t-SNARE vesicles
Next, we included recombinant full-length complexin I (residues 2–134) and 1 mM EGTA in the t-SNARE vesicle solution (Fig. 2a, flow chart). We mixed t-SNARE vesicles with different amounts of complexin I (0.2, 2 and 20 µM) and then injected the mixture into a flow chamber with surface-immobilized v-SNARE vesicles (t = 0) (as in Fig. 1a). After 12 min incubation at 37 °C, unbound t-SNARE vesicles and complexins in solution were removed by flow washing. We then counted the average number of t-SNARE vesicles per imaging area (50 × 100 µm2) that docked to individual v-SNARE vesicles (Fig. 2a and Supplementary Fig. 2a online). By dividing this average number of docked t-SNARE vesicles by the average number of v-SNARE vesicles per imaging area (Supplementary Fig. 2b), we obtained the probability that a surface-tethered v-SNARE vesicle would be docked by a t-SNARE vesicle (Fig. 2b). No docking was observed in the absence of v-SNARE vesicles or without SNARE proteins. Without complexin, the docking probability was 0.27. This probability was maintained up to the complexin concentration of 2 µM, but notably reduced to ~0.1 when 20 µM complexin was used (Fig. 2a,b). Therefore, complexin at this high concentration inhibits SNARE complex formation, which may explain the phenotype of complexin overexpression14–15.
Figure 2.
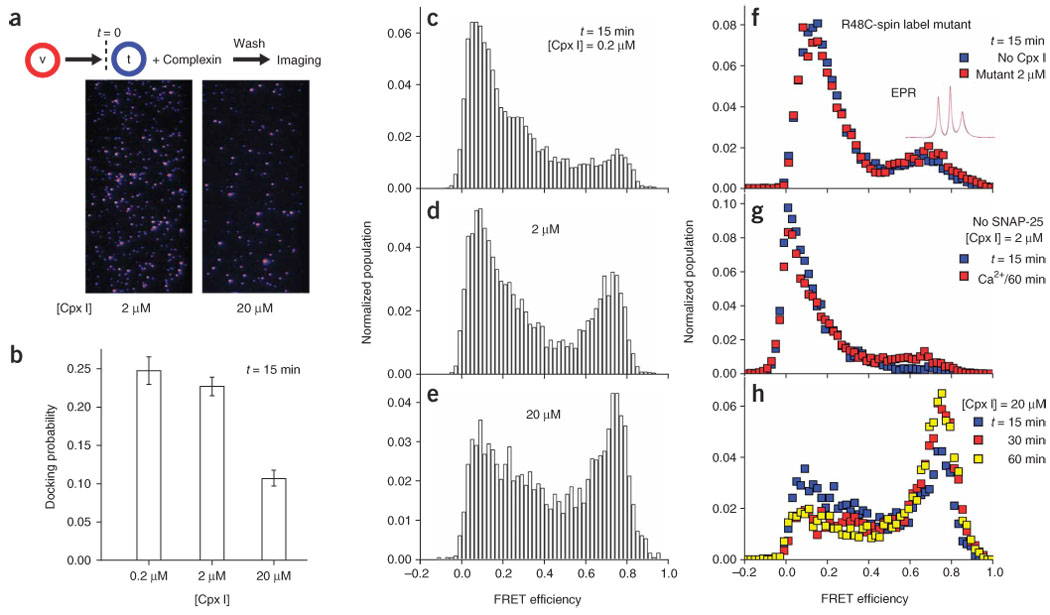
Observation of dual functions of complexin I in the absence of Ca2+. FRET values of single-vesicle complexes and number of docked t-SNARE vesicles were measured at times t = 15, 30 and 60 min at 37 °C. A lipid composition of 65:35 (mol/mol) POPC:DOPS (see Methods) was used for all the data in this figure. See Supplementary Figure 8b for the number of vesicle complexes studied in each case. (a) Exemplary donor-channel images directly obtained from TIR imaging. Each fluorescence spot represents a single t-SNARE vesicle docked to a v-SNARE vesicle for the indicated complexin I (Cpx I) concentration, and the number of fluorescence spots in one imaging area can be unambiguously counted. (b) Docking probability of a single v-SNARE vesicle measured at t = 15 min as a function of the Cpx I concentration. Error bars, s.d. (c–e) FRET histograms of single-vesicle complexes measured at t = 15 min at [Cpx I] = 0.2 (c), 2 (d) and 20 µM (e). (f) Control data using C105A R48C spin-labeled complexin I mutant. Inset, room-temperature EPR spectra of the spin-labeled mutant when incubated in simple fusion buffer (black trace) or in a solution of vesicles carrying cis-SNARE complexes (red trace). Blue and red symbols, FRET population histograms at time t = 15 min without complexin I (blue) or with 2 µM mutant (red). (g) Control data without SNAP-25. t-SNARE vesicles harboring only syntaxin HT (lipid to protein ratio kept at 200:1) and [Cpx I] = 2 µM were used for incubation with v-SNARE vesicles. Blue symbols, FRET distribution measured at t = 15 min. Red symbols, 1 mM Ca2+ was injected subsequent to flow washing of t-SNARE vesicles and complexin I, and FRET values were imaged at t = 60 min. (h) Time-course change of the single-vesicle FRET histogram at [Cpx I] = 20 µM. Three FRET histograms measured at t = 15 (same data as e, revisited as blue symbols), 30 (red) and 60 min (yellow). See Supplementary Figure 4 for the time-course changes of c and d.
Complexin binding to SNARE complex stimulates fusion
Comparison of the FRET histograms of single-vesicle complexes, however, showed that an increasing amount of complexin I enhanced the full-fusion population at E ≈ 0.7 (Fig. 2c–e). The normalized full-fusion population, defined as the number of vesicle complexes with E > 0.5 divided by the total number of vesicle complexes imaged, was 0.18 at [complexin I] = 0.2 µM and increased to 0.32 at 2 µM and 0.45 at 20 µM after 15 min reaction each. To probe whether the complexin–SNARE complex interaction was directly involved in the fusion reaction, we engineered a double point mutation in complexin I (C105A R48C) to attach a nitroxide spin label at position 48, which is critically involved in complexin binding to the SNARE complex4,5. This spin-labeled R48C mutant showed minimal binding to the ternary SNARE complex, evident from infinitesimal changes in the EPR spectra in the presence of cis SNARE complexes (Fig. 2f, EPR spectra, black versus red traces; see Supplementary Fig. 3 online for enlarged spectra). Coincident with this diminished binding, the stimulation effect was largely reduced (Fig. 2f) indicating that complexin binding to the SNARE complex is essential for stimulation of fusion. Furthermore, the stimulatory effect of complexin I was specific to the complete SNARE complex because a markedly reduced full-fusion population was observed without SNAP-25, even with reaction time of 60 min and 1 mM Ca2+ (Fig. 2g). Therefore, stimulation of full fusion here must arise from the direct interaction between SNARE complexes and complexin I.
The data so far have demonstrated two opposing effects of complexin on the SNARE complex. Complexin I at high micromolar concentrations inhibited trans-SNARE complex formation, thereby limiting docking, but once SNARE complexes were formed, complexin I helped to drive the fusion process to later stages. The stimulatory effect of complexin was visible at ~ 1 µM, about an order of magnitude lower than what is necessary for the inhibitory effect. Ca2+-independent stimulation of full fusion by complexin I continued beyond 15 min (Fig. 2h and Supplementary Fig. 4 online).
Complexin-assisted, Ca2+-triggered fusion events
Synaptotagmin I is thought to be the major Ca2+ sensor for neurotransmitter release. However, the complexin I and II deletion mutant shows a phenotype similar to that of the synaptotagmin I–deficient neuron, with severely hampered fast neurotransmitter release17,18. We therefore asked whether Ca2+ could trigger SNARE-mediated fusion in the presence of complexin I but without synaptotagmin I. To probe potential Ca2+ effects, we used real-time tracking of single-vesicle fusion events22. We incubated a solution of t-SNARE vesicles, complexin I (1.2 µM) and 10 µM EGTA with surface-immobilized v-SNARE vesicles for 12 min and introduced 1 mM Ca2+ to the imaging area at t = 4.4 s (at the speed of 2 ml min−1, t = 0 corresponds to the start of real-time tracking) while donor and acceptor signals from single-vesicle complexes were being recorded with the time resolution of 150 or 200 ms (Fig. 3a, flow chart). Notably, we observed a substantial fraction of vesicle complexes showing fusion synchronized with the Ca2+ flow (Fig. 3).
Figure 3.
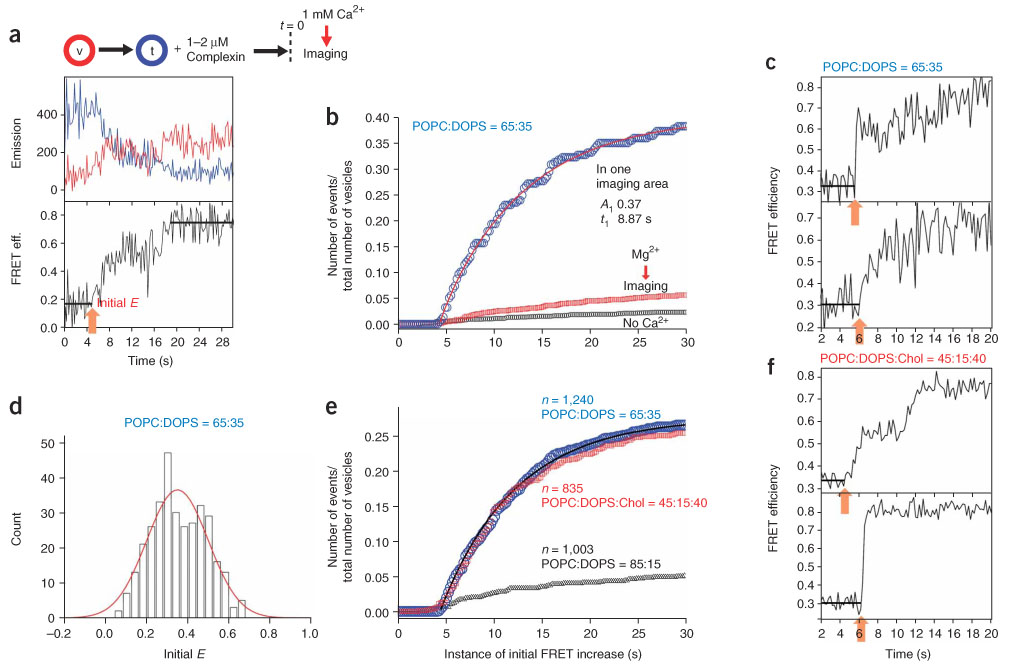
Complexin-assisted, Ca2+-triggered single-vesicle fusion events. (a) Exemplary real-time fusion trace of a single-vesicle complex. Upper panel, changes in the donor (blue) and the acceptor (red) fluorescence intensities. Lower panel, the corresponding changes in the FRET efficiency. The initial and the final FRET states are marked by black bars and the instance of initial FRET increase is marked by an orange arrow. The data in a–d were measured using the lipid composition of 65:35 (mol/mol) POPC:DOPS. (b) Blue symbols, cumulative plot of the instances of initial FRET increase for 217 vesicle complexes in one imaging area. Red line, two-exponential fitting to the blue symbols. Red and black symbols, cumulative plots of the instances of initial FRET increase upon injection of 1 mM Mg2+ (red) or fusion buffer without Ca2+ (black). Both cumulative plots are based on multiple flow experiments; total number of vesicle complexes studied are 1,161 (red) and 1,900 (black). (c) Exemplary real-time traces showing synchronized FRET jumps. The instances of initial FRET increase, marked by orange arrows, are at 5.8 and 6.2 s (top and bottom, respectively). (d) Distribution of the initial E values for the single-vesicle complexes that show an FRET increase within the first 30-s window. Fitting with a gaussian distribution gives the center at E = 0.35 and the standard deviation of 0.15 (red curve). Total 1,240 vesicles from five independent flow experiments are included in statistics, and the corresponding cumulative time plot is shown as blue symbols in e. (e) Cumulative plots of the instances of initial FRET increase for different lipid compositions: blue symbols, 65:35 (mol/mol) POPC:DOPS; red symbols, 45:15:40 (mol/mol/mol) POPC:DOPS:cholesterol; black symbols, 85:15 (mol/mol) POPC:DOPS. n = 1,240 (blue), 835 (red) and 1,003 (black). Black line, two-exponential fitting to the blue symbols. (f) Exemplary real-time traces showing synchronized FRET jumps with lipid composition 45:15:40 (mol/mol/mol) POPC:DOPS:cholesterol. The instances of initial FRET increase, marked by orange arrows, are at 4.8 and 6.2 s (top and bottom, respectively).
In one typical real-time trace of Ca2+-evoked fusion (Fig. 3a), the vesicle complex began with an initial E value of ~0.14 and started lipid mixing at t = 4.8 s (orange arrow) that reached the full-fusion state at E ≈ 0.72. Likewise, many vesicle complexes in the same imaging area started to show FRET increase (Fig. 3c, orange arrows) after the arrival of the Ca2+ wave (see Supplementary Fig. 5 online for more traces). As a result, the cumulative time histogram of these instances of initial FRET increase showed a rapid increase in number (Fig. 3b, blue symbols). In the first 5-s window (between t = 4.4 and 9.4 s), 37 out of 217 total vesicle complexes in the imaging area initiated fusion. Assuming first-order kinetics, we used two exponentials, A1(1 − exp−t/t1) + A2(1 − exp−t/t2), to fit the plot after the Ca2+ arrival at 4.4 s (Fig. 3b, red curve). The time constants (t1, t2) and the corresponding normalized population (A1, A2) were (8.87 s, 0.95 s) and (0.37, 0.01), respectively, indicating that the cumulative plot showed mainly a single time constant of ~8.9 s. The cumulative time histogram based on five independent flow experiments (total 1,240 vesicle complexes imaged) showed a time constant of 7.9 s (Fig. 3e, blue symbols and black curve). Overall, an appreciable fraction (~25%) of total vesicle complexes underwent Ca2+-induced membrane fusion events that were synchronized on the timescale of seconds. Control experiments flowing a buffer without Ca2+ showed negligible fusion (Fig. 3b, black symbols; 1,900 vesicle complexes). Furthermore, Mg2+ was ineffective in inducing membrane fusion in complexin-primed vesicle complexes (Fig. 3b, red symbols; 1,161 vesicle complexes).
Cholesterol is a major lipid species in the synaptic membranes whose content reaches as high as 40 molar percent of total lipids. Inclusion of 40 molar percent cholesterol while reducing 1,2-dioleoyl-sn-glycero-3-[phospho-l-serine] (DOPS) to 15 molar percent produced a cumulative time histogram nearly identical to that for vesicle complexes of palmitoyl-2-oleoyl-sn-glycero-3-phosphocholine (POPC):DOPS in molar ratio of 65:35 (Fig. 3e, red symbols; see Fig. 3f and Supplementary Fig. 5 for real-time traces). With this lipid composition, even when the Ca2+ concentration was reduced to 20 µM, which represents a typical peak Ca2+ concentration near the fusion active zone during neuronal stimulation24, more than 10% of the vesicle complexes showed Ca2+-triggered fusion (Supplementary Fig. 6 online). But simple reduction of negatively charged DOPS lipids from 35 molar percent to 15 molar percent in the absence of cholesterol largely abolished Ca2+-evoked fusion (Fig. 3e, black symbols), suggesting that high cholesterol in synaptic vesicles25 is essential for the Ca2+-responsiveness. Furthermore, such delicate dependence on the lipid composition suggests that our single-vesicle fusion system may be a good mimic of synaptic vesicle fusion. In addition, our results show that the hemifusion state is a substrate for rapid fusion induced by Ca2+ (Fig. 3d), well in line with recent in vivo imaging data26,27.
The percentages of Ca2+-responding vesicle complexes, 25% and 10%, were substantially underestimated, as we noted that only ~30% of total vesicle complexes were available for Ca2+-triggered fusion at the moment of the Ca2+ addition. In the in vitro fusion assay, we found that, on average, 35% of total vesicle complexes were fusion-inactive (Fig. 2h and Supplementary Fig. 7 online), probably owing to the absence of the auxiliary proteins, and 36% of total vesicle complexes had already become fully fused before Ca2+ was added (Supplementary Fig. 6b). Therefore, it seems that nearly 90% and 35% of the ‘fusable’ pool of vesicle complexes responded to 1 mM and 20 µM Ca2+, respectively, within the first 25-s window.
Fusion step-specific switching of complexin function
Our single-vesicle fusion analysis revealed the two-faceted function of complexin. At high concentrations, complexin reduced the probability of trans-SNARE complex formation. Once assembled into SNARE complexes, however, complexin strongly stimulated membrane fusion, which was accelerated about 100-fold by the addition of Ca2+. To gain further insight into the dual functions of complexin, we produced a double mutation (C105A R56C) in complexin I and attached a spin label at position 56. The EPR spectrum of this construct, when mixed with t-SNARE complexes, showed a broad spectral component reflecting the slow motion of the nitroxide side chain arising from direct interaction between complexin and the t-SNARE complex (Fig. 4a, blue arrow). The EPR spectra are shown in the absorbance mode instead of the derivative mode because the spectral broadening due to the tertiary interaction is better represented in the former than the latter11. For a negative control, we attached a spin label at the native cysteine at position 105 of complexin I. The EPR spectra of the Cys105–spin-labeled wild type did not show any change when incubated with t-SNARE vesicles (Fig. 4a, right inset), indicating that the broadening observed for the R56C spin-labeled mutant specifically reflected the interaction between complexin I and t-SNARE proteins. The spectral subtraction analysis28 gave a dissociation constant of ~50 µM, much weaker than complexin binding to the ternary SNARE complex. This weak interaction would lead to competition between v-SNARE and complexin for binding to t-SNAREs (Fig. 4b, gray circle). When highly expressed, complexin outnumbers v-SNARE, thereby inhibiting SNARE complex assembly. Such an inhibitory effect may have physiological function in some species, including Drosophila melanogaster29.
Figure 4.
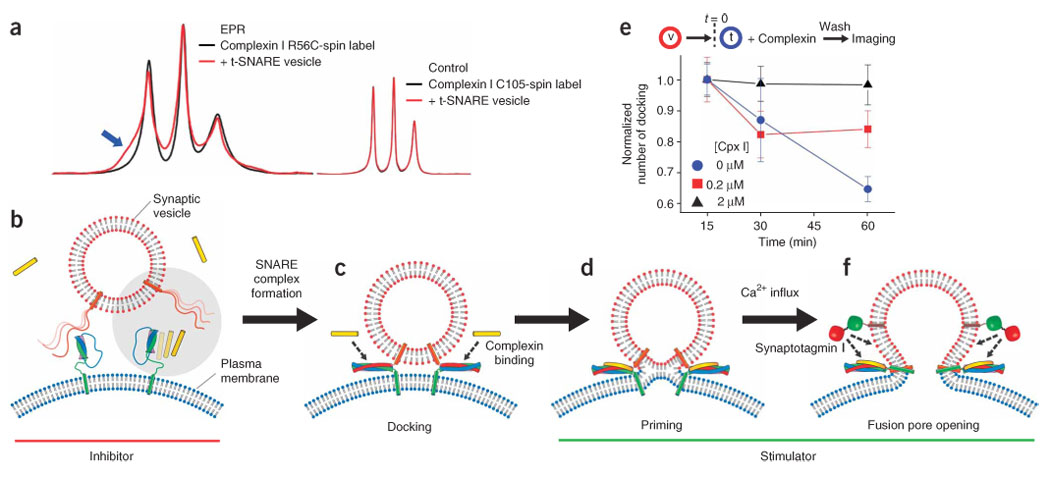
Molecular model of complexin function for Ca2+-triggered neurotransmitter release. (a) Room temperature EPR spectra of a spin-labeled complexin I mutant, C105A R56C spin label, incubated in fusion buffer (black trace) or mixed with solution of t-SNARE vesicles (red trace). The spectra are normalized with respect to the maximum heights of the central line but not with respect to the number of spins. Inset, EPR spectra of the complexin I wild type having the spin label attached to native Cys105. (b) Pre-docking stage: complexin competes with v-SNAREs for binding to t-SNAREs. At a high expression level, complexin has the effect of suppressing formation of trans-SNARE complexes (gray circle). (c) Docking stage: once trans-SNARE complexes are formed, synaptic vesicles are more tightly associated with the plasma membrane, and complexin binds to trans-SNARE complexes. (d) Priming stage: complexin lowers energy barriers for synaptic vesicle fusion in cooperation with neuronal SNAREs in part because of stabilization of SNARE complexes. (e) Time-course change of the number of docked t-SNARE vesicles. The sequence of experiments is the same as that for Figure 2. The numbers of docked t-SNARE vesicles at complexin I concentration [Cpx I] = 0 (blue circle), 0.2 (red square) and 2 µM (black triangle) were measured at t = 15, 30 and 60 min. Each case was normalized by the docking number measured at t = 15 min; error bars, s.d. (see also Supplementary Fig. 8). (f) Fusion-pore opening stage: triggered by Ca2+ influxes, action of Ca2+-sensing synaptotagmin I further lowers fusion energy barriers to achieve fast fusion-pore opening.
However, the primary function of complexin seems to be binding to trans-SNARE complexes and stimulating membrane fusion (Fig. 4c,d). Earlier structural studies4,5 positioned complexin as a potential fusion stimulator because complexin was thought to stabilize assembled SNARE complexes. Without complexin I, the number of docked t-SNARE vesicles considerably decreased with time (Fig. 4e, blue circles), reflecting disassembly of trans-SNARE complexes probably due to repulsion between t- and v-SNARE vesicles. In contrast, we observed even a moderate concentration of complexin I (2 µM) to have a noticeable effect of keeping trans-SNARE complexes from being disassembled (Fig. 4e, black triangles; see also Supplementary Fig. 8 online).
DISCUSSION
It is noteworthy that Ca2+ can trigger the fusion burst in the presence of complexin alone, without synaptotagmin I (ref. 30). We found that the observed Ca2+-triggered fusion should be attributed to a concerted action of complexin, SNARE complexes, and Ca2+ ions. The distribution of the initial E values for the vesicle complexes showing Ca2+-induced fusion had a major population between 0.2 and 0.5 (Fig. 3d), and this FRET range approximately corresponds to the hemifusion state19,22. The same FRET range could also be obtained using only SNARE complexes (Fig. 1b,c) but these FRET states did not show notable progression to full fusion in response to 1 mM Ca2+ (Fig. 1c and Supplementary Fig. 1b). Therefore, complexin bound to trans-SNARE complexes lowers the fusion energy barrier of two membranes. Then, further action of Ca2+ ions enables many vesicle complexes to finally overcome the fusion energy barrier, accelerating the fusion kinetics by another two orders of magnitudes (Fig. 3b, blue versus black symbols), which corresponds to reduction of the energy barrier by 2.8 kcal mol−1.
Several recent reports31,32 have detected the existence of an independent Ca2+-sensing mechanism for the asynchronous exocytosis mode. The molecular identity of this second pathway does not include any synaptotagmin isoforms32 and is yet to be identified. The timescale of the asynchronous mode is found to be hundreds of milliseconds, only one order of magnitude different from the timescale that we observe with SNAREs and complexin. Therefore, we speculate that the supramolecular complex consisting of SNARE complexes, phospholipids and complexin works as a substrate of Ca2+ for asynchronous release. The action of synaptotagmin I may be superimposable on the same vesicle pool to further lower the fusion activation energy (Fig. 4f). Such an action of synaptotagmin I (ref. 33) may be needed to push the synchrony level down to milliseconds, a requirement for synchronous neural communication.
Although observation of the inhibitory effect of complexin is reminiscent of the fusion clamp model19–21, the underlying fusion energetics suggested by our results is fundamentally different from that of the clamp model. In the fusion clamp model, SNARE complex assembly is thought to release sufficient free energy to overcome all the fusion energy barriers, so its energy release needs to be spring-loaded by a ‘clamp’ to gain control over the timing of fusion. Our data, however, suggest that the SNARE complexes should be intimately aided by complexin and lipid molecules to accelerate fusion and to increase the Ca2+ sensitivity (Fig. 2 and Fig. 3).
Very recently, the dual function of complexin, both as a stimulator and an inhibitor, has been proposed on the basis of physiological experiments17. Our results provide the molecular mechanism underlying the dual function as well as switching between the two. The EPR analyses find that complexin has two divergent interaction modes with SNAREs: a low affinity interaction with the t-SNARE complex and a high affinity binding to the ternary SNARE complex4. Using these different interaction modes, complexin switches between different functions, inhibitory before but stimulatory after SNARE assembly, as our single-vesicle fusion data demonstrated.
Additionally, we note that many of our findings were made possible by the single-vesicle fusion assay. In the proteoliposome fusion systems, docking requires much longer time than the fusion process itself22. Bulk ensemble assays therefore detect primarily changes in the docking kinetics and thus the inhibitory effect of complexin (Supplementary Fig. 9 online), whereas the subsequent fusion kinetics and the role of complexin as a fusion stimulator would be very difficult to observe in bulk. In contrast, in the single-vesicle FRET assay, docking and fusion steps are clearly distinguished because undocked t-SNARE vesicles are invisible in our imaging system. As a result, we were able to observe real-time ‘triggering’ of fusion process by Ca2+ flow and to study the synchrony level of fusion events in a given pool of single-vesicle complexes. Our assay should be applicable to the studies of other fusion regulators of the synaptic membrane fusion, including synaptotagmin I. However, we note that studying syntatotagmin I offers many challenges owing to its ability to induce vesicle clustering30 as well as the difficulty in steering the vectorial interaction with the target membrane34.
METHODS
Protein expression and purification
Recombinant neuronal SNARE proteins from rat (normally expressed in the brain) syntaxin HT (amino acids 168–288 of syntaxin 1A, lacking the Habc domain), SNAP-25 (amino acids 1–206 with four native cysteines replaced by alanines) and VAMP2 (amino acids 1–116) were expressed as N-terminal glutathione-S-transferase fusion proteins. Recombinant proteins were expressed in Escherichia coli Rosetta (DE3) pLysS (Novagene). The cells were grown at 37 °C in LB medium with 100 µg ml−1 ampicillin until the absorbance at 600 nm reached 0.6–0.8. The cells were further grown for 4–6 hours after adding IPTG (0.5 mM final concentration), at 16 °C for syntaxin HT and VAMP2 or at 24 °C for SNAP-25 and complexin I. We purified the proteins using glutathione-agarose chromatography. Cell pellets were resuspended in 10 ml PBS, pH 7.4, containing 0.5% (v/v) Triton X-100, with final concentrations of 1 mM 4-(2-aminoethyl)-benzenesulfonyl fluoride (AEBSF), 5 mM DTT. Cells were broken by sonication in an ice bath and centrifuged at 13,000g for 20 min at 4 °C. The supernatant was mixed with 2 ml glutathione-agarose beads in PBS and nutated in the cold room (4 °C) for 2 h. The proteins were then cleaved by thrombin in cleavage buffer (50 mM Tris HCl, 150 mM NaCl, pH 8.0) for syntaxin, SNAP-25 and VAMP2, or cleaved by thrombin in HEPES buffer (25 mM HEPES, 100 mM KCl, pH 7.4) for complexin I. We added n-octyl-d-glucopyranoside at 0.8 g per 100 ml for syntaxin and VAMP2. Purified proteins were examined with 15% SDS-PAGE, and the purity was at least 90% for all proteins.
Membrane reconstitution
Unilamellar vesicles containing 1-palmitoyl-2-oleoyl-sn-glycero-3-phosphocholine (POPC), 1,2-dioleoyl-sn-glycero-3-[phospho-l-serine] (DOPS) and cholesterol (all purchased from Avanti Polar Lipids) and doped with 2 molar percent DiI (1,1′-dioctadecyl-3,3,3′,3′-tetramethylindocarbocyanine perchlorate; Molecular Probes/Invitrogen) were formed by using the extrusion method (MiniExtruder, Avanti Polar Lipids). Syntaxin HT and SNAP-25 were mixed at room temperature (20–22 °C) for about 1 h to allow the formation of t-SNARE complexes. The pre-formed t-SNARE proteins were then reconstituted into the unilamellar vesicles through dialysis. The v-SNARE protein VAMP2 was reconstituted into a different population of unilamellar vesicles that were doped with 2 molar percent DiD (1,1′-dioctadecyl-3,3,3′,3′-tetramethylindodicarbocyanine perchlorate; Molecular Probes) and 0.1 molar percent biotinylated lipids, 1,2-dipalmitoyl-sn-glycero-3-phosphoethanolamine-N-(biotinyl) (Avanti Polar Lipids). For membrane reconstitution, proteins were mixed with vesicles at the protein-to-lipid molar ratio of 1:200 with ~0.8 g per 100 ml OG in buffer at room temperature for 20 min. The mixture was diluted two times with dialysis buffer (25 mM HEPES, 100 mM KCl, 3% (w/v) glycerol, pH 7.4) and then was dialyzed against 2 liters of dialysis buffer at 4 °C overnight. After dialysis, the vesicles were treated with SM-2 beads (BioRad) once and centrifuged at 10,000g for 5 min to remove protein and lipid aggregates.
Single-vesicle fusion assay
Details of the single-vesicle FRET imaging have been described22. Briefly, a quartz slide was coated with 99:1 (mol/mol) PEG:biotin-PEG (Laysan Bio) to eliminate nonspecific binding of vesicles. The slide was then placed at the bottom of a flow chamber and coated with neutravidin. The v-SNARE vesicles were immobilized on this PEG-treated surface through specific biotin-neutravidin binding by incubation at 160 pM [vesicle] for 15 minutes. The t-SNARE vesicles were diluted to a final vesicle concentration of 200 pM, mixed with preset amounts of complexin I, and injected into the flow chamber for reaction. Such a low concentration of t-SNARE vesicle minimizes interaction of more than one t-SNARE vesicle with a single v-SNARE vesicle. Fusion events on the surface were monitored in a wide-field TIR fluorescence microscope (IX-71, Olympus) using an electron multiplying charge-coupled device camera (iXon DV 887, Andor Technology). All measurements were made at 37 (± 2) °C in fusion buffer (25 mM HEPES, 100 mM KCl, pH 7.4). Single fusion events were visually identified using IDL (Research Systems), and the FRET distribution and the time trajectories of fusion dynamics were analyzed with MATLAB (Mathwork’s programs available upon request). For the real-time tracking experiments in Figure 3e,f, an oxygen-scavenging system consisting of 1 mg ml−1 glucose oxidase (Sigma), 0.4% (w/v) d-glucose (Sigma), 0.04 mg ml−1 catalase (Roche) and 1% (v/v) 2-mercaptoethanl (Acros Organics) was used when flowing the fusion buffer with Ca2+. The use of the oxygen-scavenging system slowed down photo-bleaching of the DiI and DiD dyes (Supplementary Fig. 5) without affecting the fusion reaction.
Spin labeling and electron paramagnetic resonance measurements
We prepared two cysteine mutants of complexin I, R48C C105A and R56C C105A, using QuickChange site-directed mutagenesis kit (Stratagene). The DNA sequences were confirmed by the DNA facility in Iowa State University. The complexin I mutants were labeled with (1-oxyl-2,2,5,5-tetramethylpyrrolinyl-3-methyl)methanethiosulfonate (MTSSL) spin label at 4 °C while the protein was bound to the GST-agarose beads. To remove unreacted free spin label, the beads containing complexin I were extensively washed with cleavage buffer. The labeled complexin I was cleaved by thrombin. The protein concentration and the spin-labeling efficiency were determined by a DC protein assay kit (BioRad) and the 50 µM 2,2,6,6-tetramethyl-4-piperidine N-oxide (TEMPO) standard, respectively. The spin labeling efficiency was more than 75%. EPR spectra were obtained using a Bruker ESP 300 spectrometer equipped with a low-noise microwave amplifier (Miteq) and a loop-gap resonator (Medical Advances). The modulation amplitude was set to be no greater than one-fourth of the line width. Spectral data were collected at room temperature in the first-derivative mode with the 1 mW microwave power.
Supplementary Material
ACKNOWLEDGMENTS
We thank J. Rizo (University of Texas Southwestern Medical Center) for kindly providing the plasmid for complexin I. T.-Y.Y. thanks C. Joo and J. Ryu for help with preparing illustrations and critical reading of the manuscript. This work was supported by US National Institutes of Health grants (R21 GM074526 to T.H. and GM051290-14 to Y.-K.S.).
Footnotes
Note: Supplementary information is available on the Nature Structural & Molecular Biology website.
Reprints and permissions information is available online at http://npg.nature.com/reprintsandpermissions/
References
- 1.McMahon HT, Missler M, Li C, Sudhof TC. Complexins: cytosolic proteins that regulate SNAP receptor function. Cell. 1995;83:111–119. doi: 10.1016/0092-8674(95)90239-2. [DOI] [PubMed] [Google Scholar]
- 2.Ishizuka T, Saisu H, Odani S, Abe T. Synaphin: a protein associated with the docking/fusion complex in presynaptic terminals. Biochem. Biophys. Res. Commun. 1995;213:1107–1114. doi: 10.1006/bbrc.1995.2241. [DOI] [PubMed] [Google Scholar]
- 3.Reim K, et al. Structurally and functionally unique complexins at retinal ribbon synapses. J. Cell Biol. 2005;169:669–680. doi: 10.1083/jcb.200502115. [DOI] [PMC free article] [PubMed] [Google Scholar]
- 4.Pabst S, et al. Rapid and selective binding to the synaptic SNARE complex suggests a modulatory role of complexins in neuroexocytosis. J. Biol. Chem. 2002;277:7838–7848. doi: 10.1074/jbc.M109507200. [DOI] [PubMed] [Google Scholar]
- 5.Chen X, et al. Three-dimensional structure of the complexin/SNARE complex. Neuron. 2002;33:397–409. doi: 10.1016/s0896-6273(02)00583-4. [DOI] [PubMed] [Google Scholar]
- 6.Rothman JE. Mechanisms of intracellular protein transport. Nature. 1994;372:55–63. doi: 10.1038/372055a0. [DOI] [PubMed] [Google Scholar]
- 7.Brunger AT. Structure and function of SNARE and SNARE-interacting proteins. Q. Rev. Biophys. 2005;38:1–47. doi: 10.1017/S0033583505004051. [DOI] [PubMed] [Google Scholar]
- 8.Jackson MB, Chapman ER. Fusion pores and fusion machines in Ca2+-triggered exocytosis. Annu. Rev. Biophys. Biomol. Struct. 2006;35:135–160. doi: 10.1146/annurev.biophys.35.040405.101958. [DOI] [PubMed] [Google Scholar]
- 9.Weber T, et al. SNAREpins: minimal machinery for membrane fusion. Cell. 1998;92:759–772. doi: 10.1016/s0092-8674(00)81404-x. [DOI] [PubMed] [Google Scholar]
- 10.Sutton RB, Fasshauer D, Jahn R, Brunger AT. Crystal structure of a SNARE complex involved in synaptic exocytosis at 2.4 A resolution. Nature. 1998;395:347–353. doi: 10.1038/26412. [DOI] [PubMed] [Google Scholar]
- 11.Poirier MA, et al. The synaptic SNARE complex is a parallel four-stranded helical bundle. Nat. Struct. Biol. 1998;5:765–769. doi: 10.1038/1799. [DOI] [PubMed] [Google Scholar]
- 12.Sudhof TC. The synaptic vesicle cycle. Annu. Rev. Neurosci. 2004;27:509–547. doi: 10.1146/annurev.neuro.26.041002.131412. [DOI] [PubMed] [Google Scholar]
- 13.Jahn R, Scheller RH. SNAREs–engines for membrane fusion. Nat. Rev. Mol. Cell Biol. 2006;7:631–643. doi: 10.1038/nrm2002. [DOI] [PubMed] [Google Scholar]
- 14.Archer DA, Graham ME, Burgoyne RD. Complexin regulates the closure of the fusion pore during regulated vesicle exocytosis. J. Biol. Chem. 2002;277:18249–18252. doi: 10.1074/jbc.C200166200. [DOI] [PubMed] [Google Scholar]
- 15.Itakura M, Misawa H, Sekiguchi M, Takahashi S, Takahashi M. Transfection analysis of functional roles of complexin I and II in the exocytosis of two different types of secretory vesicles. Biochem. Biophys. Res. Commun. 1999;265:691–696. doi: 10.1006/bbrc.1999.1756. [DOI] [PubMed] [Google Scholar]
- 16.Tang J, et al. A complexin/synaptotagmin 1 switch controls fast synaptic vesicle exocytosis. Cell. 2006;126:1175–1187. doi: 10.1016/j.cell.2006.08.030. [DOI] [PubMed] [Google Scholar]
- 17.Xue M, et al. Distinct domains of complexin I differentially regulate neurotransmitter release. Nat. Struct. Mol. Biol. 2007;14:949–958. doi: 10.1038/nsmb1292. [DOI] [PMC free article] [PubMed] [Google Scholar]
- 18.Reim K, et al. Complexins regulate a late step in Ca2+-dependent neurotransmitter release. Cell. 2001;104:71–81. doi: 10.1016/s0092-8674(01)00192-1. [DOI] [PubMed] [Google Scholar]
- 19.Schaub JR, Lu X, Doneske B, Shin YK, McNew JA. Hemifusion arrest by complexin is relieved by Ca2+-synaptotagmin I. Nat. Struct. Mol. Biol. 2006;13:748–750. doi: 10.1038/nsmb1124. [DOI] [PubMed] [Google Scholar]
- 20.Giraudo CG, Eng WS, Melia TJ, Rothman JE. A clamping mechanism involved in SNARE-dependent exocytosis. Science. 2006;313:676–680. doi: 10.1126/science.1129450. [DOI] [PubMed] [Google Scholar]
- 21.Melia TJ., Jr Putting the clamps on membrane fusion: how complexin sets the stage for calcium-mediated exocytosis. FEBS Lett. 2007;581:2131–2139. doi: 10.1016/j.febslet.2007.02.066. [DOI] [PubMed] [Google Scholar]
- 22.Yoon TY, Okumus B, Zhang F, Shin YK, Ha T. Multiple intermediates in SNARE-induced membrane fusion. Proc. Natl. Acad. Sci. USA. 2006;103:19731–19736. doi: 10.1073/pnas.0606032103. [DOI] [PMC free article] [PubMed] [Google Scholar]
- 23.Xu Y, Zhang F, Su Z, McNew JA, Shin YK. Hemifusion in SNARE-mediated membrane fusion. Nat. Struct. Mol. Biol. 2005;12:417–422. doi: 10.1038/nsmb921. [DOI] [PubMed] [Google Scholar]
- 24.Koh TW, Bellen HJ. Synaptotagmin I, a Ca2+ sensor for neurotransmitter release. Trends Neurosci. 2003;26:413–422. doi: 10.1016/S0166-2236(03)00195-4. [DOI] [PubMed] [Google Scholar]
- 25.Takamori S, et al. Molecular anatomy of a trafficking organelle. Cell. 2006;127:831–846. doi: 10.1016/j.cell.2006.10.030. [DOI] [PubMed] [Google Scholar]
- 26.Zampighi GA, et al. Conical electron tomography of a chemical synapse: vesicles docked to the active zone are hemi-fused. Biophys. J. 2006;91:2910–2918. doi: 10.1529/biophysj.106.084814. [DOI] [PMC free article] [PubMed] [Google Scholar]
- 27.Wong JL, Koppel DE, Cowan AE, Wessel GM. Membrane hemifusion is a stable intermediate of exocytosis. Dev. Cell. 2007;12:653–659. doi: 10.1016/j.devcel.2007.02.007. [DOI] [PMC free article] [PubMed] [Google Scholar]
- 28.Thorgeirsson TE, Russell CJ, King DS, Shin YK. Direct determination of the membrane affinities of individual amino acids. Biochemistry. 1996;35:1803–1809. doi: 10.1021/bi952300c. [DOI] [PubMed] [Google Scholar]
- 29.Huntwork S, Littleton JT. A complexin fusion clamp regulates spontaneous neurotransmitter release and synaptic growth. Nat. Neurosci. 2007;10:1235–1237. doi: 10.1038/nn1980. [DOI] [PubMed] [Google Scholar]
- 30.Arac D, et al. Close membrane-membrane proximity induced by Ca2+-dependent multivalent binding of synaptotagmin-1 to phospholipids. Nat. Struct. Mol. Biol. 2006;13:209–217. doi: 10.1038/nsmb1056. [DOI] [PubMed] [Google Scholar]
- 31.Sun J, et al. A dual-Ca2+-sensor model for neurotransmitter release in a central synapse. Nature. 2007;450:676–682. doi: 10.1038/nature06308. [DOI] [PMC free article] [PubMed] [Google Scholar]
- 32.Saraswati S, Adolfsen B, Littleton JT. Characterization of the role of the Synaptotagmin family as calcium sensors in facilitation and asynchronous neurotransmitter release. Proc. Natl. Acad. Sci. USA. 2007;104:14122–14127. doi: 10.1073/pnas.0706711104. [DOI] [PMC free article] [PubMed] [Google Scholar]
- 33.Rhee JS, et al. Augmenting neurotransmitter release by enhancing the apparent Ca2+ affinity of synaptotagmin 1. Proc. Natl. Acad. Sci. USA. 2005;102:18664–18669. doi: 10.1073/pnas.0509153102. [DOI] [PMC free article] [PubMed] [Google Scholar]
- 34.Stein A, Radhakrishnan A, Riedel D, Fasshauer D, Jahn R. Synaptotagmin activates membrane fusion through a Ca2+-dependent trans interaction with phospholipids. Nat. Struct. Mol. Biol. 2007;14:904–911. doi: 10.1038/nsmb1305. [DOI] [PubMed] [Google Scholar]
Associated Data
This section collects any data citations, data availability statements, or supplementary materials included in this article.