

Abstract
We investigate Ornstein-Uhlenbeck and diffusion processes with variable drift rates as models of evidence accumulation in a visual discrimination task. We derive power-law and exponential drift-rate models and characterize how parameters of these models affect the psychometric function describing performance accuracy as a function of stimulus strength and viewing time. We fit the models to psychophysical data from monkeys learning the task to identify parameters that best capture performance as it improves with training. The most informative parameter was the overall drift rate describing the signal-to-noise ratio of the sensory evidence used to form the decision, which increased steadily with training. In contrast, secondary parameters describing the time course of the drift during motion viewing did not exhibit steady trends. The results indicate that relatively simple versions of the diffusion model can fit behavior over the course of training, thereby giving a quantitative account of learning effects on the underlying decision process.
1 Introduction
There is increasing evidence from in vivo recordings in monkeys that oculomotor decision making in the brain mimics a drift-diffusion (DD) process, with neural activity that rises to a threshold before movement initiation [1, 2, 3]. In one well-studied task, monkeys are trained to decide the direction of motion of a stochastic visual stimulus (a field of randomly-moving dots, a fraction of which move coherently in one of two possible directions), and to indicate their decision with an eye movement. As with other tasks that involve a trade-off between speed and accuracy, behavioral response times and error rates are well fit by sequential sampling models, including those based on random walk and diffusion processes [4, 5, 6, 7, 8, 9]. Consistent with these models, neural activity in several brain areas involved in preparing eye movements, including the lateral intraparietal area (LIP), frontal eye field and superior colliculus [10, 11, 12, 13], exhibits an accumulation over time of the motion evidence represented in the middle temporal area (MT) of extrastriate visual cortex. In area LIP, this activity reaches a threshold level just prior to the eye-movement response [14]. These results have renewed interest in statistical decision theory as a framework for understanding how the brain forms perceptual decisions that guide behavior.
The drift-diffusion (DD) process is a continuum limit of the discrete sequential probability ratio test (SPRT), which is optimal for stationary data in the sense that it renders decisions of specified average accuracy for the smallest number of observations [15, 16]. In this theoretical framework decisions are made by comparing integrated weights of evidence, expressed by the logarithm of the likelihood ratio. Leaky accumulator neural network models [17] can be reduced to DD processes under certain assumptions, and explicit predictions of average decision times and error rates derived from them can be used to optimally solve the speed-accuracy tradeoff problem for two-alternative forced-choice (2AFC) tasks [18, 19]. A recent modeling study further strengthens the link between spiking neurons in area LIP and accumulator models [20], although it suggests that nonlinear analogs of the Ornstein-Uhlenbeck (OU) process may be necessary to model the evidence accumulation process.
To date, most studies applying DD models to performance on simple sensory-motor tasks have considered only well-trained subjects. Here we investigate extensions of simple DD processes to model psychophysical performance during training, when errors are more prevalent. We use data collected from monkeys as they were being trained on a one-interval, 2AFC version of the direction discrimination task in which motion strength or coherence, direction (two alternatives separated by 180 deg), and viewing time (typically between 100 and 1400 ms, during which time the monkey was required to maintain fixation) were varied randomly from trial to trial (See Gold and Shadlen [21, 22] for details). Note that trial-to-trial changes in coherence imply variability in signal-to-noise ratio (SNR), which violates the assumption of statistical stationarity on which the optimality of the SPRT relies [16, 19]. Moreover, unlike other related studies [23, 24, 25], this task design does not measure response times and instead focuses on the dynamics of the decision process as a function of viewing time.
This paper is organized as follows. In §2 we review the OU and DD models, derive explicit expressions for probability distributions of sample paths, and describe how the resulting accuracy of decisions depends on viewing time and parameters describing the DD model. In §3 we further explore the neural and empirically-fitted parameters required to help explain behavior during training and show that an earlier model is equivalent to a DD process with a power-law drift rate. In §§3.3–3.4 we examine a DD model with exponential drift rate and an OU model, arguing that these provide additional flexibility and may represent a more realistic neural implementation. In §4 we fit psychophysical data from monkeys learning the direction discrimination task, exploring which parameterizations best describe performance and discussing the utility of OU/DD models for describing trends in learning. §5 concludes with comments on the role of such high-level models in neuroscience.
2 Ornstein-Uhlenbeck and drift-diffusion models
The accumulation of evidence from noisy streams of data can be modeled by stochastic differential equations (SDEs) that are in turn related to statistical tests [2, 18]. In particular, it is possible to determine from which one of two probability distributions p1(y), p2(y) a set of N successive samples has been drawn by forming the product of likelihood ratios
| (1) |
noting whether RN lies above or below a threshold Z (usually Z = 1) and deciding for p1 or p2 respectively (this is a fixed-sample-size Neyman-Pearson test [26]). Taking logarithms turns (1) into a sum, which becomes a stochastic integral in the continuum limit, so that the logarithmic likelihood ratio x(t) ~log RN evolves as a DD process:
| (2) |
in which the drift rate A represents the average weight of evidence in favor of alternative 1 (A > 0), or alternative 2 (A < 0). The key parameter is the signal-to-noise ratio (SNR) A/c, which is related to the distance between the means of p1(y) and p2(y) and their variances [2, 19]. For the direction discrimination task, the SNR describes the noisy activity of direction-selective neurons in area MT that represent the sensory evidence used in the decision [27, 28].
Previous work focused on the variable sample size or “free response” SPRT and the associated DD process in which decisions correspond to sample paths crossing thresholds [19]. Here, in keeping with the predetermined viewing times T used in the present study, we compute accuracy as the probability that x(T) lies above or below zero, corresponding to RN = Z = 1 in (1) above (the interrogation protocol of [19]). First we introduce a slight generalization of (2), an Ornstein-Uhlenbeck (OU) process with time-varying drift rate and a leak rate λ:
| (3) |
The probability distribution p(x, t) of solutions of (3) is governed by the forward Kolmogorov or Fokker-Planck equation [29]:
| (4) |
in which the initial condition p(x, 0) is given by a suitable distribution of initial data for (3). For a Gaussian centered at the starting point μ0,
| (5) |
the solution of (4) remains Gaussian as it evolves:
| (6) |
| (7) |
For stable Ornstein-Uhlenbeck processes (λ < 0), the variance ν(t) → c2/|2λ| as t → ∞, and for drift diffusion processes (λ = 0), the mean and variance simplify to:
| (8) |
Assuming that the net integrated evidence μ(T) > 0, the accuracy of a decision rendered at time T is given by the psychometric function (PMF):
| (9) |
which depends on viewing time T and on the stimulus and noise terms via the functions μ(t) and ν(t) of equations (7–8). We shall introduce explicit models for noise variance c2 and for how stimulus strength (motion coherence) influences the drift rate A(t), and hence μ(t) and ν(t), in §3 below.
PMFs such as (9) are typically sigmoidal with respect to stimulus strength S and are conventionally characterized by four parameters: lower and upper asymptotes, threshold, and slope, as illustrated in Figure 1). (To emphasise dependence on S and T, for this figure only we adopt the notation P(S, T)) The lower asymptote is the guess rate, which for a forced-choice task is the reciprocal of the number of alternatives. The upper asymptote is the lapse rate at high stimulus strengths. Threshold is defined as the stimulus strength corresponding to a particular level of accuracy, taken here as 76% correct, equivalent to d-prime = 1 for a 2AFC task [30]. Slope is the derivative ∂P/∂S at threshold, which measures the rate of change of accuracy and provides a confidence interval of threshold [31]. We shall compute slope numerically from the PMFs of (9).
Figure 1.
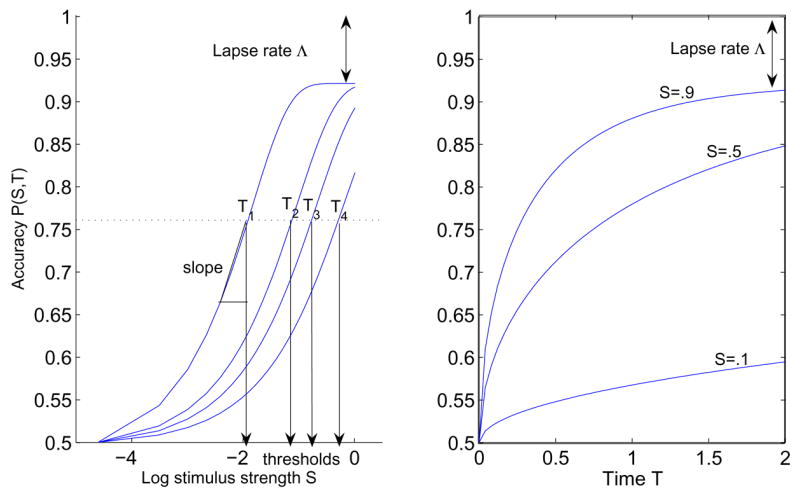
Left: A PMF P(S, T) plotted against stimulus strength S for viewing times T1 = 10s, T2 = 2s, T3 = 1s and T4 = 0.4s. Lower asymptote is 50% for unbiased 2AFC and upper asymptote is 1 − Λ ; thresholds and slope are labeled. Right: P(S, T) versus viewing time T for three stimulus strengths.
We can visualize the dependence of accuracy on viewing time T by plotting the PMF as a function of S for selected T’s (Figure 1(a)) or as a function of T for selected S’s (Figure 1(b)). Because we focus on the temporal dynamics of the drift process in this paper, we henceforth plot PMFs as functions of viewing time, as in Figure 1(b), and we shall write P(T), leaving the stimulus-dependence implicit. We shall also compute threshold and slope parameters for a range of viewing times used in the psychophysical experiments (0.2s, 0.6s, 1.0s, and 1.4s), thus summarizing the family of curves of Figure 1(a). These parameters will allow us to explore how parameters describing stimulus and noise in the DD model affect P(T).
3 Psychometric functions and variable drift rates
To parameterize performance on the direction discrimination task, we must express P(T) explictly in terms of motion strength or coherence C (the fraction of random dots moving coherently in one direction) and other parameters that enter the DDM, as well as viewing time T. In §2 we observed that the PMF predicted by the DDM depends on drift rate A(t) and noise level c via equations (7–9). We now describe a model that relates these quantities to neural firing rates and to C.
Following [21, 22], and drawing on psychophysical, electrophysiological and computational studies of monkeys performing the motion detection task [27, 28, 32], we assume that performance is based on the accumulation, in LIP or other areas, of coherence-dependent responses from motion-sensitive neurons in area MT. We set
| (10) |
(cf. equation (6)), where
| (11) |
(a bar is added to the μ of [21] to distinguish it from the function μ(t) of §2). Here Mc and Mi represent the accumulated responses of pools of MT neurons that respectively encode the correct and incorrect directions of motion; φ is a dimensionless constant derived from neural recordings that scales the variance by the mean, and angle brackets 〈 · 〉 indicate expected values. Accumulated MT responses are modeled as (r0 + aCm)T, where r0 is the baseline firing rate (in spikes/s) for zero coherence and C is motion coherence (which for simplicity is set to zero for sensors tuned for the incorrect direction). The mean responses in (11) therefore depend upon C and T as follows:
| (12) |
Note that the expected difference μ̄ is directly proportional to Cm, i.e. the drift rate A = aCm reflects the combined contributions of excited responses from the correct sensors and inhibited responses from the incorrect (opposite) sensors.
The neural parameters can be derived from direct recordings, and following [21, 22], we take r0 = 10 spikes/s and φ= 0.3 for the remainder of this paper. The motion coherence C of the stimulus is set by the experimenter, and the drift rate scale factor a and exponent m will be fitted to behavioral data. All the parameters in (10) being thus determined via (11–12), the integral can be evaluated explicitly as in (9) to yield
| (13) |
3.1 Effect of stimulus strength
The drift rate scale factor a has the most striking effect of any parameter in this paper, as illustrated in Figure 2, where it varies from 2 to 20 in increments of 2 for C = 1 and m = 1. As we show in §4, increase in a also accounts for most of the improvement in performance seen in the data. The middle panel shows the rapid drop in threshold as a increases for four different viewing times T. As expected, shorter times have higher thresholds.
Figure 2.
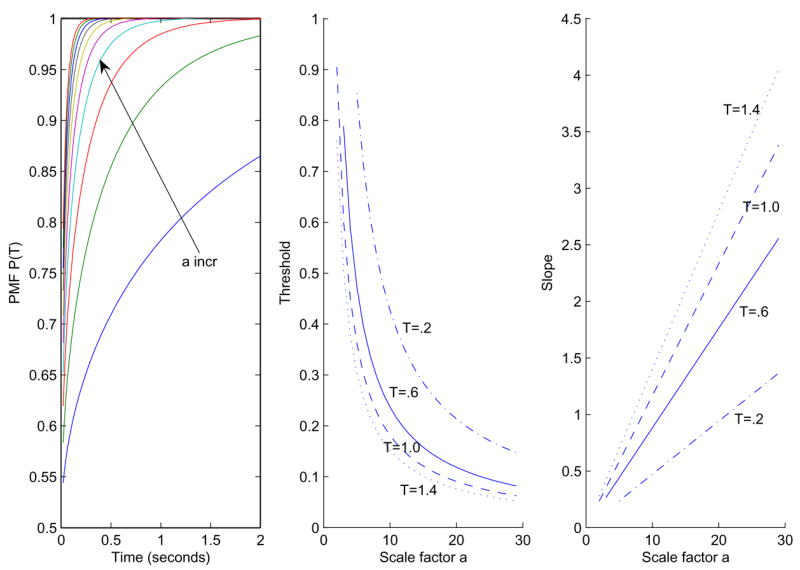
Effects of parameter a on the PMF P(T). Left: a varies from 2 to 20 in increments of 2 with C = 1 and m = 1. Center: the effect of a on threshold (middle) for T = 0.2s (dash-dot), T = 0.6s (solid), T = 1.0s (dashed), T = 1.4s (dotted). Right: slopes at the corresponding thresholds.
The coherence exponent m allows nonlinear scaling of stimulus strength S. Its value is near unity for trained animals [21], as in the proportional-rate diffusion model of [23], but it can differ from unity early in training. As m decreases, high coherences are squeezed into the upper range of drift rates and low coherences are stretched over the lower range, implying that it is easier to distinguish among low coherences, as illustrated in Figure 3. The left panel shows the change in accuracy with m, for a = 2 and three coherence values. Decreases in m improve performance for all C < 1, although the effect is stronger for small C and performance is independent of m for C = 1. Threshold increases with m: higher coherences are required to achieve the same accuracy.
Figure 3.
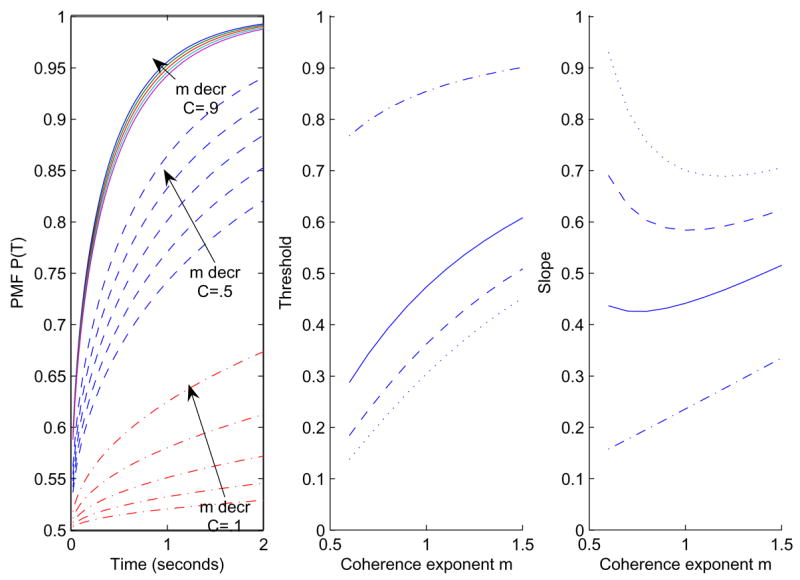
Effect of parameter m on the PMF P(T). Left: m varies from 1.6 to 0.8 for C = 0.9 (solid), C = 0.5 (dashed) and C = 0.1 (dash-dot), with a = 5. Center: the effect of m on threshold for a = 5 and T = 0.2s (dash-dot), T = 0.6s (solid), T = 1.0s (dashed) and T = 1.4s (dotted). Right: the corresponding slopes.
3.2 Power-law drift rates
Gold and Shadlen [21, 22] modify (12) as follows:
| (14) |
introducing the exponent n to more closely examine the time dependence of behavioral accuracy (note that this differs from the power-law dependence of response time on stimulus strength in Piéron’s Law [23]). Under this equation (13) becomes
| (15) |
For trained animals n is found to be near unity, implying linear accumulation of information over time as in equation (12) [21, 22]. This strategy is appropriate for the task because the visual stimulus provides motion information uniformly over time. However, earlier in training attention might wax or wane during motion viewing, resulting in values of n that differ from one. For example, n < 1 would imply that the subject extracts most of the motion information used for the decision early in stimulus viewing. Conversely, n > 1 implies that more attention is paid later in stimulus viewing.
We now show that the Tn time dependence in (14–15) is equivalent to a variable drift rate. To determine the functional form for A(t) that yields Tn dependence, we observe that the PMFs are determined solely by the arguments of the error function in equations (13) and (9); i.e., the ratios
| (16) |
in the Gold-Shadlen and OU/DD cases respectively. Assuming that these expressions hold for all T = t ≥ 0 and equating them produces equations that determine, or at least constrain, A(t) and other parameters describing the OU/DD process.
For example, taking λ = 0 and assuming that ν0 = 0 (a DD process with all trials starting from identical initial conditions x(0) = μ0), we obtain:
| (17) |
which may be rearranged to read
| (18) |
Setting t = 0 we find that μ0 = 0 (the initial condition should be unbiased [19]) and differentiating (18) with respect to t yields the power law drift rate:
| (19) |
To match the two formulations given the parallel construction of the noise term above and in §2, we set in the LHS of (17), so that
| (20) |
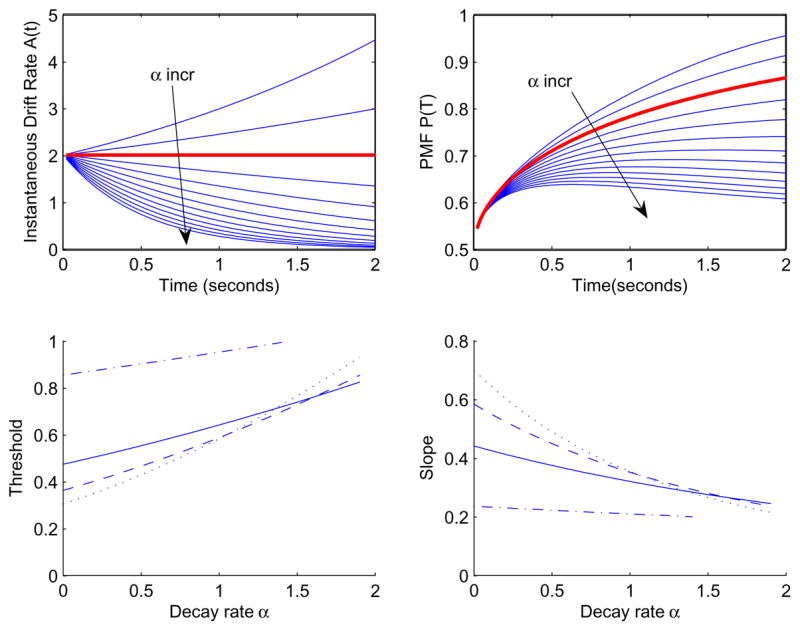
For n = 1 we have the constant-drift DDM with A(t) ≡ aCm, and for any n < 1 A(t) has an integrable singularity at t = 0 and decays as a power law with increasing t. Figure 4 shows examples of drift rates computed from (19) and the corresponding PMFs (15) for n ranging from − 0.4 to 1.4 and with C = 1, m = 1 and a = 2, so that
Figure 4.
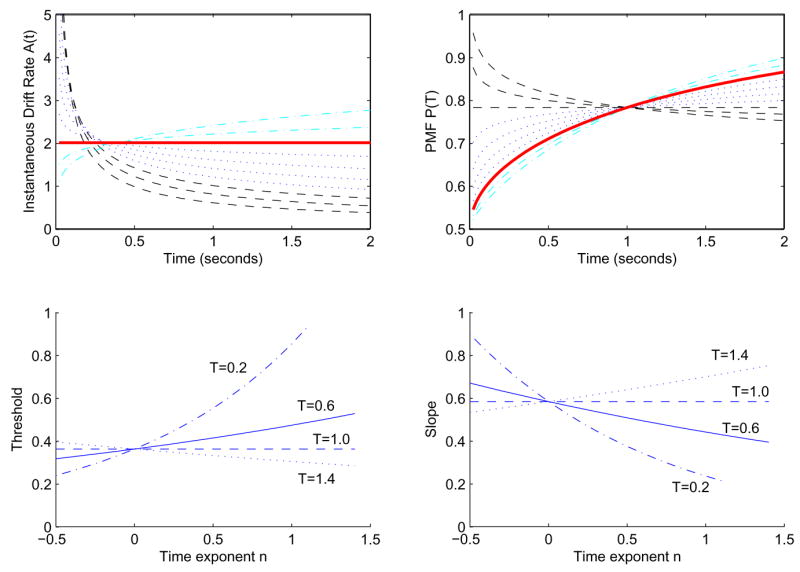
Drift rates A(t) (top left) and PMFs (top right) for exponents n from − 0.4 to 0 (dashed), 0.2 to 0.8 (dotted), 1 (solid), and 1.2 to 1.4 (dash-dotted) in steps of 0.2. Here a = 2, C = 1, and m = 1. Other parameters being fixed, all the accuracy curves cross at t = 1. Bottom left: the effect of n on threshold for a = 5, m = 1, and T = 0.2s (dash-dot), T = 0.6s (solid), T = 1.0s (dashed), T = 1.4s (dotted). Bottom right: the corresponding slopes.
| (21) |
(recall that r0 = 10 spikes/s and φ= 0.3 throughout).
With other parameters fixed, all accuracy curves cross at t = 1 because the argument of the error function is aCmT(n+1)/2 (cf. (18)), although drift rates do not intersect at a common point. The n = 0.2 and 0.4 cases (dotted) show rapid increases in accuracy followed by a sharp leveling off, but, in addition to the singularity in the drift rate at t = 0, a potentially troubling result is that P(T) increases more rapidly for T < 1 as n decreases. It seems unreasonable that subjects that benefit little from longer viewing times, perhaps due to loss of attention, should outperform better integrators at short times. Since the exponent n appears only in the PMF as a power of T, this model always exhibits such “crossover” behavior. The thick solid line corresponds to constant drift (n = 1), and the dashed-dotted lines to values of n > 1.
The bottom row of Figure 4 illustrates the crossover behavior in terms of threshold and slope. For T < 1 (dash-dot and solid), threshold increases with n, indicating decrease in performance, although n → 1 ostensibly represents improvement. In contrast, the T = 1.4 s case shows a decrease in threshold as n increases, as expected. The interpretation of n thus changes with the choice of T for threshold, and for most viewing times, the interpretation is wrong. Note that the slopes all cross at n = 0, for which the psychometric function does not change with time.
3.3 Exponential drift rates
The temporal evolution of many neural and other biological process can be modeled by exponential functions. Moreover, differential equations linearized near equilibria necessarily have exponential solutions, prompting us to consider drift rates of the form
| (22) |
These have intial and asymptotic values
| (23) |
provided α ≥ 0, and drift rates are constant if d = 1 or α = 0.
With zero initial bias and variance (μ0 = ν0 = 0) substitution of (22) into (9) yields:
| (24) |
The error function argument rises initially like and then approaches . Lowering d from 1 toward 0 mirrors the decreased improvement in accuracy for longer viewing times for n < 1 in (15). Of course, to see if such a form fits the data as well or better than power laws, the parameters b, d and α defining A must be related to coherence, baseline firing rates, etc. via assumptions similar to those of equations (11–15). Since fully-trained animals approximate the constant DDM with n = 1, we set b = aCm and c2 = (2r0 + aCm)φ as in (11–12), thus incorporating parameters available from direct experimental observation and matching the constant drift limit to the previous model. Hence, a and m remain to account for performance changes during training, and two parameters, d and α, replace n.
Balancing detail with parsimony, we suggest several versions of this model. The parameter d can be set to 0, resulting in three parameters a, m, and α. Alternatively α can be fixed and d varied, but the choice of α remains problematic, which makes it not a true three-parameter model. Finally, all four parameters can vary, but as explained below, this typically causes overfitting problems.
Figures 5–6 show examples of exponential drift rates and the corresponding PMFs (24). For Figure 5 we fix d = 0, a = 2, m = C = 1, and let α vary from − 0.4 to 2. At t = 0, the drift rate is b = aCm for all α, so all PMFs have the same initial slope. This removes the crossover of Figure 4: poorer integrators with higher α do not outperform better ones on shorter time scales, and accuracies retain the same ordering for all T. Accuracies for high α exhibit a downturn, which may appear counterintuitive. However, this is a direct consequence of the form (22) of A(t), since noise dominates as A(t) → 0 after the exponential decays. For d = 0, the integrated evidence approaches a constant and accuracy rises to a maximum and thereafter falls toward 50% at long times, following (24). This “rise-and-fall” shape, which cannot be produced using power laws, is useful for fitting data that require n < 0 in the power law model of §3.2. In contrast to the high initial accuracy for n < 0, the PMF for exponential drift rates starts at chance and approaches chance again for high α, after reaching a maximum whose value depends on initial drift and decay. The maximum occurs at Tmax given by:
| (25) |
Figure 5.
Drift rates A(t) (top left) and PMFs (top right) for the exponential form of (22). Here a = 2, C = 1, m = 1, d = 0 and α ranges from − 0.4 to 2.0 in steps of 0.2. The standard DDM occurs for α = 0 (bold curves). Bottom left: the effect of α on threshold for a = 5, m = 1, and T = 0.2s (dash-dot), T = 0.6s (solid), T = 1.0s (dashed), T = 1.4s (dotted). Bottom right: the corresponding slopes.
Figure 6.
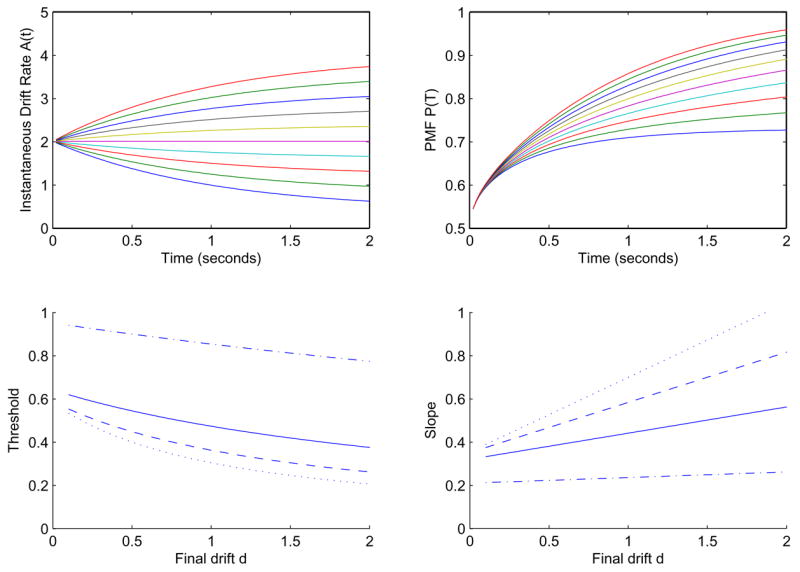
Drift rates A(t) (top left) and PMFs (top right) for decaying exponential drift rates of (22) with a = 2, α = 1, m = C = 1 and d ranging from 0.2 to 2 in steps of 0.2. Bottom left: the effect of d on threshold for viewing times T = 0.2s (dash-dot), T = 0.6s (solid), T = 1s (dashed), and T = 1.4s (dotted). Bottom right: the corresponding slopes.
Apart from this key difference, the power-law and exponential models are broadly similar, each region of the power law n parameter space being reproduced in an appropriate α range. Thus, α < 0 corresponds to n > 1, α = 0 is equivalent to n = 1 (the standard DDM), 0 < α < α0 corresponds to 1 > n > 0, and α > α0 produces the eventual decrease in accuracy with time obtained for n < 0. The value of α0 depends on d and the viewing time at which decay is desired: in Figure 5 d = 0 and α0 ≈ 0.7 for decreases in accuracy within two seconds. A final advantage of exponential decay is that, provided α ≥ 0, the drift rate is bounded by its starting value aCm for all viewing times, thereby removing the physiologically unreasonable singularity at T = 0. This feature does not influence our data fits substantially, because all viewing times are greater than 300 ms early in training where n < 0 fits occur and greater than 105 ms throughout.
In the lower left panel of Figure 5, threshold increases with α for all times T, as desired. A crossover occurs for large enough α, in which longer times give higher thresholds, apparently countering intuition. But this results from the rise-and-fall shape noted above: for faster decay rates, the PMF drops as time increases, although longer times are still better than T = 0.2. Hence the exponential drift model offers much of the desired behavior and flexibility.
In Figure 6 we fix a = 2 and α = m = C = 1 and vary the asymptotic drift rate d from 0.2 to 2, and allowing for increases (d > 1) or decreases (d < 1) with t (d = 1 corresponds to constant drift). For d = 0.1 the error function argument with rapid decay becomes
| (26) |
which decreases before ultimately increasing again like as the first term dominates. One can view the function as an integrated SNR, which in this case initially increases, then decreases, and finally increases again, providing the rise-and fall shape. As expected, thresholds decrease as d increases.
Increasing drift rates are easily implemented by setting d > 1. In principle, d could also vary as a function of C, with rising drift rates for low C and falling ones for high C, although we do not explore this further.
3.4 An Ornstein-Uhlenbeck model
In §§ 3.2–3.3 we showed that the initial improvement in accuracy for shorter viewing times followed by leveling off can be obtained using decaying drift rates. This pattern can also appear for constant drift rates if the parameter λ ≠ 0 in (3). Returning to the general OU solution of (6–9) and setting the drift rate A(t) = aCm and noise
| (27) |
Setting m = 1 and μ0 = ν0 = 0 leaves two parameters: a and λ, and substitution of (27) into (9) shows that accuracy depends only on the absolute value of |λ|, so we may take λ ≤ 0 or λ ≥ 0. (This property does not hold for μ0 or ν0 ≠ 0 or A(t) non-constant.) Here λ ≤ 0 was used, consistent with a stable process having a stochastic attractor [33].
Figure 7 shows the effect of varying λ for fixed aCm. The PMFs exhibit initial sharp increase in accuracy followed by leveling off, without crossover. Also, unlike previous models, accuracies do not asymptote at 1, but
Figure 7.
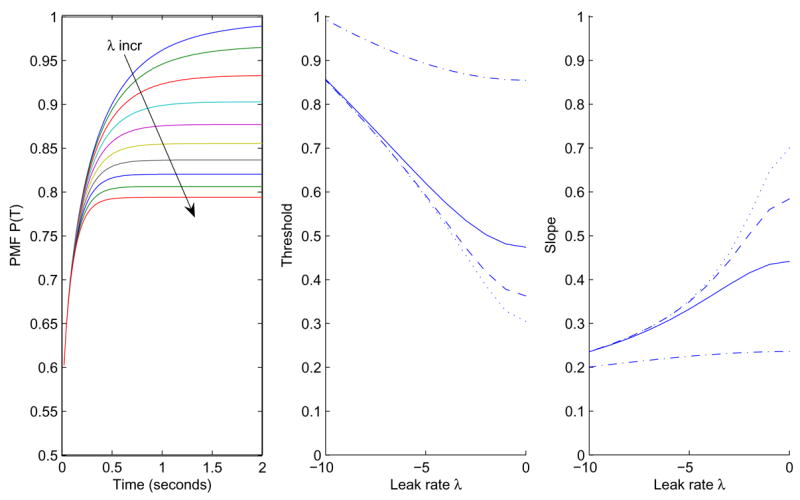
Left: PMFs for the Ornstein-Uhlenbeck model with a = 2, m = C = 1 and λ ranging from − 1 to − 10 in steps of 1. Center: effect of λ on threshold for a = 5, m = 1, C = 1, and for T = 0.2s (dash-dot), T = 0.6s (solid), T = 1.0s (dashed), T = 1.4s (dotted). Right: the corresponding slopes.
| (28) |
Because the normal standard cumulative distribution function Φ(q) is necessarily less than 1 for |λ| ≠ 0, OU processes can produce errors at the highest stimulus strengths without appeal to special procedures such as that of Equation (34) in the next section.
3.5 Other parameters
Choice bias can be implemented by changing the starting point of the diffusion process. A fixed offset corresponds to a global preference for one decision versus the other. For example, by adding a parameter b̄D to μ̄, with D = ±1 for right- and leftward stimuli respectively, and μ0 = b̄D in (18), when a > 0 and b̄ > 0 the PMF shifts upward for trials with rightward motion and downward for trials with leftward motion. A variable offset, which has been used to model fast errors on reaction-time tasks [34], can also be included. Specifically, a term B̄var represents the variance at T = 0, so that μ̄ and σ2 are given by:
| (29) |
Allowing variability in initial data (ν0 ≠ 0) via the parameter B̄var, (18) becomes
| (30) |
Setting t = 0 we conclude that and
| (31) |
For the OU case with λ ≠ 0, after multiplying through by e−λt, (30) becomes
| (32) |
from which one also obtains and
| (33) |
Lapses are errors caused by factors other than limitations in perceptual processing, including inattention and incomplete knowledge of the stimulus-response association. They are typically quantified as the error rate at the highest stimulus strengths (the upper asymptote of the PMF) but are assumed to contribute equally to performance at all stimulus strengths. To account for lapses, the PMF can be modified so that its upper asymptote changes from 1 to 1 − Λ while its lower asymptote remains at 0.5, cf. [35]:
| (34) |
4 Fitting models to evolving data across multiple sessions
We now describe fits of the models described above to behavioral data collected from four monkeys, Av (231 sessions over 21 months), At (178 sessions over 16 months), Cy (150 sessions over 21 months), and ZZ (129 sessions over 14 months), as they were trained to perform the direction discrimination task. Operant training techniques using liquid (typically juice) rewards were used. Training sessions typically lasted 1–4 hours, terminating when the monkey reached satiety. Eye position was monitored using either a scleral search coil (Monkeys Av and At; CNC Engineering, Seattle, WA) or a video-based system (Monkeys Cy and ZZ; ASL, Bedford, MA), allowing us to enforce fixation during motion viewing and determine the selected choice target afterwards. The experimental methods, described in detail in [21, 22], were all in accordance with the National Institutes of Health Guide for the Care and Use of Laboratory Animals and were approved by the University of Pennsylvania’s Institutional Animal Care and Use Committee.
4.1 Binning sessions as performance changes
Combining data across sessions to obtain moving averages is a critical issue, especially during training when performance evolves over time. On the one hand, binning over a small number of sessions provides a fine time resolution that can, in principle, capture systematic changes in performance over time. On the other hand, fewer sessions imply smaller sample sizes and higher standard errors in parameter estimates. Figure 8 shows average normalized standard errors for the parameter a for each animal, binning different numbers of days for each fit. The rightmost points represent the full data sets in single bins; moving leftward, temporal resolution improves, but growing standard errors can nullify much of the benefit. Figure 9 shows distributions of average square residuals for the four subjects computed for 1, 2, 4, 8 and 16-day bins, compared to the average square residual for the full data set binned together. The medians of the distributions tended to increase slightly for increasing bin size. For the rest of the paper we use sliding 4-session windows, which resolve systematic changes in performance that would be obscured by 8 or 16-session bins, while giving acceptable standard errors.
Figure 8.
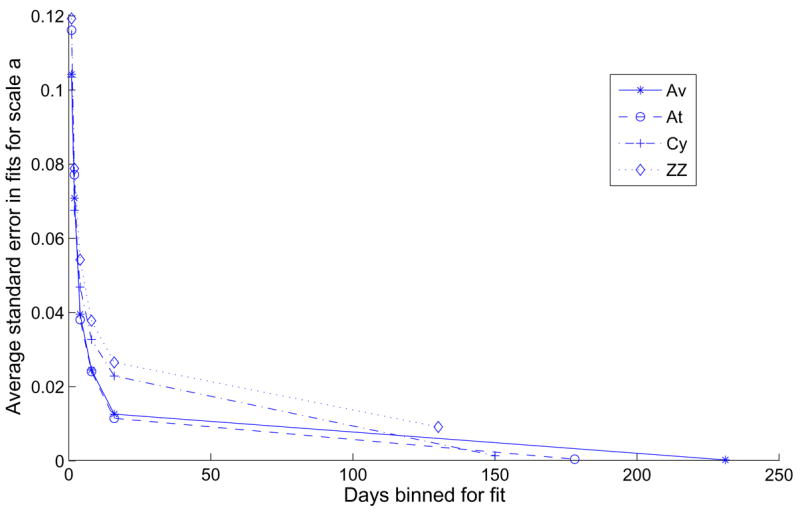
Effect of binning multiple training days on the normalized standard error in fits of scale factor a to the one-parameter DDM for the four subjects.
Figure 9.
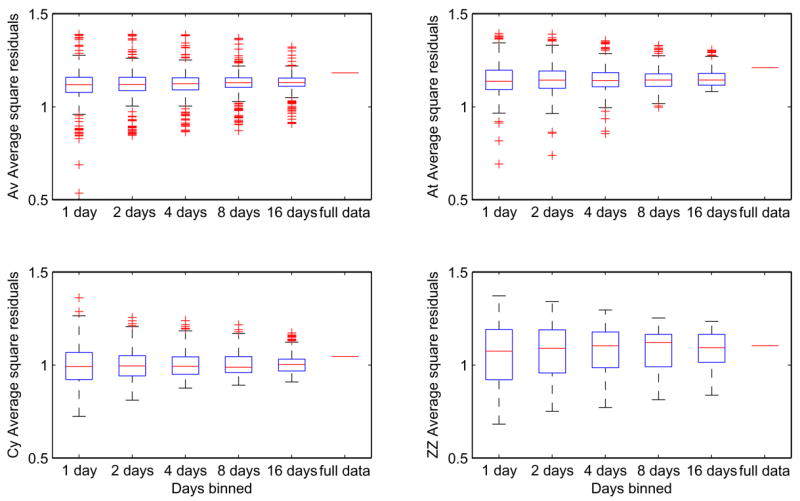
Distributions of average square residuals for subjects Av, At, Cy, and ZZ, fitted to the one-parameter DDM using n = 1, 2, 4, 8, and 16-day bins and the full data sets (left to right). Boxes and horizontal lines show upper and lower quartiles and medians; whiskers show extent of data or 1.5 × (interquartile range), whichever is smaller; crosses denote outliers.
4.2 Adding secondary parameters
In §3 we introduced several models, with different types and numbers of parameters: the one-parameter DDM, four two-parameter models, and four three-parameter models, all based on the OU-DD process (3). The two-parameter models and parameters are identified as follows: OU2 (a and λ), ddExp2 (a and α), ddm2 (a and m), and ddPow2 (a and n). The three-parameter models are ddPow3 (a, m, n), ddExp3a (a, m, α), ddExp3b (a, m, d), and OU3 (a, m, λ). Models were fitted with the MATLAB function fmincon(), using data averaged over four sequential training sessions (not calendar days), by minimizing the following objective function over fitting parameters and examining average square residuals:
| (35) |
All models have the general OU form
| (36) |
Drift rates and other parameters are set as follows (fitting parameters appear in brackets […]):
| (37) |
We start with the simplest one-parameter DDM. Figure 10 shows average square residuals resulting from fits for all four animals using four-session sliding windows. Residuals generally decrease as training progresses (except perhaps for At), implying that the simple DDM becomes a better describer of performance as accuracy improves with training.
Figure 10.
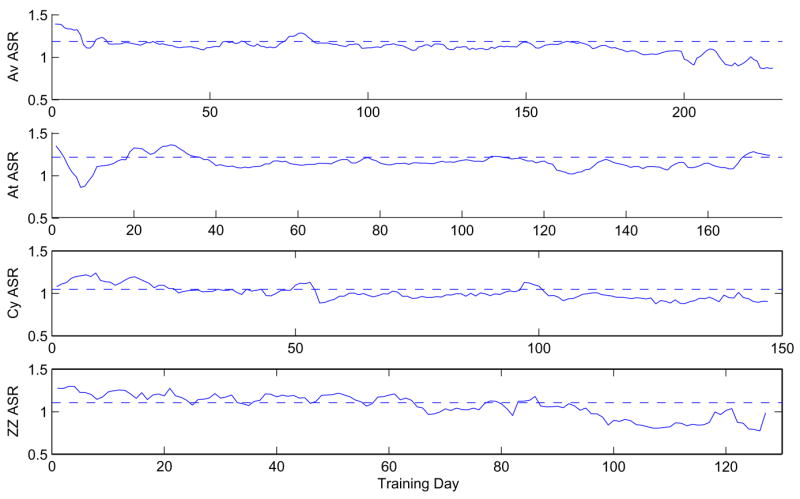
Average square residuals of one-parameter DDM fits to data for Av, At, Cy, and ZZ. Data is binned in 4-day sliding windows and daily fits are made for each window. Dotted lines show average square residuals for each full data set in a single bin, neglecting performance changes.
We now focus on a single subject, Av, to investigate the effect of secondary parameters such as n, α, or m. Adding parameters increases the standard error of parameter fits while improving model fits. Given this tradeoff, it is important to choose additional parameters wisely, adding only those that most improve the goodness of fit. Adding a third parameter introduces further complications due to potentially strong correlations among variabilities in the data captured by different parameters. Including two correlated parameters will not improve the goodness of fit over that with one alone but can drastically increase standard errors. The challenge is to add parameters that improve goodness of fit and whose effects are relatively independent of those already in the model.
The two-parameter models introduce different effects: OU2 adds λ of §3.4, ddm2 adds m of §3.1, ddExp2 adds α from §3.3, and ddPow2 is the Gold-Shadlen model of §3.2 with m = 1. To determine which secondary parameter offers the greatest improvement in fit, we compute the ratios of average square residuals of each two-parameter model with those of the one-parameter DDM, producing the time series plotted in Figure 11. OU2, ddExp2, and ddPow2 all provide similar improvements, suggesting that λ, α and n, all of which affect the temporal scale of evidence accumulation, play similar roles. The coherence exponent m has the largest effect early in training (around days 10–50) but is generally not as usful as the “temporal” parameters. Improvements to the simple DDM are modest, all being below 1%, except for days 220–226 (large downward spike in Figure 11).
Figure 11.
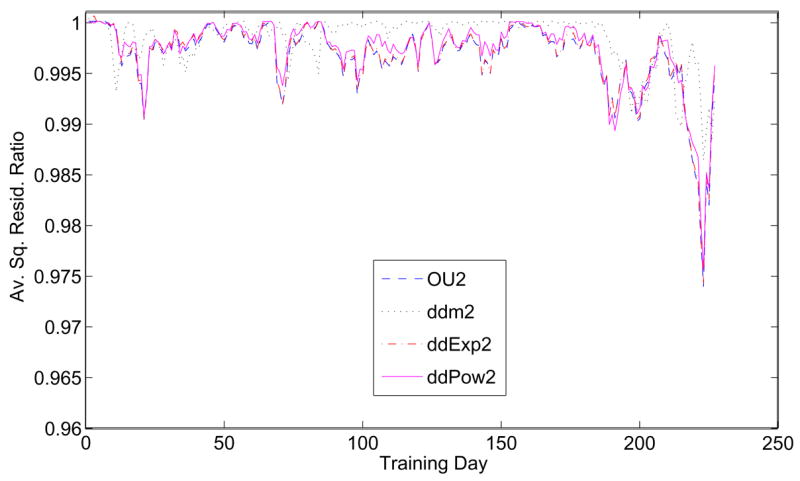
Average square residual ratios for the two-parameter models OU2, ddm2, ddExp2, and ddPow2, normalized by the one-parameter DDM, for data from Av.
Relationships among secondary parameters can be quantified by computing correlations of average square residual ratios, each viewed as a vector of length N = number of training days (Tables 1–2; Correlating ratios of values of the objective function (35) gives identical results.) For the first 170 sessions λ, α and n offer similar improvements that are only weakly related to the effect of m (Table 1).1 In contrast, for the full data set the OU2-ddm2 correlation coefficient increases from 0.0532 to 0.601 (Table 2), implying that, after session 170, adding m to the DDM provides similar improvements to those afforded by the other models. This is because the sharp deviation downward for all models after session 170 dominates the full data set.
Table 1.
Correlations among ratios of fit quality of two-parameter models to that of the one-parameter DDM for Av, days 1–170.
| Correlation | ddm2 | ddExp2 | ddPow2 |
|---|---|---|---|
| OU2 | .0534 | .9969 | .9580 |
| ddm2 | .0264 | .1360 | |
| ddExp2 | .9592 |
Table 2.
Correlations among ratios of fit quality of two-parameter models to that of the one-parameter DDM for Av, full data.
| Correlation | ddm2 | ddExp2 | ddPow2 |
|---|---|---|---|
| OU2 | .601 | .999 | .981 |
| ddm2 | .588 | .663 | |
| ddExp2 | .982 |
The three-parameter models use a and m to describe the coherence dependence of the drift rate and add a further parameter to describe the effect of drift variation during viewing. Figure 12 compares fits of OU3 (λ), ddExp3a (α), ddExp3b (d) and ddPow3 (n). These parameters introduce variable drift rates and correlate weakly with m over much of the training period (Table 1). They all provide further small improvements, although there are periods in which all except ddPow3 underperform the DDM (sharp deviations above 1), and ddPow3 is slightly worse than the others on average. Figure 12 also reveals periods in which no additional parameter substantially improves the DDM fit. Correlations are less meaningful here, since poorly fit days give deviations three orders of magnitude higher than those of interest. Also, if d and α are both allowed to vary in the exponential model, there are substantial overfitting problems: error bars for d span the entire range of parameter variation.
Figure 12.
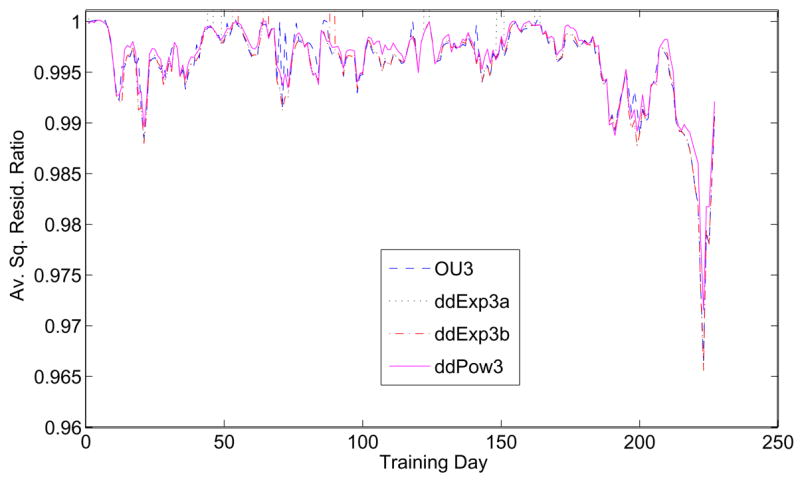
Average square residual ratios for the three-parameter models OU3, ddExp3a, ddExp3b, and ddPow3, normalized by the one-parameter DDM, for data from Av.
As in Figure 11, there is a sharp improvement in fits for the last 50 days of training. There is a striking 3% improvement for a single bin (sessions 223–226), but the period of overall improvement beginning at around session 180 for all four models coincides with a decrease in the average square residual for the DDM of Figure 10 (top panel). This result shows that improved fits from additional parameters occur during a period in which the standard DDM does best. In general, both ddPow3 and ddExp3a provide good fits to the behavioral data, as illustrated by Figure 13, which shows PMFs from two four-session periods early and late in training, in comparison with model predictions.
Figure 13.
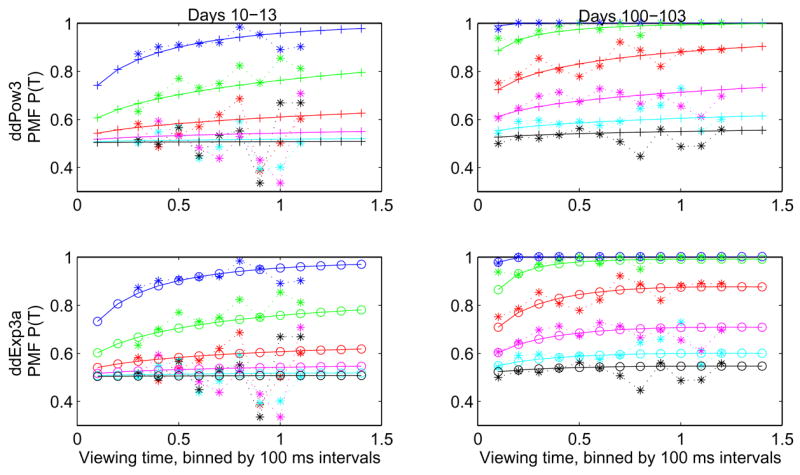
Sample PMF fits for Av for training days 10–13 (left) and 100–103 (right). Data is binned in 100 ms intervals and compared with the best fits for ddPow3 (top) and ddExp3a (bottom). Coherences are 0.999, 0.512, 0.256, 0.128, 0.064, and 0.032 (top to bottom). Note the wider range of viewing times used later in training.
4.3 Some implications for learning
In trained subjects, performance on the direction-discrimination task is well described by the one-parameter DDM [23, 18]. This model assumes that the motion information is temporally integrated, which is a reasonable strategy for this task because stimuli are presented uniformly (albeit stochastically) over time during each trial. We developed the variable drift rate models to better understand how this temporal integration process evolves with training. In this section we focus on data from a single monkey, Av, and compare the fits of several models, including the one-parameter DDM, the two-parameter ddPow2 and the three-parameter models ddPow3, ddExp3a and OU3.
The most dramatic and consistent effect of training was on the value of the scale factor a, which represents the weight of evidence provided to the accumulator by motion-sensitive neurons (presumably in area MT) for the direction decision. Figure 14 shows that, for all five models, values of a increase from near zero in the first session to over 20 by the final session. All models also capture similar details of the evolution of a with training, including a slightly greater rate of increase during the first ≈ 50 sessions than for the following ones, as well as session-by-session fluctuations that probably reflect, in part, daily changes in the monkey’s motivational state. The increase in a over the last ≈ 50 sessions in the three-parameter models (lower 3 panels) accompany changes in the secondary parameter m described below. Also note that, as expected, standard errors of best fit values increase with the number of free model parameters.
Figure 14.
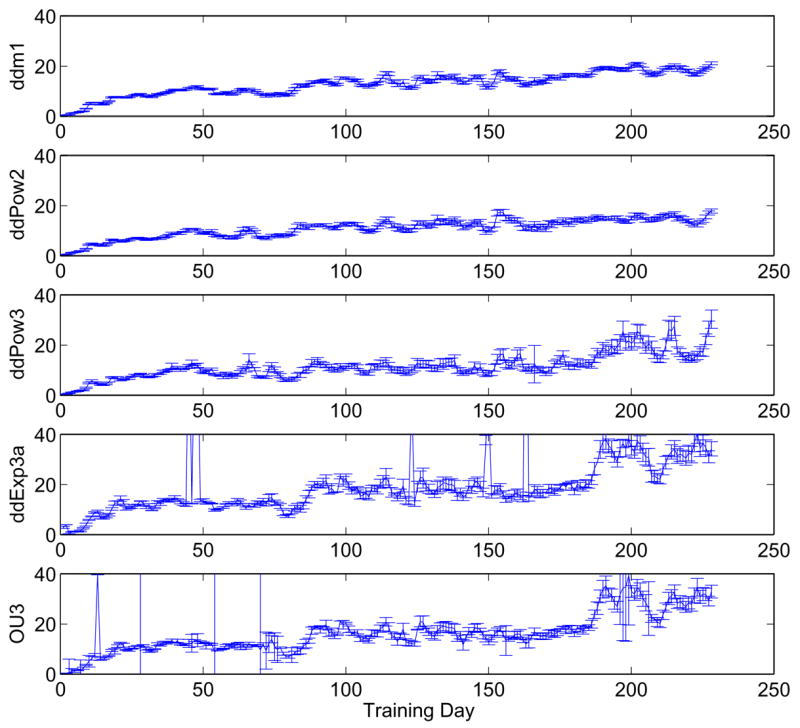
Best fits and standard errors of drift rate scale factor a for Av, using sliding four-day windows to extract trends. Spikes in lower two panels correspond to isolated session blocks that give very poor fits, cf. Figure 12. Excluding three such points for OU3, fits for ddm1, ddPow2, ddPow3, ddExp3 and OU3 (top to bottom) have average normalized standard errors 0.0393, 0.0601, 0.0946, 0.0752 and 0.1646, illustrating that fitting errors rise as parameters are added.
A natural explanation for the steady increase in a is that synaptic connections from neurons in area MT to corresponding groups of integrator or accumulator neurons are modified by training. This interpretation is supported by recent analyses of recordings from areas MT and LIP in monkeys Cy and ZZ [36], which reveal that improvements in performance are accompanied by changes in LIP but not in MT. MT responses maintain similar sensitivity to motion stimuli throughout training.
Changes in the best-fit values of the parameter m in the two- and three-parameter models also accompanied improvements in performance. For the three-parameter models, Figure 15 shows m starting near zero, increasing to above 1.5, then steadily decreasing towards one before increasing again (unexpectedly) in the last ≈ 50 sessions. The increase in m near the end of training accompanied a strong increase in a (see lower three panels of Figure 14), suggesting that the two parameters might trade off each other. The systematic fluctuctuations around days 60–85 accompanied the introduction of a higher percentage of trials at lower coherences, and thus might be interpreted as a temporary adjustment of sensitivity for low SNR (cf. Figure 3).
Figure 15.
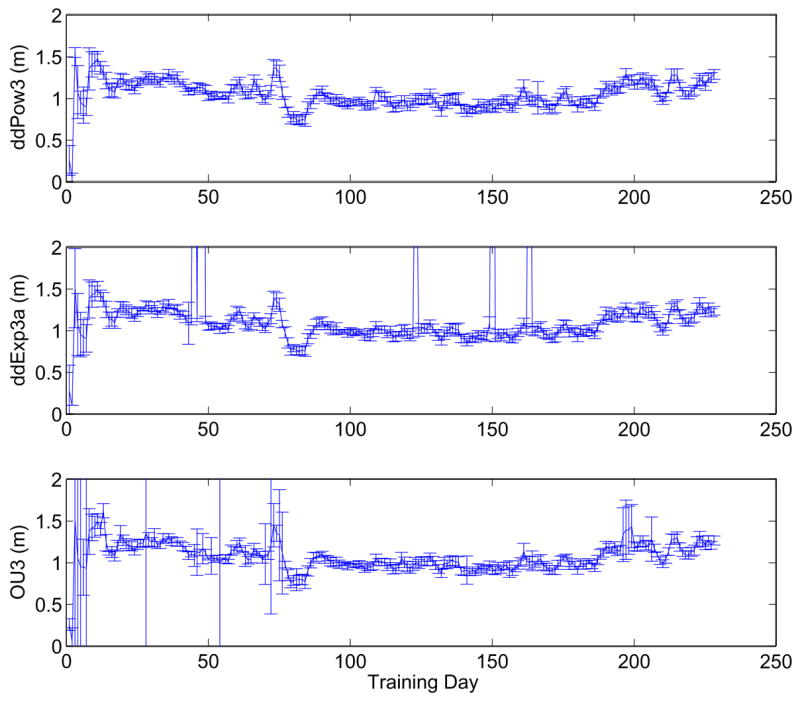
Best fits and standard errors of parameter m in ddPow3, ddExp3a and OU3 (top to bottom) for Av, showing evolution during training. As above, data were averaged over sliding four-day windows.
The best-fit values of temporal parameters showed less clear effects of training (Figure 16; note that early outliers for ddExp3a are omitted). For both parameters, the largest changes occurred in the first several sessions (as for the parameter m), followed by oscillations in best fit values around relatively steady means. However, these mean values do not correspond to a fixed drift rate (i.e., n = 1 and α = 0), implying that even by the end of the extensive training period described here the monkey was not uniformly integrating motion information over the entire viewing period. Specifically, n < 1 and α > 0 reflect falling drift rates and a failure of information presented at long viewing times to improve accuracy, perhaps due to attention flagging late in the trial.
Figure 16.
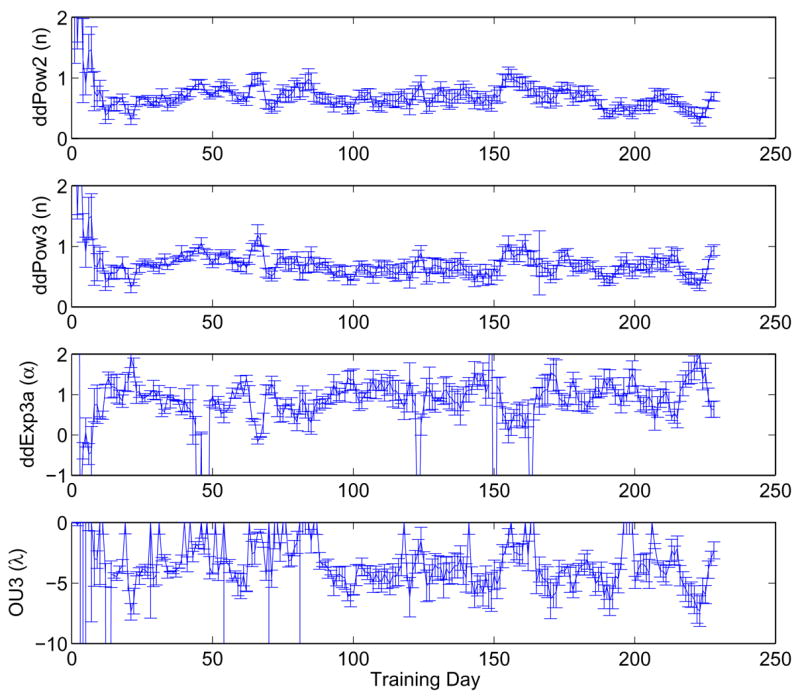
Best fits and standard errors of parameters n, α and λ in ddPow2, ddPow3, ddExp3a and OU3 (top to bottom) for Av, showing evolution during training. As above, data were averaged over sliding four-day windows.
The parameter λ in the OU models similarly influences the time course of evidence accumulation. For stable processes (λ < 0) solutions remain near an attractor, whereas for unstable processes (λ > 0) they rapidly escape, in both cases implying finite accuracy at long viewing times (Equation (28)). Optimal performance occurs for λ = 0, which corresponds to a balance of leak and inhibition in the LIP accumulators [19], so approach of λ to zero could be interpreted as synaptic weights changing to improve performance. However, recent modeling work [33, 20] suggests that physiological factors that determine synapse time constants may prevent this from occurring, leading to either stable or unstable OU behavior. (Nonlinear effects due to upper and lower bounds to neural firing rates can also introduce additional stable equilibria or attractors [37, 20].) The bottom panel of Figure 16 shows that λ remains negative and settles into oscillations in the range (− 1, − 7).
As noted in [35], including a lapse Λ as in (34) can improve fits. At the cost of an extra parameter, best fit values for the decay rate α in ddExp3a are lowered and oscillations are less severe. However, the fit quality does not improve substantially, because Λ and α trade off, making it difficult to determine if an effect is due to lapse or falling drift. Indeed, if falling drift represents decreased attention, then it is plausible that it causes lapses. The OU2 parameter λ can reproduce both effects and avoid the tradeoff.
5 Conclusions
We have presented several models that supplement the constant drift DD process, characterized by a single scale factor a relating coherence to drift rate, with higher-order parameters that affect the time-course of drift. In this connection we note that gain modulation in cortical circuits can adjust drift rates in 2AFC tasks [38], and further evidence for this has recently appeared in a DD reduction of a neural network model for a more complex decision task [39]. There is little to choose among the new models in data-fitting per se, because they all provide similar improvements over the constant DDM (Figures 11–12 and Table 1). However, several other factors help to distinguish them.
As a learning parameter, α seems preferable to n, since exponential drift rates allow the rise-and-fall patterns seen in some PMFs early in training, whereas the singularity at t = 0 and high initial SNR for the power-law model appear unrealistic. Moreover, exponentials do not cause accuracy crossover for poorer performers, and they are more common in physiology than power laws (Figures 4 and 5). OU models that include λ might be even more preferable, based on their extensive mathematical and physiological pedigrees [17, 33, 20] and ability to capture both the time-dependence and upper asymptote of the PMF without an additional lapse parameter Λ.
The fact that earlier models and their extensions to PMFs can be related to, or replaced by, generalized OU/DD processes is also noteworthy. These one-dimensional SDEs offer analytically tractable models of cognitive processes, albeit highly constrained ones. They have clear connections to optimal decision strategies, and they can be derived in a rational if presently non-rigorous manner from biophysically motivated neural networks [38, 19]. We believe that they provide an important stage in the development of neurally based theories of decision making and behavior.
In closing, we remark that the interrogation protocol, which yields explicit formulae for PMFs, has been used throughout. The models assume that the decision is based on the net evidence at the close of stimulus presentation, a plausible choice for the present experiments in which responses are cued after a pre-deterimined viewing duration. However, subjects might also use a first passage criterion [19], in which decisions are made when sample paths first cross one of two thresholds set for the alternative choices. For free-response tasks, the first crossing triggers the behavioral response. For cued-response tasks, the crossing could be interpreted as commitment to a particular alternative, which would be held in working memory (and subsequent sensory evidence ignored) until the cue is given.
In principle, such a mechanism might explain the subpar performance at long viewing times in our data, which would follow if thresholds were set too low. Consistent with this idea, behavior and LIP responses measured in fully trained monkeys performing a cued-response version of the direction-discrimination task are better explained by constant drift to a threshold rather than a variable drift [40]. Thresholds might also vary as a function of viewing time. For free responses this mechanism is computationally equivalent to a variable drift rate and can account for behavioral data better than constant drift rates or extended DDMs in which drift rates are drawn from a distribution on each trial [9, 24, 25]. Moreover, threshold values might be adjusted on trial-to-trial as well as longer timescales during training [41], suggesting that even further refinements of diffusion-based models will be necessary to understand how experience shapes the mechanisms of decision formation.
Acknowledgments
This work was supported by the National Institute of Mental Health (MH58480 and MH62196). C.L., P.C., and J.G. were also sponsored by the Sloan Foundation, the McKnight Foundation, the Burroughs-Wellcome Fund and the National Eye Institute (EY015260). Philip Eckhoff benefitted from a Fannie and John Hertz and NSF coordinated graduate fellowship.
Footnotes
Small correlations (≈0.1) between unrelated parameters are due to the extra degree of freedom that a second parameter affords; correlations of ≈1 imply similar effects and hence similar models.
References
- 1.Schall JD. Neural basis of deciding, choosing and acting. Nature Reviews in Neuroscience. 2001;2:33–42. doi: 10.1038/35049054. [DOI] [PubMed] [Google Scholar]
- 2.Gold JI, Shadlen MN. Neural computations that underlie decisions about sensory stimuli. Trends in Cognitive Science. 2001;5(1):10–16. doi: 10.1016/s1364-6613(00)01567-9. [DOI] [PubMed] [Google Scholar]
- 3.Mazurek ME, Roitman JD, Ditterich J, Shadlen MN. A role for neural integrators in perceptual decision making. Cerebral Cortex. 2003;13(11):891–898. doi: 10.1093/cercor/bhg097. [DOI] [PubMed] [Google Scholar]
- 4.Laming DRJ. Information Theory of Choice-Reaction Times. Academic Press; New York: 1968. [Google Scholar]
- 5.Ratcliff R. A theory of memory retrieval. Psych Rev. 1978;85:59–108. [Google Scholar]
- 6.Luce RD. Response Times: Their Role in Inferring Elementary Mental Organization. Oxford University Press; New York: 1986. [Google Scholar]
- 7.Link SW. The Wave Theory of Difference and Similarity. Erlbaum; Hillsdale, NJ: 1992. [Google Scholar]
- 8.Ratcliff R, Van Zandt T, McKoon G. Connectionist and diffusion models of reaction time. Psych Rev. 1999;106(2):261–300. doi: 10.1037/0033-295x.106.2.261. [DOI] [PubMed] [Google Scholar]
- 9.Smith PL, Ratcliff R. Psychology and neurobiology of simple decisions. Trends in Neurosci. 2004;27(3):161–168. doi: 10.1016/j.tins.2004.01.006. [DOI] [PubMed] [Google Scholar]
- 10.Shadlen MN, Newsome WT. Neural basis of a perceptual decision in the parietal cortex (area LIP) of the rhesus monkey. J Neurophysiology. 2001;86:1916–1936. doi: 10.1152/jn.2001.86.4.1916. [DOI] [PubMed] [Google Scholar]
- 11.Kim JN, Shadlen MN. Neural correlates of a decision in the dorsolateral prefrontal cortex. Nat Neurosci. 1999;2(2):176–185. doi: 10.1038/5739. [DOI] [PubMed] [Google Scholar]
- 12.Horwitz GD, Newsome WT. Separate signals for target selection and movement specification in the superior colliculus. Science. 1999;284(5417):1158–1161. doi: 10.1126/science.284.5417.1158. [DOI] [PubMed] [Google Scholar]
- 13.Horwitz GD, Newsome WT. Target selection for saccadic eye movements: prelude activity in the superior colliculus during a direction-discrimination task. J Neurophysiol. 2001;86(5):2543–2558. doi: 10.1152/jn.2001.86.5.2543. [DOI] [PubMed] [Google Scholar]
- 14.Roitman J, Shadlen M. Response of neurons in the lateral intraparietal area during a combined visual discrimination reaction time task. J Neurosci. 2002;22(21):9475–9489. doi: 10.1523/JNEUROSCI.22-21-09475.2002. [DOI] [PMC free article] [PubMed] [Google Scholar]
- 15.Wald A. Sequential Analysis. John Wiley & Sons; New York: 1947. [Google Scholar]
- 16.Wald A, Wolfowitz J. Optimum character of the sequential probability ratio test. Ann Math Statist. 1948;19:326–339. [Google Scholar]
- 17.Usher M, McClelland JL. On the time course of perceptual choice: The leaky competing accumulator model. Psych Rev. 2001;108:550–592. doi: 10.1037/0033-295x.108.3.550. [DOI] [PubMed] [Google Scholar]
- 18.Gold JI, Shadlen MN. Banburismus and the brain: decoding the relationship between sensory stimuli, decisions, and reward. Neuron. 2002;36:299–308. doi: 10.1016/s0896-6273(02)00971-6. [DOI] [PubMed] [Google Scholar]
- 19.Bogacz R, Brown E, Moehlis J, Holmes P, Cohen JD. The physics of optimal decision making: A formal analysis of models of performance in two alternative forced choice tasks. Psych Rev. 2006;113(4):700–765. doi: 10.1037/0033-295X.113.4.700. [DOI] [PubMed] [Google Scholar]
- 20.Wong KF, Wang XJ. A recurrent network mechanism of time integration in perceptual decisions. J Neurosci. 2006;26(4):1314–1328. doi: 10.1523/JNEUROSCI.3733-05.2006. [DOI] [PMC free article] [PubMed] [Google Scholar]
- 21.Gold JI, Shadlen MN. Representation of a perceptual decision in developing oculomotor commands. Nature. 2000;404:390–394. doi: 10.1038/35006062. [DOI] [PubMed] [Google Scholar]
- 22.Gold JI, Shadlen MN. The influence of behavioral context on the representation of a perceptual decision in developing oculomotor commands. J Neurosci. 2003;23(2):632–651. doi: 10.1523/JNEUROSCI.23-02-00632.2003. [DOI] [PMC free article] [PubMed] [Google Scholar]
- 23.Palmer J, Huk AC, Shadlen MN. The effect of stimulus strength on the speed and accuracy of a perceptual decision. J Vision. 2005;5:376–404. doi: 10.1167/5.5.1. [DOI] [PubMed] [Google Scholar]
- 24.Ditterich J. Evidence for time-variant decision making. European J of Neurosci. 2006;24:3628–3641. doi: 10.1111/j.1460-9568.2006.05221.x. [DOI] [PubMed] [Google Scholar]
- 25.Ditterich J. Stochastic models of decisions about motion direction: Behavior and physiology. Neural Networks. 2006;19:981–1012. doi: 10.1016/j.neunet.2006.05.042. [DOI] [PubMed] [Google Scholar]
- 26.Neyman J, Pearson ES. On the problem of the most efficient tests of statistical hypotheses. Philos Trans Roy Soc London Ser A. 1933;231:289–337. [Google Scholar]
- 27.Britten KH, Shadlen MN, Newsome WT, Movshon JA. The analysis of visual motion: A comparison of neuronal and psychophysical performance. J Neurosci. 1992;12(12):4745–4765. doi: 10.1523/JNEUROSCI.12-12-04745.1992. [DOI] [PMC free article] [PubMed] [Google Scholar]
- 28.Britten KH, Shadlen MN, Newsome WT, Movshon JA. Responses of neurons in macaque MT to stochastic motion signals. Visual Neurosci. 1993;10:1157–1169. doi: 10.1017/s0952523800010269. [DOI] [PubMed] [Google Scholar]
- 29.Gardiner CW. Handbook of Stochastic Methods. 2. Springer; New York: 1985. [Google Scholar]
- 30.Klein SA. Measuring, estimating and understanding the psychometric function: A commentary. Perception and Psychophysics. 2001;63(8):1421–1455. doi: 10.3758/bf03194552. [DOI] [PubMed] [Google Scholar]
- 31.Strasburger H. Converting between measures of slope of the psychometric function. Perception and Psychophysics. 2001;63(8):1348–1355. doi: 10.3758/bf03194547. [DOI] [PubMed] [Google Scholar]
- 32.Shadlen MN, Britten KH, Newsome WT, Movshon JA. A computational analysis of the relationship between neuronal and behavioral responses to visual motion. J Neurosci. 1996;16(4):1486–1510. doi: 10.1523/JNEUROSCI.16-04-01486.1996. [DOI] [PMC free article] [PubMed] [Google Scholar]
- 33.Wong KF, Huk A, Shadlen MN, Wang XJ. Time integration in a perceptual decision task: Adding and subtracting brief pulses of evidence in a recurrent cortical network model. Washington, DC: Society for Neuroscience; 2005. [Google Scholar]
- 34.Ratcliff R. A theory of order relations in perceptual matching. Psych Rev. 1981;88:552–572. [Google Scholar]
- 35.Wichmann FA, Hill NJ. The psychometric function: I. fitting, sampling, and goodness of fit. Perception & Psychophysics. 2001;63(8):1293–1313. doi: 10.3758/bf03194544. [DOI] [PubMed] [Google Scholar]
- 36.Law JCT, Gold JI. Neural correlates of perceptual learning in monkey area LIP but not MT. Department of Neuroscience, University of Pennsylvania; 2007. Preprint. [Google Scholar]
- 37.Brown E, Holmes P. Modelling a simple choice task: Stochastic dynamics of mutually inhibitory neural groups. Stochastics and Dynamics. 2001;1:159–191. [Google Scholar]
- 38.Brown E, Gao J, Holmes P, Bogacz R, Gilzenrat M, Cohen J. Simple networks that optimize decisions. Int J Bifurcation and Chaos. 2005;15(3):803–826. [Google Scholar]
- 39.Liu Y, Holmes P, Cohen JD. A neural network model of the Eriksen task: Reduction, analysis, and data fitting. Neural Computation. 2007 doi: 10.1162/neco.2007.08-06-313. In press. [DOI] [PMC free article] [PubMed] [Google Scholar]
- 40.Kiani R, Hanks TD, Shadlen MN. Improvement in sensitivity with viewing time is limited by an integration-to-bound mechanism in area lip. Society for Neuroscience; Program No. 605.7. 2006 Neuroscience Meeting Planner; Atlanta, GA. 2006. Online. [Google Scholar]
- 41.Simen P, Cohen JD, Holmes P. Rapid decision threshold modulation by reward rate in a neural network. Neural Networks. 2006:1013–1026. doi: 10.1016/j.neunet.2006.05.038. [DOI] [PMC free article] [PubMed] [Google Scholar]