

Abstract
The frequency that multiple different subtypes of hepatitis C virus (HCV) simultaneously infect a given individual is controversial. To address this question, heteroduplex mobility analysis (HMA) of portions of the HCV core and envelope 1 region was optimized for sensitive and specific detection of mixtures of HCV genomes of different genotype or subtype. Using the standard HCV genotyping approach of 5′-untranslated region (UTR) analysis, 28 of 374 (7.5%) chronic hepatitis C research subjects were classified as having either multiple-subtype HCV infections (n = 21) or switching HCV subtypes over time (n = 7), the latter pattern implying viral superinfection. Upon retesting of specimens by HMA, 25 of 28 multiple-subtype results could not be reproduced. All three patients with positive results were injection drug users with potential multiple HCV exposures. To address the hypothesis of tissue sequestration of multiple-subtype HCV infections, liver (n = 22), peripheral blood mononuclear cell (n = 13), perihepatic lymph node (n = 16), and serum (n = 19) specimens from 23 subjects with end-stage hepatitis C were collected and analyzed by the HMA technique. Whereas 5′-UTR results implicated mixed-subtype HCV infections in 2 subjects, HMA testing revealed no evidence of a second HCV subtype in any tissue compartment (0 of 70 compartments [0%]) or within any given subject (0 of 23 subjects [0%]). In summary, a large proportion of mixed-genotype and switching-genotype patterns generated by 5′-UTR analysis were not reproducible using the HMA approach, emphasizing the need for additional study.
Hepatitis C virus (HCV), a plus-strand RNA virus classified within the Flaviviridae family, is a major cause of chronic liver disease, cirrhosis, end-stage liver disease, and hepatocellular carcinoma (10). Data from prevalence studies have suggested that between 2.7 to 3.9 million people in the United States and approximately 170 million people worldwide have evidence of HCV infections (1, 2). HCV-related disease is the most common indication for liver transplantation and one of the leading causes of liver-related death in the United States (34, 46, 48).
Genetic heterogeneity is an outstanding feature of HCV and is known to influence important clinical aspects of infection, such as response to therapy and possibly outcome of infection (12, 13, 31, 32, 44). Thus, accurate understanding of the scope of HCV heterogeneity during human infection has important medical implications. The HCV genome consists of highly conserved 5′- and 3′-untranslated regions (UTR) plus a larger and more variable genetic fragment encoding a single polyprotein precursor that is cleaved by cellular and viral proteases to yield the structural (core, envelope 1, and envelope 2) and nonstructural (p7, NS2, NS3, NS4A, NS4B, NS5A, and NS5B) HCV proteins (16). Based on genetic data, HCV is classified into 6 major genotypes (or clades) and over 80 subgenotypes (or subtypes) (39, 40). Genetic variation is not uniformly distributed among the various regions of the HCV genome (4, 18, 38, 40). Genotypes 1, 2, and 3 account for the vast majority of HCV infections in the United States (20) and are the focus of the present study.
HCV also evolves as viral “quasispecies,” a term used to describe a population of closely related yet genetically distinct viral variants derived from a common ancestor variant during chronic infection of an individual host (22, 47). The genotype and subtype of all variants within a given individual do not change during chronic infection but require hundreds to thousands of years to diverge sufficient distance for classification as a discrete subtype (36, 37). Multiple studies have demonstrated that different tissue reservoirs such as lymph nodes, brain, peripheral blood mononuclear cells, and liver may harbor different HCV genetic populations, suggesting that HCV may compartmentalize in vivo (14, 19, 21, 29, 30, 33). Two recent studies have reported that a significant proportion of HCV-infected subjects are simultaneously coinfected with two or more different genotypes or subtypes that have distinctly different tissue distributions (11, 33). If true, this finding has important implications for therapeutic design. For example, if a subject had genotype 2 or 3 in the blood, yet genotype 1 hidden in a different tissue reservoir, treatment with standard therapy for genotype 2/3 infections (a 6-month course of pegylated interferon plus ribavirin) might not work due to the relative resistance of genotype 1 infection to this regimen. The finding also has strong implications for the interpretation of data in all previous and subsequent studies examining the E2 gene hypervariable region 1 of HCV quasispecies.
Most HCV genotyping methods, including the one used in the abovementioned studies describing tissue sequestration of HCV subtypes, are based on PCR amplification and type-specific assay of the highly conserved 5′-UTR, either by direct sequencing (15, 25, 40, 41), restriction fragment length polymorphism (RFLP) analysis (9, 24), or line probe reverse hybridization assay (11, 21, 42, 43). However, the above assays have two important limitations. By design, they discriminate different HCV genotypes based on only a single or at most a few nucleotide mutations within the 5′-UTR and are subject to misgenotyping due to spurious HCV mutations that occur in nature (4). Furthermore, all 5′-UTR-based assays described above identify only predominant viral species and could easily miss nonpredominant variants comprising less than 10% of the total viral population. To overcome these two obstacles, we developed a heteroduplex mobility analysis (HMA) technique that uses HCV subtype-specific probes targeting portions of the HCV core and envelope 1 genes and is thus highly specific for discriminating HCV subtypes. The HMA assay is also sensitive enough to discriminate nonpredominant HCV variants from predominant variants present at a 1:100 ratio or lower. In the present study, the HMA technique was performed on a variety of serum and tissue samples from research subjects with chronic hepatitis C, to provide further information on the important question of human coinfection with mixtures of different HCV genotypes or subtypes.
MATERIALS AND METHODS
Patient samples and initial genotyping.
For our field base cohort study of HCV mixed-genotype infections in serum, 769 serum samples were selected from 374 subjects enrolled in the cohort of Alaskan Natives and American Indians as part of an NIH-funded study with Institutional Review Board approval (23). The research complied with all relevant federal guidelines and institutional policies. The 374 subjects were originally genotyped by 5′-RFLP analysis (9), and specimens with either mixed-HCV-genotype results (n = 21) or evidence of HCV genotype switching over time (n = 7) were selected for further study using the HMA technique. For the samples from various tissue compartments, 23 subjects who were chronically infected with HCV and developed end-stage liver disease were recruited, and tissue samples were collected at the time of liver transplantation using a protocol approved by the University of Washington Institutional Review Board (30). Serum samples and peripheral blood mononuclear cells (PBMCs) were purified, divided into aliquots, and stored at −80°C. Liver biopsy specimens and lymph node biopsy specimens were immediately snap-frozen at the bedside in optimal cutting temperature (OCT) compound (Sakura Finetek, Torrance, CA) and stored at −80°C. HCV genotypes of the subjects were initially determined by 5′-RFLP analysis using the serum sample (9). In addition, 44 random clinical serum samples were genotyped by both HMA and direct sequencing of region E1 to prove method accuracy.
RNA extraction and RT-PCR.
RNA was quantified by real-time PCR prior to extraction from sera or tissue-containing OCT buffer with the QIAamp viral RNA mini kit (Qiagen, Inc., Valencia, CA) or RNeasy mini kit (Qiagen, Inc., Valencia, CA) according to the manufacturer's instructions. Known positive and negative sera and water were included in all reactions from the extraction step as positive and negative controls. For reactions, 50,000 RNA copies were considered optimal, so that species present at concentrations of 1% or less (500 copies) could be reproducibly detected. The entire RNA sample was used when titers were below this level. The cDNA synthesis was carried out with 25-μl reaction mixtures containing 10 μl of RNA, 10 mM Tris-HCl (pH 8.3), 50 mM KCl, 3 mM MgCl2, 0.6 mM dithiothreitol, 4 mM each deoxynucleoside triphosphate (dATP, dCTP, dGTP, and dTTP), 4 μM antisense primer JBE1-1as (Table 1), 6 U of RNase inhibitor (Roche Applied Science, Indianapolis, IN), and 130 U of Moloney murine leukemia virus reverse transcriptase (Invitrogen, Carlsbad, CA). Reverse transcription (RT) was performed at 37°C for 1 h, and the reverse transcriptase was inactivated at 95°C for 5 min before proceeding to PCR amplification. The core/E1 region was amplified by two rounds of PCR, with the outer primers JBE1-1as (antisense primer, round I) and JBE1-1s (sense primer, round I) and inner primers JBE1-3as (antisense primer, round II) and JBE1-2s (sense primer, round II), as listed in Table 1 (5). PCR was performed in a 50-μl mixture containing 10 mM Tris-HCl (pH 8.3), 50 mM KCl, 3 mM MgCl2, 0.8 mM each deoxynucleoside triphosphate, 0.5 μM antisense and sense primers, 10 μl of cDNA product or 1 μl of PCR I product, and 1.5 U AmpliTaq polymerase (Roche Applied Science, Indianapolis, IN). Thermal cycling reactions were carried out with a GeneAmp PCR system 9600 (Perkin-Elmer, Applied Biosystems), consisting of 35 cycles of 94°C for 15 s, 45°C (round I), or 55°C (round II) for 30 s and extension at 72°C for 45 s. The second-round PCR products were separated on a 1.5% agarose gel, stained with ethidium bromide, and visualized under UV light. To perform sequencing, RT-PCR products were purified by QIAquick PCR purification kit (Qiagen, Inc., Valencia, CA) and subcloned into the TA cloning vector (Invitrogen, Carlsbad, CA). Recombinant plasmids were transformed into Escherichia coli Top10 competent cells (Invitrogen, Carlsbad, CA), and PCR-amplified fragments from single colonies were sequenced at both directions using an ABI 3730XL high-throughout capillary DNA analyzer.
TABLE 1.
RT-PCR primers used to amplify the core/E1 regiona
| Primer | Sequence | Nucleotide coordinates (5′→3′) | PCR round |
|---|---|---|---|
| JBE1-1as | 5′-AGGCTTTCATTGCAGTTCAAGGCCGTGCTATTGATGTGCC-3′ | 1639-1600 | I |
| JBE1-1s | 5′-GCGTCCGGGTTCTGGAAGACGGCGTGAACTATGCAACAGG-3′ | 802-841 | I |
| JBE1-3as | 5′-GACCAGTTCATCATCATATCCCATGCC-3′ | 1295-1321 | II |
| JBE1-2s | 5′-AAGACGGCGTGAACTATGCAACAGGGAACCTTCCTGGTTG-3′ | 817-856 | II |
Probe construction and probe labeling.
HCV subtype-specific probes were generated from RT-PCR products of the core/E1 region derived from sera of individuals infected with known genotypes (1a, 1b, 2a, 2b, and 3a). RT-PCR products were purified and subcloned as described above, and plasmids isolated from single colonies were sequenced to confirm the genotype and subtype of the inserted fragments. Database searches were conducted with BLAST (3). Multiple alignments and calculation of evolutionary distances were carried out with Clustal W using the neighbor-joining method (45). E. coli strains harboring genotype- and subtype-specific plasmids were stored in 15% glycerol in a −80°C freezer.
Subtype-specific probes were amplified by PCR with JBE1-3as and JBE1-2s primers using the plasmids containing HCV fragments as templates. Gel-purified probes were denatured at 95°C for 3 min in reaction buffer containing 70 mM Tris-HCl (pH 7.6), 10 mM MgCl2, 100 mM KCl, and 1 mM 2-mercaptoethanol and end labeled with [32P]ATP by T4 polynucleotide kinase (Invitrogen, Carlsbad, CA) at 37°C for 1 h. Radiolabeled probes were purified with Qiagen DyeEx purification columns according to the manufacturer's instructions (Qiagen, Inc., Valencia, CA).
Probe hybridization analysis.
32P-labeled probes (1a, 1b, 2a, 2b, or 3a) were hybridized to a 50- to 100-fold molar excess of colinear PCR products of the core/E1 region derived from either the homologous standard or from research samples. Hybridization was carried out in a 16-μl reaction system consisting of 4 μl of PCR product (∼500 ng), 0.5 to 1 μl of 32P-labeled probe (∼5 ng), 200 mM NaCl, 10 mM Tris-HCl (pH 8.0), and 2 mM EDTA. The reaction mixture was denatured at 95°C for 5 min, allowed to anneal at 55°C for 2 h, and loaded onto a 6% native polyacrylamide mutation detection enhancement gel (Cambrex, Rockland, ME). Heteroduplexes and homoduplexes were separated by electrophoresis at 650 V for 16 h. Gels were vacuum dried at 80°C on filter paper and exposed to X-ray films for 2 h or overnight.
RESULTS
Phylogenetic analysis of envelope 1 gene sequences from probes, HCV reference strains, and clinical samples.
Figure 1 shows sequence alignments (A) for the five HCV subtype-specific probes used in the present study and phylogenetic analysis of probe sequences (B) along with E1 sequences of 44 clinical samples genotyped by the HMA technique (see below) and HCV reference strains. The 438-bp probe fragments covered the carboxyl terminus of core and the amino-terminal two-thirds of E1. Phylogenetic analysis of the region revealed five divergent groups, with all isolates easily classified into one of the five HCV subtypes under study (1a, 1b, 2a, 2b, or 3a). Concordance between core/E1 genotyping and phylogenetic analysis was 100%.
FIG. 1.

Phylogenetic analysis of subtype-specific probes, HCV reference strains, and clinical samples. (A) Sequence alignment of the five HCV subtype-specific probes used for HMA analysis (nucleotide positions 857 to 1294). Identical nucleotides are shaded gray. (B) Phylogenetic analysis of the five HCV subtype-specific probes, along with 44 envelope 1 gene sequences (nucleotides 915 to 1490) generated from clinical specimens genotyped by the HMA technique and five HCV subtype reference strain sequences. The phylogenetic tree was constructed by the neighbor-joining method with the TajNei distance model. ▪, subtype-specific probes; ○, reference HCV strains. The other branches indicate E1 sequences from clinical samples of the same subtype. The reference HCV strains are as follows: HCV_1a_H77 as the 1a subtype reference (26), HCV_1b_J as the 1b subtype reference (17), HCV_2a_HC_J6 as the 2a subtype reference (27), HCV_2b_HC_J8 as the 2b subtype reference (28), HCV_3a_K3a as the 3a subtype reference (49).
Specificity and sensitivity of probe hybridization analysis.
Figure 2 demonstrates HCV genotype determination by the HMA technique. In separate reactions, each of the five isotope-labeled probes was hybridized to colinear RT-PCR products derived from the sera of subjects with known HCV infections by genotypes 1a (lane 2 of all panels), 1b (lane 3 of all panels), 2a (lane 4 of all panels), 2b (lane 5 of all panels), or 3a (lane 6 of all panels), and nondenatured hybridization products were electrophoresed into mutation detection enhancement gels. Fig. 2A through E demonstrate gel shift profiles using the genotype 1a, 1b, 2a, 2b, and 3a probes, respectively. Lane 1 of panels A through E demonstrates the homoduplex control for each subtype-specific probe (hybridized to the unlabeled version of itself). Heteroduplexes were observed with retarded migration distances relative to the homoduplex control whenever a sample of known subtype was hybridized to the corresponding subtype-specific probe (Fig. 2A, lane 2, for genotype 1a; B, lane 3, for genotype 1b; C, lane 4, for genotype 2a; D, lane 5, for genotype 2b; and E, lane 6, for genotype 3a). Negative results occurred whenever a subtype-specific probe was hybridized to RT-PCR products with a different HCV subtype, with one exception: heteroduplexes with a much greater degree of retarded migration were also formed when the subtype 1b sample was hybridized to the 1a-specific probe (Fig. 2A, lane 3) or vice versa (Fig. 2B, lane 2), resulting in a secondary shift migrating near the top of the gel. Both primary and secondary shifts were observed when either genotype 1a probe (Fig. 2A, lane 7) or genotype 1b probe (Fig. 2B, lane 7) was hybridized to a mixture of 1a and 1b samples at a 1:1 ratio. The secondary heteroduplex shift pattern between genotypes 1a and 1b likely resulted from cross-hybridization, since these subtypes are more closely related than other HCV subtypes. Genotype 1a and 1b shift patterns were easily distinguishable.
FIG. 2.

Genotyping by HMA using HCV subtype-specific probes. (A) Hybridization with 1a probe. (B) Hybridization with 1b probe. (C) Hybridization with 2a probe. (D) Hybridization with 2b probe. (E) Hybridization with 3a probe. Lane 1, homologous sample to the corresponding probe; lane 2, genotype 1a sample; lane 3, genotype 1b sample; lane 4, genotype 2a sample; lane 5, genotype 2b sample; lane 6, genotype 3a sample; lane 7, genotype 1a and 1b samples mixed at a 1:1 ratio of viral RNA genomes. The specimens in lanes 2 to 7 were identical in each panel.
In this assay, negative results in a single reaction (gel lane) only prove that a specific subtype is not detectable: they do not indicate that the specimen is negative for HCV RNA. The doublet band pattern observed in some lanes (e.g., Fig. 2B, lane 3), but not others (e.g., Fig. 2A, lane 2), results from labeling of both strands of the DNA probe with 32P, which is necessary to optimize assay sensitivity. In most instances, probe hybrids from opposite DNA strands comigrate as a single band under the gel conditions used; however, doublet banding may occur, and further resolution requires cloning and reanalysis of purified target DNA (data not shown).
The sensitivity of HMA genotyping was investigated by mixing purified HCV RNA of different subtypes at various concentrations and assaying mixtures of RNA against all five probes described above. Mixing experiments were performed for all possible combinations of subtype-specific RNA and probes at concentration ratios of 1:10, 1:100, and 1:1,000. Secondary (diluted) HCV subtype RNA was consistently detected at 1% of the concentration of primary (undiluted) subtype RNA. Figure 3A illustrates a representative experiment showing consistent detection of subtype 1a target using the 1a-specific probe in the presence of decreasing amounts of subtype 2b target. In Fig. 3B, the same dilution series was probed for subtype 2b target with 2b probe; lanes 2 and 3 of Fig. 3B show detection of the subtype 2b target at 10% and 1% of the concentration of background subtype 1a target, respectively. In Fig. 3C, subtype 1a target was diluted in the presence of a constant amount of subtype 1b target. Lanes 2 and 3 of Fig. 3C show detection of subtype 1a target at 10% and 1% of the concentration of subtype 1b target, respectively. In contrast, conventional 5′-UTR-based genotyping assays poorly discriminate second genotypes at concentrations of 10% of the total population (data not shown).
FIG. 3.
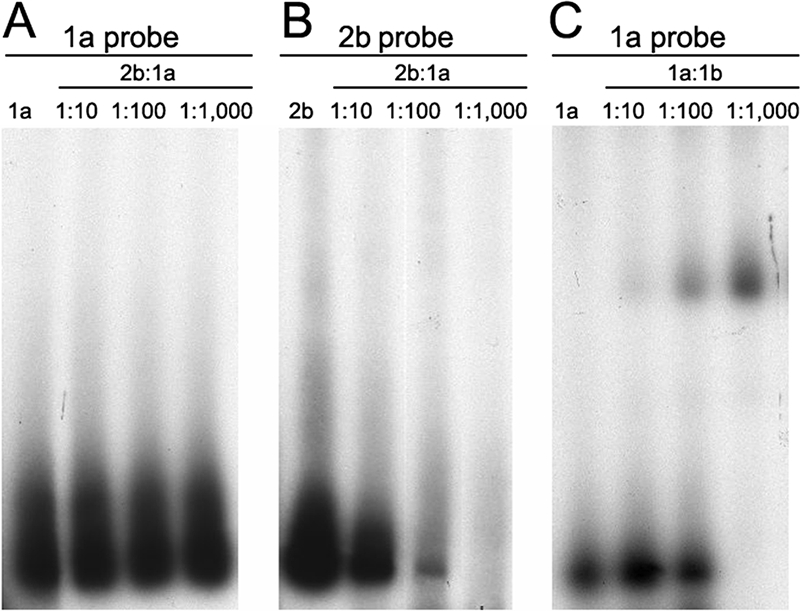
Sensitivity of the HMA genotyping technique. Purified HCV RNA of different subtypes was mixed and assayed by type-specific probes as described in the text. (A) Detection of constant amounts of genotype 1a targets (derived from 50,000 subtype 1a RNA copies) in the presence of a decreasing amount of genotype 2b targets, using the genotype 1a-specific probe. Lane 1, genotype 1a targets only; lanes 2 through 4, dilution of genotype 2b targets into constant levels of genotype 1a targets. Lane 2 contains a 1:10 concentration of 2b to 1a, lane 3 contains a 1:100 concentration of 2b to 1a, and lane 4 contains a 1:1,000 concentration of 2b to 1a. (B) Detection of decreasing amounts of genotype 2b target in the presence of a constant amount of genotype 1a background (same as panel A), using the genotype 2b-specific probe. Lane 1, genotype 2b targets only; lanes 2 through 4, dilution of genotype 2b targets into constant levels of genotype 1a background. Lane 2 contains a 1:10 concentration of 2b to 1a, lane 3 contains a 1:100 concentration of 2b to 1a, and lane 4 contains a 1:1,000 concentration of 2b to 1a. (C) Detection of decreasing amounts of genotype 1a target in the presence of a constant amount of genotype 1b background (derived from 50,000 subtype 1b RNA copies) using the genotype 1a-specific probe. Lane 1, genotype 1a targets only; lanes 2 through 4, dilution of genotype 1a targets into constant levels of the genotype 1b background. Lane 2 contains a 1:10 concentration of 1a to 1b, lane 3 contains a 1:100 concentration of 1a to 1b, and lane 4 contains a 1:1,000 concentration of 1a to 1b.
HMA analysis of serum samples defined as multiple-subtype infections by 5′-RFLP analysis.
As part of an ongoing population-based study involving subjects with documented chronic hepatitis C (23), 769 serum specimens from 374 subjects were tested for HCV genotype by 5′-RFLP analysis. In 153 subjects, specimens with HCV genotype results were available from more than one time point. Multiple-subtype HCV infections were identified in 21 (5.6%) of the 374 subjects, while HCV genotype switching between different time points was detected in 7 (4.6%) of the 153 subjects with more than one serum specimen, suggesting that superinfection with a new HCV subtype had occurred. The data are summarized according to risk factor for HCV infection in Table 2. It is important to note that, based on 5′-RFLP results, risk factor for HCV infection did not influence the likelihood of having multiple HCV infections, since the risk was 7.1% in intravenous drug users (IDUs) compared to 5.8% in subjects with only blood transfusion as a risk factor for HCV acquisition (Table 2). This discrepancy was the primary reason for developing the HMA method as a confirmatory test for HCV genotype assignment.
TABLE 2.
Evidence of mixed or switched genotypes detected by RFLP and confirmed by HMA based on risk group
| Risk group (n) | No. (%) of mixed/switched genotypes:
|
|
|---|---|---|
| Detected by RFLP | Confirmed by HMA | |
| IDU (226) | 16/226 (7.1) | 3/16 (18.8) |
| Blood transfusion (52) | 3/52 (5.8) | 0/3 (0) |
| Other (96)a | 9/96 (9.4) | 0/9 (0) |
| Total (374) | 28/374 (7.5) | 3/28 (10.7) |
Other risk factors include greater than 10 lifetime sexual partners, sexual partners with history of IDU, tattooing, piercing, intranasal cocaine use, household contact with HCV, and unknown.
Extra samples were available and further genotyped by core/E1 probe hybridization using the full panel of HCV subtype probes (1a, 1b, 2a, 2b, and 3a) for each specimen (Table 3). Of the 21 samples that were determined by 5′-RFLP analysis to harbor multiple-subtype HCV infections, only 1 specimen was confirmed to have two different HCV subtypes by core/E1 probe hybridization, while the remaining 20 samples contained only a single HCV subtype. Of the seven subjects that were determined by 5′-RFLP analysis to switch HCV subtype over time, five subjects had specimens that were genotyped differently by HMA versus 5′-RFLP analysis. Based on HMA results, HCV subtype switching was not apparent in these five subjects (Table 3). Thus, over 80% of mixed-subtype HCV infection results defined by 5′-RFLP analysis were not reproduced using the more sensitive HMA technique. All three HMA-confirmed multisubtype HCV infections occurred in subjects with documented IDU (Table 3).
TABLE 3.
Resolution of multiple genotype HCV test results using HMA
| Route of infection and patient | Result by:
|
Interpretation | |
|---|---|---|---|
| RFLP | HMA | ||
| IDU | |||
| 005a | 1b-to-2a switch | 1b | False 2a by RFLP |
| 015 | 2a-to-1a switch | 2a to 1a switch | Confirmed switched genotypes |
| 021 | 2a-to-3a switch | 3a | False 2a by RFLP |
| 030 | 1a-2a mix | 1a | False 2a by RFLP |
| 1a-1b-2a mix | 1a | False 1b-2a mix by RFLP | |
| 062 | 1a-1b mix | 1a-1b mix | Confirmed mixed genotypes |
| 068 | 1a-1b mix | 1b | False 1a by RFLP |
| 146 | 1a-2a mix | 1a | False 2a by RFLP |
| 177 | 1a-2a mix | 1a | False 2a by RFLP |
| 192 | 1a-1b mix | 1a | False 1b by RFLP |
| 198 | 1a-1b mix | 1b | False 1a by RFLP |
| 201 | 1a-1b mix | 1a | False 1b by RFLP |
| 267 | 2b-3a mix | 3a | False 2b by RFLP |
| 281 | 1a-2a mix | 1a | False 2a by RFLP |
| 292a | 1a-1b mix | 1a | False 1b by RFLP |
| 332 | 1a-to-2b switch | 1a-to-2b switch | Confirmed switched genotypes |
| 349 | 1a-1b mix | 1b | False 1a by RFLP |
| Blood transfusion | |||
| 050 | 1b-to2b-to-1b switch | Negative; 1b | Not confirmed |
| 086 | 1a-1b mix | 1a | False 1b by RFLP |
| 1b | 1a | False 1b by RFLP | |
| 310 | 1a-1b mix | 1b | False 1a by RFLP |
| Otherb | |||
| 020 | 1b-to-3a switch | 3a | False 1b by RFLP |
| 043 | 1a-1b mix | 1a | False 1b by RFLP |
| 105 | 1a-to-1b switch | 1a | False 1b by RFLP |
| 112 | 1a-1b mix | 1a | False 1b by RFLP |
| 113 | 1a-2a mix | 1a | False 2a by RFLP |
| 140 | 1a-1b mix | 1a | False 1b by RFLP |
| 154 | 1a-1b mix | 1b | False 1a by RFLP |
| 187 | 1a-1b mix | 1b | False 1a by RFLP |
| 243 | 1a-1b mix | 1a | False 1b by RFLP |
Route of infection includes both IDU and blood transfusion.
Other risk factors include greater than 10 lifetime sexual partners, sexual partners with history of IDU, tattooing, piercing, intranasal cocaine use, household contact with hepatitis C virus, and unknown.
HMA testing for multiple-subtype HCV infections in tissue compartments.
In a recent study, Di Liberto et al. reported that multiple-subtype HCV infections frequently occur in a tissue-restricted fashion in subjects with chronic hepatitis C. In an attempt to confirm this finding, HCV genotypes were determined by core/E1 probe hybridization analysis in 70 tissue compartments from 23 subjects with end-stage hepatitis C who were classified as having HCV genotype 1 infections based on 5′-RFLP analysis of serum specimens at an earlier date (Table 4). All 70 tissue compartment samples from the 23 subjects, including serum (n = 19), liver (n = 22), lymph node (n = 16), and PBMC (n = 13), were positive for HCV RNA. All 70 samples were analyzed by both 5′-RFLP and the HMA technique using the full panel of HCV subtype-specific probes (1a, 1b, 2a, 2b, and 3a). Using the 5′-RFLP assay, 2 of 23 subjects had evidence of multiple-subtype HCV infections. Using the HMA assay, there was no evidence of a second HCV subtype in any of the tissue compartments (0 of 70 specimens [0%]). Furthermore, the same HCV subtype (either 1a or 1b) that was detected in the serum compartment was also detected in the liver, lymph node, and PBMC compartments from the same subject, without exception (23 of 23 subjects). Figure 4 shows the HMA results of serum and tissue compartment samples from the two subjects with mixed-subtype HCV infections (1a and 1b) based on 5′-RFLP analysis using the panel of five subtype-specific probes (Fig. 4A through E). As shown in the figure, both subjects were infected with HCV subtype 1a in all seven compartments (Fig. 4A), and all compartments were negative for infections with subtypes 1b (B), 2a (C), 2b (D), and 3a (E). E1 gene nucleotide sequencing confirmed the genotyping results from the HMA test in seven of seven discordant samples (data not shown).
TABLE 4.
Genotyping of multiple compartments of subjects with end-stage liver disease by core/E1 probe hybridization
| Genotype by RFLP | No. of subjects (total, 23) | No. of specimens with genotype by probe hybridization:
|
||||||||||||||
|---|---|---|---|---|---|---|---|---|---|---|---|---|---|---|---|---|
| Serum
|
Liver
|
Lymph node
|
PBMCs
|
Total
|
||||||||||||
| 1a | 1b | Non-1 | 1a | 1b | Non-1 | 1a | 1b | Non-1 | 1a | 1b | Non-1 | 1a | 1b | Non-1 | ||
| 1a | 13 | 9 | 0 | 0 | 13 | 0 | 0 | 9 | 0 | 0 | 7 | 0 | 0 | 38 | 0 | 0 |
| 1b | 8 | 0 | 8 | 0 | 0 | 7 | 0 | 0 | 5 | 0 | 0 | 5 | 0 | 0 | 25 | 0 |
| 1a/1b | 2 | 2 | 0 | 0 | 2 | 0 | 0 | 2 | 0 | 0 | 1 | 0 | 0 | 7 | 0 | 0 |
FIG. 4.

HMA genotype analysis of the serum and tissue specimens from two subjects with mixed-subtype HCV infections (1a and 1b) based on 5′-RFLP analysis. Samples from seven different tissue compartments of the two subjects were each analyzed using the five HCV subtype-specific probes (1a, 1b, 2a, 2b, and 3a). (A) Hybridization with 1a probe. (B) Hybridization with 1b probe. (C) Hybridization with 2a probe. (D) Hybridization with 2b probe. (E) Hybridization with 3a probe. Lane 1 in each panel contains probe only; the specimens in lanes 2 to 8 were identical for each panel. Lane 2, serum specimen from patient 1; lane 3, liver specimen from patient 1; lane 4, lymph node specimen from patient 1; lane 5, PBMC specimen from patient 1; lane 6, serum specimen from patient 2; lane 7, liver specimen from patient 2; lane 8, lymph node specimen from patient 2.
DISCUSSION
HCV demonstrates nucleotide variability throughout its entire genome, a fact that has important implications not only for choosing therapeutic regimens, but also for understanding hepatitis C pathogenesis. Extensive distribution of HCV genomes throughout nonhepatic reservoirs has been described, and some evidence supports the hypothesis that different HCV variants may acquire specific tropism for hepatic versus nonhepatic reservoirs. However, the issue remains controversial, and one of the major limitations toward reaching consensus regarding this aspect of HCV virology is that there are many technical approaches described for assessing HCV genotype and quasispecies diversity, and some of these methods are naturally superior to others. The contributions of the present study are (i) description of a sensitive and specific assay (HMA) for evaluating the presence of mixed-genotype and -subtype HCV infections in serum and tissues, (ii) generation of additional data on specimens labeled as containing mixed-genotype HCV infections based on 5′-UTR analysis, and (iii) generation of data on the question of tissue sequestration of HCV subtypes using the HMA technique. The HMA technique failed to verify over 75% of multiple-subtype HCV infections in our field study specimens and also failed to verify the hypothesis that subjects with chronic hepatitis C frequently harbor infections with a second HCV genotype or subtype in nonhepatic compartments (11).
The HMA technique developed for the present study can detect secondary HCV subtypes at 1% of the concentration of primary subtypes. This level of sensitivity is roughly 10-fold greater than present methods of 5′-UTR analysis. Direct sequencing of less-conserved HCV genes, such as E1 or NS5B, is considered the “gold standard” of genotyping (20); in the present study, accuracy of the HMA technique versus E1 gene sequencing was 100% (n = 44 samples). Performing the present study using the sequencing approach would require analysis of 100 clones per specimen to reach the sensitivity provided by HMA.
There are several limitations of the 374-subject field study, including the fact that specimens were not systematically evaluated by HMA. Therefore, we may have missed a significant number of mixed-subtype infections not detected by the less-sensitive 5′-RFLP technique. The HMA technique is laborious and expensive, and the question of 5′-UTR test accuracy for assigning HCV genotypes has been more efficiently addressed by phylogenetic analysis of HCV coding regions. Other investigators, using a sequencing approach, have arrived at a similar conclusion to the present study relative to the frequency of mixed-genotype HCV infections in the peripheral circulation. One consistent error in conventional 5′-UTR-based assays is between subtypes 1a and 1b; about 20% of subtype 1a isolates were misclassified as subtype 1b due to differences of only a single nucleotide (6, 7). In other regions of the world, genotyping errors may confuse the classification of genotype 1 versus 6, 2a versus 2c, and possibly other situations.
Based on 5′-UTR results in the 374-subject cohort, 7.5% of the population had either mixed-subtype HCV infections or switching of HCV subtypes over time within the same patient (implying subtype superinfection). However, the frequencies of these two virological events were not different between populations with multiple HCV exposures (i.e., IDUs) versus single HCV exposures (i.e., blood transfusion recipients). When the data were generated using HMA, mixed-subtype infections and subtype-switching events were rare (0.8% of subjects) and were exclusively found in subjects with documented risk of multiple HCV exposures via the IDU route. Although insignificant from a statistical perspective, the association between high-risk behavior and confirmation of multiple-subtype HCV infections by HMA reinforces our laboratory-based conclusions regarding genotyping accuracy.
Despite the advantages of HMA, sensitivity is still insufficient to rule out the possibility that secondary subtype infections occur at very low levels in high-risk groups, below the assay detection limit. Furthermore, very few specimens were assayed over time, so transient or oscillating mixed infections could have been missed. Finally, quasispecies sampling is most accurate when viral titers are high, which was not always the case in tissues such as PBMCs. Therefore, HMA testing may have missed some multiple-subtype infections because of sampling bias.
As alluded to above, Di Liberto et al. reported that up to 24% of immunocompetent hepatitis C subjects were coinfected by two or more HCV genotypes or subtype variants (11). In the present study, 100% of PBMC samples were positive for HCV RNA. Serum contamination causing a PBMC signal was ruled out by extensive washing, monitoring of wash fractions for HCV RNA, and protease treatment of representative samples. Furthermore, sequencing of the envelope 2 hypervariable region indicated frequent differences in PBMC-associated genomes compared to serum-associated genomes (data not shown), confirming that PBMC signal was not derived from serum. HCV subtypes in the PBMCs were identical to that observed in serum, lymph nodes, or liver in 100% of cases, arguing against tissue sequestration of second subtype HCV infections. Our study patients differed from those studied by Di Liberto in that all had advanced-stage disease, and perhaps HCV dissemination differed for that reason.
Previous reports of HCV subtype sequestration have used 5′-UTR analysis to assign HCV genotypes (11, 33). The 5′-UTR, more conserved than other regions of the viral genome, is almost exclusively used for routine detection and genotype assignment of HCV in clinical assays (35). Whereas sequence conservation is desirable for consistent detection of HCV across genotypes, high conservation makes genotype characterization less reliable, because spurious point mutations can change assay results. Tissue sequestration of viral variants from the same quasispecies, with different 5′-UTR sequences in different tissues, has been previously demonstrated; data indicate that the phenomena may be important for tissue-specific translational regulation (14). For this reason, reports of sequestration of different HCV subtypes in different tissue compartments need to be validated by independent methods targeting different regions of the viral genome and in different patient populations.
In summary, the present study describes a new HMA method for assessing mixed-subtype HCV infections. HMA was capable of detecting second-subtype HCV infections at 1% the level of primary subtype infections. HMA also showed 100% concordance with nucleotide sequencing for assigning HCV subtype. Surprisingly, over 95% of “mixed-genotype” results based on 5′-UTR analysis in a field study were not reproducible using the HMA technique. Therefore, results from studies of HCV subtypes based on 5′-UTR analysis alone must be interpreted with caution.
Acknowledgments
We thank Thomas W. Hennessy, Carol Christensen, Chriss Homan, and James Williams for collection of clinical serum samples and Jeff Wilson for data organization and helpful discussion.
We thank the American Liver Foundation for the Postdoctoral Research Fellowship award to H. Li. This work was supported by grants U19 AI48214-02, AI049168-06, and R01 AI66209-01 from the National Institutes of Health.
Footnotes
Published ahead of print on 21 May 2008.
REFERENCES
- 1.Alter, M. J. 1995. Epidemiology of hepatitis C in the West. Semin. Liver Dis. 155-14. [DOI] [PubMed] [Google Scholar]
- 2.Alter, M. J., D. Kruszon-Moran, O. V. Nainan, G. M. McQuillan, F. Gao, L. A. Moyer, R. A. Kaslow, and H. S. Margolis. 1999. The prevalence of hepatitis C virus infection in the United States, 1988 through 1994. N. Engl. J. Med. 341556-562. [DOI] [PubMed] [Google Scholar]
- 3.Altschul, S. F., W. Gish, W. Miller, E. W. Myers, and D. J. Lipman. 1990. Basic local alignment search tool. J. Mol. Biol. 215403-410. [DOI] [PubMed] [Google Scholar]
- 4.Bukh, J., R. H. Miller, and R. H. Purcell. 1995. Genetic heterogeneity of hepatitis C virus: quasispecies and genotypes. Semin. Liver Dis. 1541-63. [DOI] [PubMed] [Google Scholar]
- 5.Bukh, J., R. H. Purcell, and R. H. Miller. 1993. At least 12 genotypes of hepatitis C virus predicted by sequence analysis of the putative E1 gene of isolates collected worldwide. Proc. Natl. Acad. Sci. USA 908234-8238. [DOI] [PMC free article] [PubMed] [Google Scholar]
- 6.Cantaloube, J.-F., S. Laperche, P. Gallian, F. Bouchardeau, X. de Lamballerie, and P. de Micco. 2006. Analysis of the 5′ noncoding region versus the NS5b region in genotyping hepatitis C virus isolates from blood donors in France. J. Clin. Microbiol. 442051-2056. [DOI] [PMC free article] [PubMed] [Google Scholar]
- 7.Chen, Z., and K. E. Weck. 2002. Hepatitis C virus genotyping: interrogation of the 5′ untranslated region cannot accurately distinguish genotypes 1a and 1b. J. Clin. Microbiol. 403127-3134. [DOI] [PMC free article] [PubMed] [Google Scholar]
- 8.Corbet, S., J. Bukh, A. Heinsen, and A. Fomsgaard. 2003. Hepatitis C virus subtyping by a core-envelope 1-based reverse transcriptase PCR assay with sequencing and its use in determining subtype distribution among Danish patients. J. Clin. Microbiol. 411091-1100. [DOI] [PMC free article] [PubMed] [Google Scholar]
- 9.Davidson, F., P. Simmonds, J. C. Ferguson, L. M. Jarvis, B. C. Dow, E. A. Follett, C. R. Seed, T. Krusius, C. Lin, G. A. Medgyesi, et al. 1995. Survey of major genotypes and subtypes of hepatitis C virus using RFLP of sequences amplified from the 5′ non-coding region. J. Gen. Virol. 761197-1204. [DOI] [PubMed] [Google Scholar]
- 10.Di Bisceglie, A. M., Z. D. Goodman, K. G. Ishak, J. H. Hoofnagle, J. J. Melpolder, and H. J. Alter. 1991. Long-term clinical and histopathological follow-up of chronic posttransfusion hepatitis. Hepatology 14969-974. [DOI] [PubMed] [Google Scholar]
- 11.Di Liberto, G., A. M. Roque-Afonso, R. Kara, D. Ducoulombier, G. Fallot, D. Samuel, and C. Feray. 2006. Clinical and therapeutic implications of hepatitis C virus compartmentalization. Gastroenterology 13176-84. [DOI] [PubMed] [Google Scholar]
- 12.Farci, P., A. Shimoda, A. Coiana, G. Diaz, G. Peddis, J. C. Melpolder, A. Strazzera, D. Y. Chien, S. J. Munoz, A. Balestrieri, R. H. Purcell, and H. J. Alter. 2000. The outcome of acute hepatitis C predicted by the evolution of the viral quasispecies. Science 288339-344. [DOI] [PubMed] [Google Scholar]
- 13.Farci, P., R. Strazzera, H. J. Alter, S. Farci, D. Degioannis, A. Coiana, G. Peddis, F. Usai, G. Serra, L. Chessa, G. Diaz, A. Balestrieri, and R. H. Purcell. 2002. Early changes in hepatitis C viral quasispecies during interferon therapy predict the therapeutic outcome. Proc. Natl. Acad. Sci. USA 993081-3086. [DOI] [PMC free article] [PubMed] [Google Scholar]
- 14.Forton, D. M., P. Karayiannis, N. Mahmud, S. D. Taylor-Robinson, and H. C. Thomas. 2004. Identification of unique hepatitis C virus quasispecies in the central nervous system and comparative analysis of internal translational efficiency of brain, liver, and serum variants. J. Virol. 785170-5183. [DOI] [PMC free article] [PubMed] [Google Scholar]
- 15.Holland, J., I. Bastian, R. M. Ratcliff, M. Y. Beers, P. Hahesy, H. Harley, D. R. Shaw, and G. D. Higgins. 1998. Hepatitis C genotyping by direct sequencing of the product from the Roche AMPLICOR test: methodology and application to a South Australian population. Pathology 30192-195. [DOI] [PubMed] [Google Scholar]
- 16.Houghton, M. 1996. Hepatitis C viruses, p. 1035-1057. In B. N. Fields, D. M. Knipe, and P. M. Howley (ed.), Virology. Lippincott-Raven, Philadelphia, PA.
- 17.Kato, N., M. Hijikata, Y. Ootsuyama, M. Nakagawa, S. Ohkoshi, T. Sugimura, and K. Shimotohno. 1990. Molecular cloning of the human hepatitis C virus genome from Japanese patients with non-A, non-B hepatitis. Proc. Natl. Acad. Sci. USA 879524-9528. [DOI] [PMC free article] [PubMed] [Google Scholar]
- 18.Khorsi, H., T. Salabi, S. Castelain, O. Jaillon, P. Zawadzki, J. P. Capron, F. Eb, C. Wychowski, and G. Duverlie. 1998. Amplification and detection of the terminal 3′ non-coding region of hepatitis C virus isolates. Res. Virol. 149115-121. [DOI] [PubMed] [Google Scholar]
- 19.Laskus, T., M. Radkowski, A. Bednarska, J. Wilkinson, D. Adair, M. Nowicki, G. B. Nikolopoulou, H. Vargas, and J. Rakela. 2002. Detection and analysis of hepatitis C virus sequences in cerebrospinal fluid. J. Virol. 7610064-10068. [DOI] [PMC free article] [PubMed] [Google Scholar]
- 20.Lau, J. Y., M. Mizokami, J. A. Kolberg, G. L. Davis, L. E. Prescott, T. Ohno, R. P. Perrillo, K. L. Lindsay, R. G. Gish, K. P. Qian, et al. 1995. Application of six hepatitis C virus genotyping systems to sera from chronic hepatitis C patients in the United States. J. Infect. Dis. 171281-289. [DOI] [PubMed] [Google Scholar]
- 21.Lerat, H., S. Rumin, F. Habersetzer, F. Berby, M. A. Trabaud, C. Trepo, and G. Inchauspe. 1998. In vivo tropism of hepatitis C virus genomic sequences in hematopoietic cells: influence of viral load, viral genotype, and cell phenotype. Blood 913841-3849. [PubMed] [Google Scholar]
- 22.Martell, M., J. I. Esteban, J. Quer, J. Genescà, A. Weiner, R. Esteban, J. Guardia, and J. Gómez. 1992. Hepatitis C virus (HCV) circulates as a population of different but closely related genomes: quasispecies nature of HCV genome distribution. J. Virol. 663225-3229. [DOI] [PMC free article] [PubMed] [Google Scholar]
- 23.McMahon, B. J., T. W. Hennessy, C. Christensen, D. Bruden, D. G. Sullivan, C. Homan, H. Deubner, M. G. Bruce, S. Livingston, J. Williams, and D. R. Gretch. 2004. Epidemiology and risk factors for hepatitis C in Alaska Natives. Hepatology 39325-332. [DOI] [PubMed] [Google Scholar]
- 24.McOmish, F., S. W. Chan, B. C. Dow, J. Gillon, W. D. Frame, R. J. Crawford, P. L. Yap, E. A. Follett, and P. Simmonds. 1993. Detection of three types of hepatitis C virus in blood donors: investigation of type-specific differences in serologic reactivity and rate of alanine aminotransferase abnormalities. Transfusion 337-13. [DOI] [PubMed] [Google Scholar]
- 25.O'Brien, C. B., B. S. Henzel, L. Wolfe, K. Gutekunst, and D. Moonka. 1997. cDNA sequencing of the 5′ noncoding region (5′ NCR) to determine hepatitis C genotypes in patients with chronic hepatitis C. Dig. Dis. Sci. 421087-1093. [DOI] [PubMed] [Google Scholar]
- 26.Ogata, N., H. J. Alter, R. H. Miller, and R. H. Purcell. 1991. Nucleotide sequence and mutation rate of the H strain of hepatitis C virus. Proc. Natl. Acad. Sci. USA 883392-3396. [DOI] [PMC free article] [PubMed] [Google Scholar]
- 27.Okamoto, H., S. Okada, Y. Sugiyama, K. Kurai, H. Iizuka, A. Machida, Y. Miyakawa, and M. Mayumi. 1991. Nucleotide sequence of the genomic RNA of hepatitis C virus isolated from a human carrier: comparison with reported isolates for conserved and divergent regions. J. Gen. Virol. 722697-2704. [DOI] [PubMed] [Google Scholar]
- 28.Okamoto, H., Y. Sugiyama, S. Okada, K. Kurai, Y. Akahane, Y. Sugai, T. Tanaka, K. Sato, F. Tsuda, Y. Miyakawa, et al. 1992. Typing hepatitis C virus by polymerase chain reaction with type-specific primers: application to clinical surveys and tracing infectious sources. J. Gen. Virol. 73673-679. [DOI] [PubMed] [Google Scholar]
- 29.Okuda, M., K. Hino, M. Korenaga, Y. Yamaguchi, Y. Katoh, and K. Okita. 1999. Differences in hypervariable region 1 quasispecies of hepatitis C virus in human serum, peripheral blood mononuclear cells, and liver. Hepatology 29217-222. [DOI] [PubMed] [Google Scholar]
- 30.Pal, S., D. G. Sullivan, S. Kim, K. K. Lai, J. Kae, S. J. Cotler, R. L. Carithers, Jr., B. L. Wood, J. D. Perkins, and D. R. Gretch. 2006. Productive replication of hepatitis C virus in perihepatic lymph nodes in vivo: implications of HCV lymphotropism. Gastroenterology 1301107-1116. [DOI] [PubMed] [Google Scholar]
- 31.Polyak, S. J., G. Faulkner, R. L. Carithers, Jr., L. Corey, and D. R. Gretch. 1997. Assessment of hepatitis C virus quasispecies heterogeneity by gel shift analysis: correlation with response to interferon therapy. J. Infect. Dis. 1751101-1107. [DOI] [PubMed] [Google Scholar]
- 32.Ray, S. C., Y.-M. Wang, O. Laeyendecker, J. R. Ticehurst, S. A. Villano, and D. L. Thomas. 1999. Acute hepatitis C virus structural gene sequences as predictors of persistent viremia: hypervariable region 1 as a decoy. J. Virol. 732938-2946. [DOI] [PMC free article] [PubMed] [Google Scholar]
- 33.Roque Afonso, A. M., J. Jiang, F. Penin, C. Tareau, D. Samuel, M.-A. Petit, H. Bismuth, E. Dussaix, and C. Feray. 1999. Nonrandom distribution of hepatitis C virus quasispecies in plasma and peripheral blood mononuclear cell subsets. J. Virol. 739213-9221. [DOI] [PMC free article] [PubMed] [Google Scholar]
- 34.Rosen, H. R., and P. Martin. 2000. Viral hepatitis in the liver transplant recipient. Infect. Dis. Clin. N. Am. 14761-784. [DOI] [PubMed] [Google Scholar]
- 35.Scott, J. D., and D. R. Gretch. 2007. Molecular diagnostics of hepatitis C virus infection: a systematic review. JAMA 297724-732. [DOI] [PubMed] [Google Scholar]
- 36.Simmonds, P. 2004. Genetic diversity and evolution of hepatitis C virus—15 years on. J. Gen. Virol. 853173-3188. [DOI] [PubMed] [Google Scholar]
- 37.Simmonds, P. 2001. The origin and evolution of hepatitis viruses in humans. J. Gen. Virol. 82693-712. [DOI] [PubMed] [Google Scholar]
- 38.Simmonds, P. 1995. Variability of hepatitis C virus. Hepatology 21570-583. [DOI] [PMC free article] [PubMed] [Google Scholar]
- 39.Simmonds, P., J. Bukh, C. Combet, G. Deleage, N. Enomoto, S. Feinstone, P. Halfon, G. Inchauspe, C. Kuiken, G. Maertens, M. Mizokami, D. G. Murphy, H. Okamoto, J. M. Pawlotsky, F. Penin, E. Sablon, I. T. Shin, L. J. Stuyver, H. J. Thiel, S. Viazov, A. J. Weiner, and A. Widell. 2005. Consensus proposals for a unified system of nomenclature of hepatitis C virus genotypes. Hepatology 42962-973. [DOI] [PubMed] [Google Scholar]
- 40.Simmonds, P., E. C. Holmes, T. A. Cha, S. W. Chan, F. McOmish, B. Irvine, E. Beall, P. L. Yap, J. Kolberg, and M. S. Urdea. 1993. Classification of hepatitis C virus into six major genotypes and a series of subtypes by phylogenetic analysis of the NS-5 region. J. Gen. Virol. 742391-2399. [DOI] [PubMed] [Google Scholar]
- 41.Simmonds, P., D. B. Smith, F. McOmish, P. L. Yap, J. Kolberg, M. S. Urdea, and E. C. Holmes. 1994. Identification of genotypes of hepatitis C virus by sequence comparisons in the core, E1 and NS-5 regions. J. Gen. Virol. 751053-1061. [DOI] [PubMed] [Google Scholar]
- 42.Stuyver, L., R. Rossau, A. Wyseur, M. Duhamel, B. Vanderborght, H. Van Heuverswyn, and G. Maertens. 1993. Typing of hepatitis C virus isolates and characterization of new subtypes using a line probe assay. J. Gen. Virol. 741093-1102. [DOI] [PubMed] [Google Scholar]
- 43.Stuyver, L., A. Wyseur, W. van Arnhem, F. Hernandez, and G. Maertens. 1996. Second-generation line probe assay for hepatitis C virus genotyping. J. Clin. Microbiol. 342259-2266. [DOI] [PMC free article] [PubMed] [Google Scholar]
- 44.Sullivan, D. G., D. Bruden, H. Deubner, S. McArdle, M. Chung, C. Christensen, T. Hennessy, C. Homan, J. Williams, B. J. McMahon, and D. R. Gretch. 2007. Hepatitis C virus dynamics during natural infection are associated with long-term histological outcome of chronic hepatitis C disease. J. Infect. Dis. 196239-248. [DOI] [PubMed] [Google Scholar]
- 45.Thompson, J. D., D. G. Higgins, and T. J. Gibson. 1994. CLUSTAL W: improving the sensitivity of progressive multiple sequence alignment through sequence weighting, position-specific gap penalties and weight matrix choice. Nucleic Acids Res. 224673-4680. [DOI] [PMC free article] [PubMed] [Google Scholar]
- 46.Vong, S., and B. P. Bell. 2004. Chronic liver disease mortality in the United States, 1990-1998. Hepatology 39476-483. [DOI] [PubMed] [Google Scholar]
- 47.Weiner, A. J., H. M. Geysen, C. Christopherson, J. E. Hall, T. J. Mason, G. Saracco, F. Bonino, K. Crawford, C. D. Marion, K. A. Crawford, et al. 1992. Evidence for immune selection of hepatitis C virus (HCV) putative envelope glycoprotein variants: potential role in chronic HCV infections. Proc. Natl. Acad. Sci. USA 893468-3472. [DOI] [PMC free article] [PubMed] [Google Scholar]
- 48.Wong, J. B., G. M. McQuillan, J. G. McHutchison, and T. Poynard. 2000. Estimating future hepatitis C morbidity, mortality, and costs in the United States. Am. J. Public Health 901562-1569. [DOI] [PMC free article] [PubMed] [Google Scholar]
- 49.Yamada, N., K. Tanihara, M. Mizokami, K. Ohba, A. Takada, M. Tsutsumi, and T. Date. 1994. Full-length sequence of the genome of hepatitis C virus type 3a: comparative study with different genotypes. J. Gen. Virol. 753279-3284. [DOI] [PubMed] [Google Scholar]