

Abstract
Tubular cell proliferation occurs early and precedes cyst formation in autosomal dominant polycystic kidney disease (ADPKD). To identify key alterations in cell signalling which regulate cell proliferation in ADPKD, we examined the potential role of insulin-like growth factor-1 (IGF-1) mediated signalling pathways. Conditionally immortalised tubular epithelial cells were generated from ADPKD patients with characterised germline PKD1 mutations and normal individuals. Germline and somatic PKD1 (but not PKD2) mutations were identified in PKD1 cystic cells by DHPLC. All lines showed a reduction or absence of polycystin-1 but normal polycystin-2 expression. Polycystin-1 deficiency was associated with increased sensitivity to IGF-1 as well as a permissive effect of cAMP on cell growth. The increase in cell proliferation to both agents was dependent on PI3 kinase and ERK activity. Inhibition of Ras or Raf activity also abolished stimulated cell proliferation. Ras activation assays revealed significantly higher IGF-1 stimulated levels of GTP-Ras in cystic cells compared to control cells but cAMP alone had no effect on GTP-Ras levels. These results suggest that haploinsufficiency of PC1 may lower the threshold for activation of a Ras-Raf mediated signalling cascade leading to growth-factor induced hyperproliferation. Inhibition of Ras or Raf activation could be a useful therapeutic approach to reducing tubular cell proliferation in ADPKD.
Introduction
Autosomal dominant polycystic kidney disease (ADPKD) is the most common inherited human renal disease (incidence 1 in 1000 live births) and is caused by mutations in two genes, PKD1 (85%) and PKD2 (15%). ADPKD is an important cause of end-stage renal failure, accounting for ∼10% of patients on renal replacement therapy. Fluid-filled cysts form in the kidney but cysts also commonly arise in the liver and pancreas. There is also an increased incidence of non-cystic extrarenal manifestations in ADPKD such as cardiac valve abnormalities, diverticular disease and intracranial aneurysms. [1]
The ADPKD proteins, polycystin-1 (PC1) and polycystin-2 (PC2) are believed to function as a complex, activating a number of key signalling pathways which in turn regulate diverse cellular functions. [2, 3]Cystic epithelial cells are characterised by a complex phenotype which includes changes in proliferation, apoptosis, fluid secretion, and matrix turnover. The increase in cell proliferation appears to be a consistent feature in human PKD tissue and in many experimental models of PKD. [4-6]Of relevance, it may presage cyst formation and there is evidence that inhibition of tubular cell proliferation may ameliorate the severity of the in vivo cystic phenotype in some rodent PKD models. [7]
Insulin-like growth factor-1 (IGF-1) is a multifunctional hormone which has pleiotropic effects on cellular proliferation, apoptosis, hypertophy, senescence and differentiation. Several lines of evidence suggested that IGF-1 may play a role in mediating tubular cell proliferation in the cystic kidney. First, kidney IGF-1 content in a rodent PKD model, the Han:SPRD rat, increased in parallel with the severity of cystic disease. Dietary lowering of kidney IGF-1 concentrations (soy bean diet) resulted in a parallel reduction in cystic disease severity. [8]Second, kidney IGF-1 mRNA is increased by four-fold in the recessive pcy mouse model which is orthologous to nephronopthisis Type III and characterised by rapidly progressive cystic disease. [9]Thirdly, mice transgenic for human growth hormone display a range of renal pathological changes which include pronounced cystic tubular dilatation. [10]
Identification of early key changes in cell signalling occurring downstream of PC1 or PC2 inactivation could lead to new therapeutic targets in ADPKD. This study therefore sought to examine the downstream signalling events induced by IGF-1 stimulation in vitro using several unique kidney cell lines derived from patients with defined germline PKD1 mutations. We also examined if this response was distinct from that mediated by cAMP.
Results
Polycystin expression in ADPKD cell lines
In one patient (OX938), three lines (C6, C7, C8) were generated from cells isolated from three individual cysts. In the other patients (OX161, SKI-001), cells derived from different cysts were pooled and cultured together. The germline PKD1mutations for OX938 (exon 16, 7000dup7) and OX161 (exon 15, E1537X) have been previously published and are predicted to truncate the protein proximal to the REJ domain (Fig 1A). [11]Significantly, all the ADPKD cell lines demonstrated a decrease in full-length PC1 expression which ranged from near absence in OX161 to being less than 50% in the other lines (Fig 1B). Of interest, we also detected smaller bands in one of the OX938 clones (C7) and in SKI-001 which appeared to be of different mobility to a major band detected at ∼200kDa in the two normal lines, UCL93/3 and CL11. The latter could represent a splice form but it is possible that the other N-terminal bands could be mutant short PC1 proteins. The germline mutation in OX938 might generate a predicted protein of ∼ 300kDa but the germline mutation in SKI-001 (IVS43-1G>A) cannot account for the lower band observed in this line. A somatic mutation (402delG) which is predicted to truncate the normal PKD1 allele was also detected in OX161 cystic DNA in addition to the germline mutation (E1537X) (Fig 1C). This probably accounts for the absence of full-length PC1 in OX161. Normal levels of PC2 were present in all cystic cells regardless of the level of PC1 (Fig 1B). We did not detect PKD2 mutations in any lines (data not shown).
Figure 1. Mutational analysis of PKD1 and PKD2 and characterisation of PC1 and PC2 expression in ADPKD cystic epithelial cell lines.
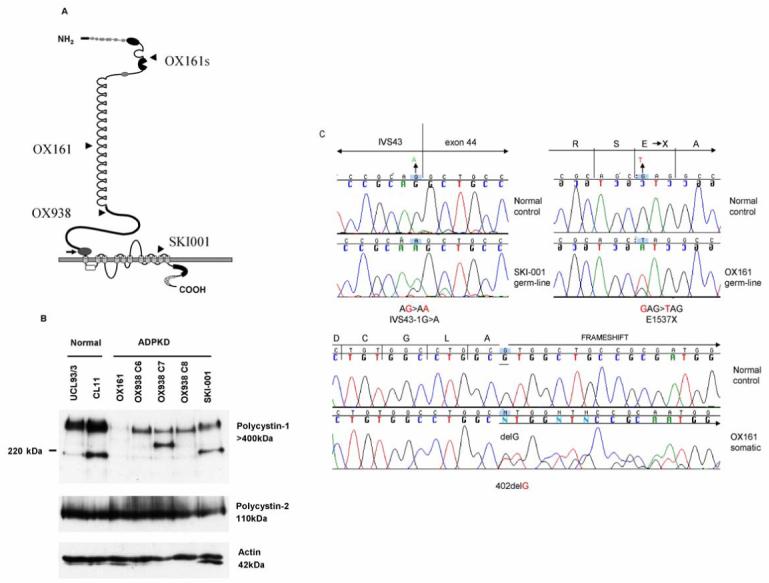
(A) The germline (and somatic ‘s’) mutations for each cystic line are displayed on the figure of PC1. (B) PC1 and PC2 expression was examined by immunoblot using specific antibodies to both proteins: 7e12 (PC1) and p30 (PC2) respectively. ‘Full-length’ PC1 (>400kDa) expression ranged from being absent (OX161) to a clear reduction in the other four ADPKD cell lines compared to the normal cells (UCL93/3, CL11). Of interest, smaller molecular weight bands were also detected with the N-terminal PC1 mAb (7e12) in normal cells (∼200 kDa) and in two of the cystic lines (OX938 C7, SKI-001). It is possible that these may represent splice forms and mutant protein bands respectively. Significantly, PC2 expression was not affected by differences in the dosage of PC1 between lines. Actin was used to control for loading. (C) Genomic and cellular DNA was screened for PKD1 and PKD2 mutations. The chromatograms indicate the germline and somatic PKD1 mutations present in OX161, and the germline PKD1 mutation in SKI-001. The germline mutation in OX938 has been previously reported. No PKD2 mutations were detected.
Cystic cells are more sensitive to IGF-1 than normal cells
We investigated the expression of the LT antigen at different temperatures in the cystic cell line, SKI-001. As shown in Fig 2A, cells grew at the permissive temperature (33°C) but not at non-permissive temperatures (37°C, 39°C). The destabilisation of the temperature-sensitive LT antigen at 37°C was further demonstrated by immunofluorescence staining (Fig 2B). Expression of cell junction markers such as cadherins were maintained at permissive and non-permissive temperatures (Fig 2B). Similar results were obtained with the cystic cell line, OX161 (data not shown).
Figure 2. IGF-1 stimulates cell proliferation in the PKD1 cystic line, SKI-001, in the absence of LT antigen expression.

LT antigen expression in SKI-001 cells was examined by (A) monitoring cell growth at different temperatures over 96h after plating; (B) immunoflurorescent staining for LT after 72h incubation at 33 °C (i) and 37°C (ii). Each data point shown in A is the mean ± SEM of triplicate wells (n=3). Pan-cadherin expression in the cells was localised to intercellular junctions in cells incubated at 33 °C (iii) and 37°C (iv). The effect of recombinant human IGF-1 on cell proliferation was examined over a wide dose range (0.001-1000 ng/ml) in a normal (UCL93/3) and cystic (SKI-001) cell line. Compared to the normal line, IGF-1 had a 3-4 times greater efficacy in stimulating cystic cell proliferation. Results are expressed as the % difference compared to control untreated cells ± SEM (* p<0.05) for three experiments performed in triplicate (C). These changes were mirrored in the changes in total cell counts between the two lines following IGF-1 treatment: a representative experiment of three is shown in D.
To investigate if there were any differences in the effect of IGF-1 on cell proliferation relating to a reduction in PC1, we initially compared the response of the cystic cell line SKI-001 to that of a normal line, UCL93. In normal cells, IGF-1 behaved as a weak mitogen (∼10-15% above control), over a wide concentration range (0.001-1000 ng/ml) (Fig 2). In cystic cells however, IGF-1 stimulated cell proliferation in a dose-dependent manner, as measured using a cell proliferation assay (Fig 2C) or by cell counts (Fig 2D).
cAMP stimulates cell proliferation in cystic cells but not in normal cells
ADPKD cystic cells have been reported to show a phenotypic switch to a cAMP-stimulatory proliferative response. Similarly, we found that the cAMP analogue dbcAMP, induced cell proliferation in cystic but not in normal cells (Fig 3A). Elevation of cAMP levels using other agents (forskolin, IBMX) produced a similar difference in responsiveness. Of interest, a combination of IGF-1 and dbcAMP demonstrated an additive effect (Fig 3A). These findings could be reproduced in all three cystic lines studied (Fig 3B) and suggest that IGF-1 and cAMP may be activating different signalling pathways.
Figure 3. cAMP stimulates cell proliferation in PKD1 cystic but not normal cell lines.
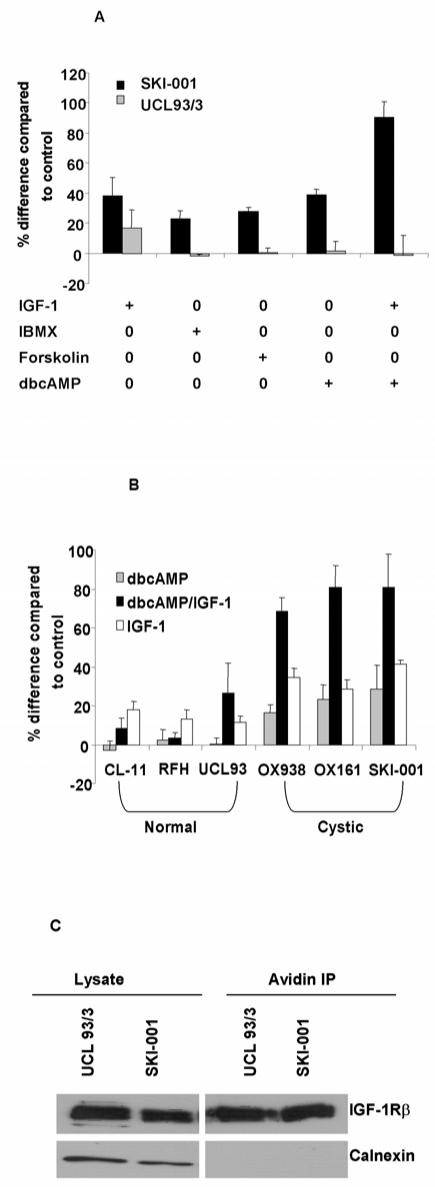
(A) Several agents which increase cellular cAMP concentrations such as dbcAMP (1 mM), forskolin (100 mM) and IBMX (0.5 mM) stimulated an increase in proliferation in the cystic line, SKI-001 but not the normal line, UCL 93/3. The graphs show the data from representative experiments performed in triplicate. (B) The cAMP analogue dbcAMP (1mM) stimulated cell proliferation in 3 PKD1 cystic lines (OX938 C8, OX161 and SKI-001) but not in 3 normal lines (CL11, RFH, UCL93). Of note, the effect of IGF-1 (50 ng/ml) was additive to the cAMP response in all 3 cystic lines. (C) The relative abundance of cell surface IGF-1 receptors between the cystic and normal lines was examined by surface biotinylation of the β subunit of the IGF-1 receptor. There was no difference in total (lysate) or surface (avidin IP) levels of IGF-1 receptors between the two cell lines. The ER resident protein calnexin served as a control for surface biotinylation and for protein loading.
Surface expression of the IGF-1 receptor is similar between normal and cystic cells
We compared the surface expression of the IGF-1 receptor between normal and cystic cells by surface biotinylation. As shown in Fig 3C, no difference in surface receptor abundance was apparent between the two lines. This indicates that the increased responsiveness of cystic cells to IGF-1 is unlikely to be related to differences in receptor number.
IGF-1 and cAMP induced proliferation in cystic cells is dependent of PI3-kinase and ERK activity
IGF-1 and cAMP have been reported to activate several well characterised signalling cascades involved in cell proliferation such as the PI3-kinase/Akt and the MEK/ERK pathways. To analyse the involvement of both pathways in the above response, we utilised specific inhibitors to PI3-kinase (LY924002) and MEK (PD98059). In initial experiments, both inhibited the individual and combined response of IGF-1 and dbcAMP in cystic cells in a dose-dependent manner (data not shown). The effect was reproducible for both inhibitors in all three cystic lines (Fig 4A). Another MEK inhibitor, UO126, similarly inhibited cell proliferation in response to IGF-1 and cAMP in a dose-dependent manner (data not shown).
Figure 4. IGF-1 and dbcAMP induced proliferation in cystic cells can be blocked by ERK and PI3K inhibitors.
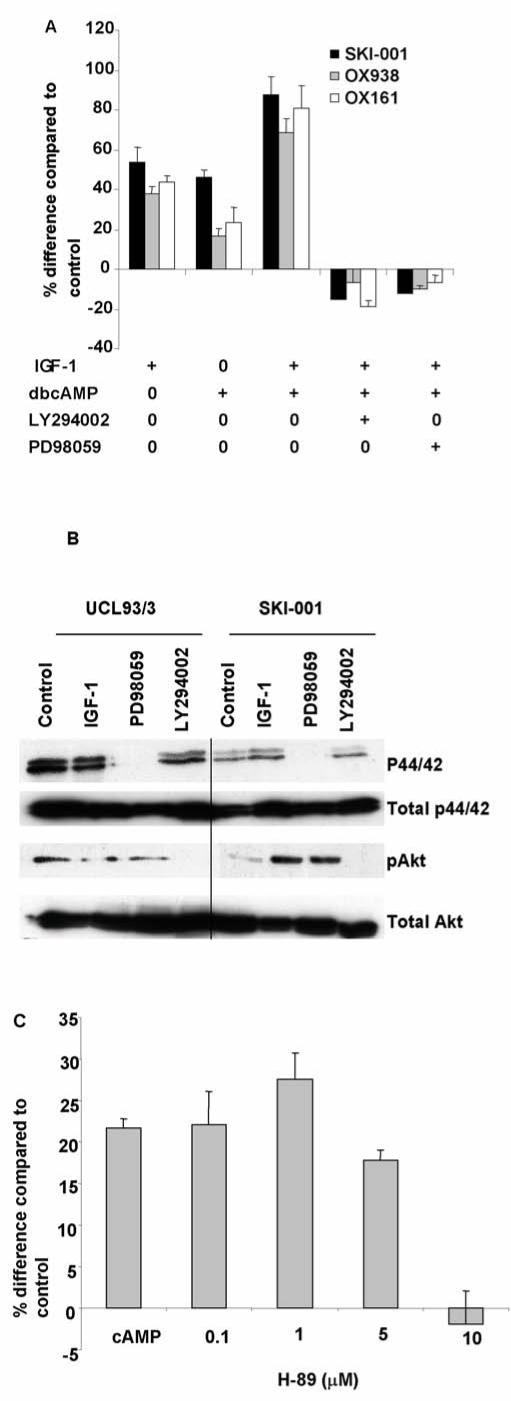
(A) The combined increase in cell proliferation mediated by IGF-1 and dbcAMP in the three cystic cell lines (SKI-001, OX938 C8 and OX161) were inhibited either by the ERK inhibitor (PD98059, 100 μM) or the PI3K inhibitor (LY294002, 50 μM). The effect was dose-dependent (data not shown). Data shown is representative of three experiments performed in triplicate. (B) Pretreatment of the cells with either PD98059 (100 μM) or LY294002 (50 μM) before IGF-1 stimulation abolished activation of ERK1/2 and Akt respectively. dbcAMP stimulation had no detectable effect on either ERK or Akt activation (data not shown). (C) The PKA inhibitor, H-89, inhibited dbcAMP stimulated cell proliferation in the cystic line SKI-001 in a dose-dependent manner by. Data shown is from three experiments performed in triplicate.
The effectiveness of the kinase inhibitors in the treated cells was analysed by immunoblotting using phospho-specific antibodies raised against pAkt and p44/42 ERK (Fig 4B). As expected, p44/42 ERK and pAkt were undetectable in the presence of PD98059 and LY924002 respectively despite IGF-1 stimulation. In cystic cells, IGF-1 stimulated small increases in p44/42 (1.4 fold increase over unstimulated) and a larger increase in pAkt (9.8 fold increase over unstimulated) in three experiments (Fig 4B). Small increases in p44/42 (1.7 fold) and pAkt (1.2 fold) were observed in normal cells. Incubation with dbcAMP did not alter either p44/42 or pAkt despite the inhibitory effects of the kinase inhibitors (data not shown). These results suggest that PI3-kinase and ERK activity may be permissive for the cAMP proliferative response rather than directly mediating its effect.
The mitogenic effect of cAMP on cell proliferation in cystic cells is dependent on protein kinase A (PKA)
Cyclic AMP can activate several downstream signalling pathways which can be PKA dependent or independent. In cystic cells, the PKA inhibitor, H89, inhibited dbcAMP stimulated mitogenesis in a dose-dependent manner (Fig 4C). This confirms previous reports that the cAMP phenotype is PKA-dependent. [12]
Knockdown of ras inhibits the combined effect of IGF-1 and dbcAMP on cell proliferation
The efficacy of PI3-kinase and ERK inhibitors on IGF-1 and cAMP stimulated proliferation led us to investigate upstream regulators of both pathways in cystic cells. The small G-protein Ras is a key molecule that is known to activate both PI3-kinase and ERK (via Raf and MEK). All three major isoforms of ras namely N, K, H-Ras could be detected in the SKI-001 cystic line by RT-PCR (Fig 5A). By Q-PCR, we confirmed that N-ras expression was the highest of the 3 isoforms but there were no qualitative or quantitative differences between cystic and normal cells (data not shown).
Figure 5. Knock down of ras isoforms blocked the effect of IGF-1 and cAMP on cystic cell proliferation.
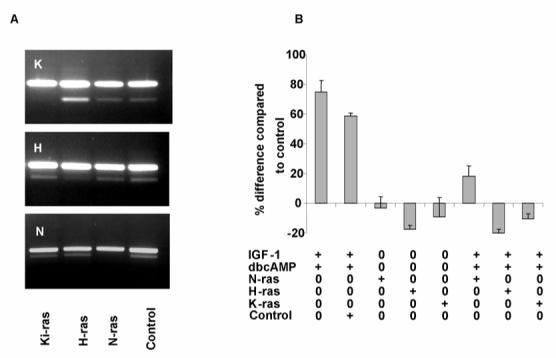
(A) All three major ras isoforms (N-, H-, Ki-) could be detected in normal and cystic cells by RT-PCR (not shown). N-ras was the major isoform expressed by Q-PCR. The specificity for each individual siRNA to knockdown each ras isoform in SKI-001 cells was examined at 48h after transfection by semi-quantitative PCR in the linear range of the curve (21-23 cycles) with a control (actin) reaction. As shown on the gel, the effect was specific for the isoform. The major upper band is actin. (B) Knock down of either N-, H- or Ki-ras was sufficient to block the proliferative effect of either individual (not shown) or combined IGF-1/dbcAMP stimulation. The graph shows data from three experiments performed in triplicate. Scrambled siRNA was used as a negative control.
Knockdown of ras mRNA was conducted using siRNA previously validated on another SV40 transformed human kidney cell line, HKC. In this line, the siRNA used achieved a knockdown of 71% for H-Ras, 82% for K-Ras and 76% for N-Ras as assessed by Q-PCR. In our cystic line (SKI-001), we were able to achieve a >90% transfection efficiency as assessed by uptake of a fluorescent-labelled oligo using lipofectamine (not shown). Significant and specific knockdown of each isoform in SKI-001 was demonstrated by semiquantitative RT-PCR (Fig 5A). Of relevance, the combined IGF-1 and dbcAMP induced proliferative responses in cystic cells was abolished by each of the three ras siRNA but not by an irrelevant control siRNA (Fig 5B).
Ras activation in cystic and normal cells
Since both IGF-1 and cAMP responses appeared to be Ras-dependent, we next examined whether both agents would activate Ras directly using a Ras activation assay. As shown in Fig 6A, IGF-1 stimulation resulted in a two fold increase in GTP-Ras in cystic cells but not in normal cells. dbcAMP alone had no discernible effect on GTP-Ras levels in either cystic or control cells (Fig 6A).
Figure 6. Ras and Raf activity in cystic cells stimulated with IGF-1 and cAMP.
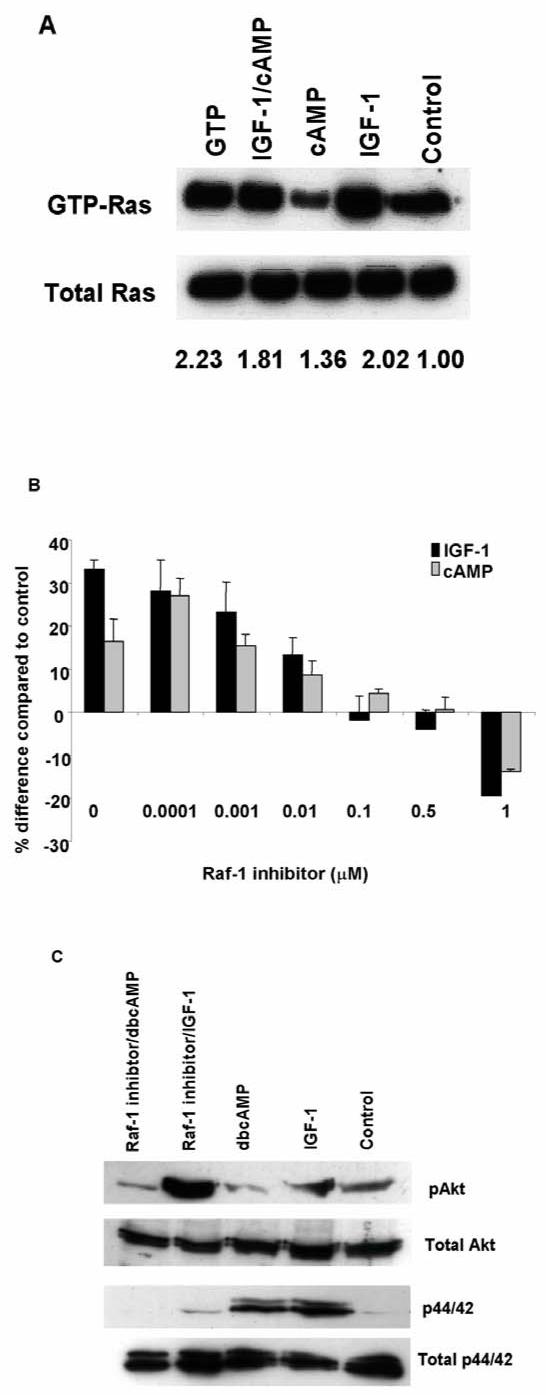
(A) Ras activation by IGF-1 and cAMP was investigated using a commercial Ras activity assay which detects GTP-Ras. Total Ras was detected using a pan-Ras antibody. One representative experiment of three is shown. As a positive control, cell lysate was treated with GTP-γ-S prior to pull down with GST-Raf1-RBD (lane ‘GTP’). The numbers displayed show the mean increase in GTP-Ras (corrected to total Ras) in three separate experiments as assessed by densitometry. The signal from control unstimulated cells was corrected to a value of 1. IGF-1 (50 ng/ml) stimulated Ras activity by two fold in cystic (SKI-001) but not in normal cells. DbcAMP (1mM) did not activate Ras in either cell line. (B) The Raf inhibitor, BAY 43-9006, inhibited IGF-1 and dbcAMP stimulated proliferation in cystic cells. Data shown is from three experiments performed in triplicate. (C) Preincubation with BAY 43-9006 (0.5 μM for 2h) abolished IGF-1 stimulated p44/42 ERK but not pAkt phosphorylation in cystic cells.
The Raf inhibitor BAY 43-9006 inhibits both IGF-1 and cAMP stimulated proliferation in cystic cells
Consistent with the effects of ras siRNA, the Raf inhibitor, BAY 43-9006, inhibited both IGF-1 and dbcAMP stimulated cell proliferation in SKI-001 in a dose dependent manner (Fig 6B). Preincubation with BAY 43-9006 (0.5 μM) blocked the increase in p44/42 ERK induced by IGF-1 but not of pAkt (Fig 6C). Although this compound can inhibit other kinases, these results indicate that the inhibition of Raf-dependent ERK activation is the basis of this response.
Discussion
One of the earliest changes evident in the PKD kidney is an increase in tubular proliferative activity. We and others have demonstrated that proliferating cells can be frequently detected in tubular segments of normal calibre and often are relatively sparse in larger cysts. [6]These findings suggest that the increase in proliferative activity is an early event and may predispose these cells to the acquisition of a cystic phenotype. In support of this, recent studies in rodent PKD models have demonstrated a direct correlation between suppression of the cystic phenotype and a decrease in proliferative activity in non-cystic tubules. [7]
An inverse relationship between PC1 dosage and cell proliferation has been demonstrated by over-expressing the heterologous gene, generating deficient cells from murine knockout models, using antisense or a dominant negative construct (isolated C-terminus). [13-16]In summary, an increase in PC1 expression suppresses and a decrease in PC1 expression or function increases the proliferative rate. Nonetheless, the critical pathways that mediate the antiproliferative effect of PC1 (or PC2) have not been fully eludicated. PC1 and PC2 have been shown to activate a number of signalling intermediates such as small G-proteins, cAMP and Ca2+. These in turn can activate several pathways including the JAK/STAT, Akt/PI3K and ERK enzymes by overexpression in heterologous systems. [13, 17, 18]
Since previous studies have utilised freshly isolated cystic cells from ADPKD patients of uncertain genotype, we set out to generate renal cystic lines from PKD1 patients with defined germline mutations as model systems, to exclude the influence of genotype. Of interest, a reduced level of full-length PC1 was detectable in 4 out of 5 PKD1 lines and normal PC2 levels were present in all 5 lines. This suggests that cystic transformation does not always require a ‘two hit’ (or transheterozygote) mechanism. [19]In the one line with absent PC1 expression (OX161), we found a single somatic PKD1 mutation which is predicted to truncate the normal PC1 protein. The finding of some PC1 expression in ∼80% of the lines is consistent with our previous studies of PC1 expression by individual cysts in PKD1 kidneys with defined germline truncating mutations. [20]Nevertheless, apart from the OX938 clones, the other lines were derived from a mixed population of cystic cells so it is possible that a range of different somatic PKD1 mutations which we did not detect could be present.
Two groups have previously described the additive effect of EGF and cAMP on cell proliferation in ADPKD cystic cells. [21, 22]However, the response to IGF-1 has not been previously reported. Unlike IGF-1, the mitogenic response to EGF has been reported to be the same between normal and cystic cells. [21, 22]Overall, our findings suggest that PC1 deficiency may give rise to a lowered threshold for activation of the ERK and Akt pathways by IGF-1 via the Ras/Raf cascade. It has been reported that cyst epithelial cells isolated from Pkd1 null mice kidney are hyperproliferative in the presence of serum but not in its absence; in addition, they do not grow in nude mice. [14]This indicates that PC1 deficiency gives rise to an increased sensitivity to growth factors but not to autonomous cell growth.
We were able to reproduce the reported switch to a cAMP-proliferative phenotype in three different PKD1 cystic cell lines suggesting that this is a consistent finding relating to PC1 deficiency. However we observed a neutral rather than an inhibitory effect of cAMP on basal or EGF-stimulated proliferation of normal cell lines, similar to one previous report. [21, 22]It has been reported that basal and stimulated cAMP concentrations (as well as cAMP responsive currents) in human ADPKD cystic cells are not significantly different to normal cells. [12, 22]This implies that the cAMP mitogenic response is not merely related to a change in cAMP synthesis or degradation in cystic cells.
We found that blockade of Ras, Raf and ERK could abolish the cAMP response in cystic cells and yet biochemical evidence of acute cAMP activation of Ras or its downstream effector ERK was not detected. These findings differ from those described by another group who reported acute ERK activation in response to cAMP analogues or cAMP mobilising agents although direct activation of Ras by cAMP was not examined. [12, 22]One possibility is that this pathway is permissive for the cAMP response in our cells rather than directly mediating it. Alternatively, since cAMP may have both acute and chronic effects on B-Raf, it may be that the longer term effects of cAMP on the Ras-Raf pathway are more important in our cells than the acute effects. [23]Transgenic expression of a H-Ras oncogenic mutant protein under the control of a γ-glutamyltranspeptidase (γGt) promoter is associated with a renal cystic phenotype. [24]However, we found no difference in the efficacy of isoform specific ras siRNA to abrogate the mitogenic response to IGF-1 or dbcAMP.
Since Akt has been shown to inhibit B-Raf activity in normal cells, it has been postulated that polycystin deficiency could lead to a derepression of B-Raf by reducing PIP3-dependent Akt activation. In support of this, incubation of M1 cells with the PI3-kinase inhibitor (LY294002) or an Akt inhibitor was associated with both a small increase in B-raf activity (45 min) and a larger increase in total B-Raf protein (5 h). [23]Thus inhibition of Akt activity could lower the threshold for cAMP stimulation of the Ras/Raf/ERK pathway in M1 cells. Increased basal pAkt expression and PI3-kinase activity have been reported in clonal MDCK cells over-expressing PKD1. [18]However, kidney pAkt levels were also found to be elevated in a Pkd1 knockout mouse model compared to controls. [14]Thus the role of Akt in mediating the cAMP mitogenic response requires further study.
Finally in preliminary studies, OX161 and SKI-001 were found to predominantly form cysts in Type I collagen gels. Further work will assess the efficacy of Ras-Raf inhibition in inhibiting cyst growth in this system and other in vivo models of ADPKD [25].
Materials and methods
Generation of conditionally immortalized normal and cystic cell lines
Conditional immortalised cystic (OX161/1, SKI-001, OX938) and non cystic (UCL93/3, RFH) epithelial cells were prepared from tubular cells isolated from normal or PKD human kidneys removed for clinical indications. Primary cultures were transduced at an early passage (P1-4) with a replication-defective retroviral vector containing the temperature-sensitive LT-antigen and the catalytic subunit of human telomerase. [26]A shift to the permissive temperature (33°C) allows activity of the LT-antigen, which destabilises at higher temperatures (37°C), as shown for the cystic line SKI-001 (Fig 2). Cells were grown in Dulbecco’s Modified Eagles Medium-Ham’s 12 (DMEM-F12) supplemented with 1% L-Glutamine, 5% NuSerum (Becton Dickinson, Oxford) and 1% antibiotic/antimycotic solution (Invitrogen, Burlington, ON). [27]CL-11, a SV40LT-immortalised normal human proximal tubule line, was a gift from Dr L. Racusen (John Hopkins, Baltimore).
Mutation screening for PKD1 and PKD2 in genomic and cystic DNA
All coding exons of the PKD1 and PKD2 genes were amplified from genomic DNA by PCR using primers and protocols that we have previously reported [11, 28]or newly developed unpublished primers. For the duplicated portion of PKD1, a PKD1-specific long-range PCR is generated as template for the nested-PCR, as previously described. [11]Amplicons were analyzed for mutations by Denaturing High-Pressure Liquid Chromatography (DHPLC) using the Wave system 3500HT (Transgenomic Inc, Omaha, USA) followed by direct sequencing of abnormal chromatograms according to previously described protocols. [11]Mutations were validated by means of analysis of a normal control population, by segregation analysis in the family, by comparative genomics and bioinformatic tools. They are numbered starting from the first ATG. Cellular DNA from OX161/1 and SKI-001 was analysed for mutations.
Cell proliferation assay
Cystic and normal cells were seeded into 96-well plates at a seeding density of 2 × 10³ cells per well. Cells were grown in complete medium for 24hrs to reach 70% confluency after which cells were cultured without serum for 48hrs at 37°C to induce quiescence. Cells were then treated with IGF-1 (50 ng/ml) or dibutyryl cAMP (dbcAMP, 1mM) for a further 48hrs at 37°C. For inhibitor studies, cells were pre-treated with LY294002 (50 μM), PD98059 (100 μM) or BAY-43 9006 (0.5 μM) 2-4 hrs prior to stimulation. Cell proliferation was determined using the Promega Cell Titer 96 Aqueous One assay (Promega, UK). This assay showed a direct correlation with the number of cells by cell counts as has been described. [22]
Ras Isoform specific siRNA Transfection
Isoform specific siRNA to human Ras was chemically synthesised by Qiagen-Xeragon (Germantown, MD) according to the following sequences: N-RAS 5′-AACTGGCCAAGAGTTACGGGA-3′, K-RAS 5′-GGAGGGCTTTCTTTGTGTATT-3′, HA-RAS 5′-AAGCAGGTGGTCATTGATGGG-3′. A scrambled negative control siRNA (Silencer) was purchased from Ambion (Austin, USA). Transfection of siRNA into cells was achieved using Lipofectamine reagent (Invitrogen). To check transfection efficiency, fluorescent oligos were utilized (BLOCK-iT, Invitrogen) and cells analysed after 24hr by fluorescent microscopy.
RNA analysis of specific ras isoforms
Cellular expression of ras mRNA was determined by RT-PCR using isoform-specific primers: N-RAS forward 5′-GAAAAGCGCACTGACAATCC-3′reverse 5′-CACCACACATGGCAATCCC-3′, Ki (4B)-RAS forward 5′-AGTGCCTTGACGATACAG-3′reverse 5′-GCATCATCAACACCCTGTCTT-3′, HA-RAS 5′-CAAGAGTGCGCTGACCATCC3′ reverse 5′-CCGGATCTCACGCACCAAC-3′. B-actin was amplified as an internal standard using the sequences: forward 5′-CCCACACTGTGCCCATC-3′ reverse 5′-TGATCCACATCTGCTGGAAG-3′. Total cellular RNA was extracted using TRIZOL reagent (Invitrogen) and reverse-transcribed with a Retroscript Kit (Ambion, CA, USA). DNA contamination of the RNA samples was removed by using an Ambion DNA-free kit. Synthesised cDNA was utilized in a RT-PCR reaction and analysed by gel electrophoresis. Knock-down by ras siRNA was assessed using semi-quantitative RT-PCR in the linear range of the curve (21-23 cycles), utilising β-actin as a control.
Quantitative PCR (QPCR) for specific ras isoforms
For QPCR, cDNA was reverse transcribed from total RNA using the Omniscript reverse transcription kit from Qiagen and random decamers (Promega). The 20 μl cDNA solution was made up to 100 μl with RNAse free water. Quantitative PCR was performed with an Applied Biosystems PCR System in a volume of 25 ul, containing TaqMan 2X Universal PCR Master Mix, cDNA, and optimized primer/probe solutions for each of the ras isoforms. Ras isoform cDNA levels were normalised to 18S ribosomal RNA.
Western blot analysis
Expression levels of PC1 and -2 were analysed by immunoblotting using specific antibodies raised to the N-terminus of PC1 (7e12) and C-terminus of PC2 (p30). Detailed characterisation of both antibodies has been published. [20, 29]
To assess the effect of IGF-1 and db-cAMP on ERK and Akt activation, cells were made quiescent by a step-wise reduction of serum initially to 1% for 48hrs and then to serum-free medium for a further 24hrs. Cells were stimulated with IGF-1 or dbcAMP for 15 min with or without a 4hr pre-treatment with kinase inhibitors. Cells were solubilised in detergent lysis buffer (50 mM Tris, 0.14M NaCl, 0.4% Triton X-100, 1mM Na3V04, 10 mM NaF) supplemented with Complete protease inhibitors (Roche, Mannheim, Germany). Supernatants were clarified by centrifugation and immunoblotting performed as previously described. [30]For quantitation, blots were scanned using a Biorad model imaging densitometer and analysed by Multianalyst software.
Ras activity assay
Ras activation was measured using the EZ-Detect Ras activation kit (Pierce, Rockford, IL). The kit uses a GST-fusion protein containing RBD of Raf1 to specifically pull-down active GTP-bound Ras. Cell lysates were incubated with GST-Raf1-RBD and swellGel Immobilized Glutathione Disc. The pulled-down active Ras was then detected by western blotting using a pan-Ras antibody. As a positive control, cell lysate was treated with GTP-γ-S prior to pull down with GST-Raf1-RBD.
Cell surface biotinylation for IGF-1 receptor
Cells were cultured to confluency in 10cm dishes, washed three times with PBS and surface biotinylated with sulpho-NHS-LC-Biotin (Pierce) prior to lysis as previously described. [31]Equal amounts of cell lysate were incubated with 100 μl streptavidin beads overnight at 4°C. After extensive washing, biotinylated proteins were eluted in 2x SDS loading buffer and analysed by SDS-PAGE and western blotting using the antibodies described.
Statistical Analyses
Mean and SEM were calculated, and levels of significant difference (p<0.05) were determined by the unpaired t test.
Materials
Dibutyryl cAMP, forskolin and IBMX were obtained from Sigma-Aldrich (Dorset, UK), LY294002, PD98059, UO126 and H89 were purchased from Calbiochem (UK). Antibodies to pAkt (Ser473), total Akt, p44/42 (ERK1/2) and total p44/42 (ERK1/2) were purchased from Cell Signalling Technology (Beverly, MA). Antibodies to IGF-1 receptor β chain, LT-antigen and pan-cadherin were purchased from Santa Cruz Biotechnology (Santa Cruz, CA) and Cambridge Bioscience (Cambs, UK). Recombinant human IGF-1 and the Raf inhibitor, BAY-43 9006 were gifts of Chiron (Emeryville, CA) and Bayer (West Haven, CT) respectively.
Acknowledgements
This work was funded by grants from the Sheffield Teaching Hospitals Charitable Trustees, Sheffield Kidney Research Foundation and the Wellcome Trust (GR071201). We thank Simon Cook for helpful comments on the manuscript and John Haylor for helpful discussion. CCS is a DoH/MRC Clinician Scientist and ACMO is a Wellcome Trust Research Leave Senior Fellow.
References
- 1.Wilson PD. Polycystic kidney disease. N Engl J Med. 2004;350:151–164. doi: 10.1056/NEJMra022161. [DOI] [PubMed] [Google Scholar]
- 2.Ong AC, Harris PC. Molecular pathogenesis of ADPKD: The polycystin complex gets complex. Kidney Int. 2005;67:1234–1247. doi: 10.1111/j.1523-1755.2005.00201.x. [DOI] [PubMed] [Google Scholar]
- 3.Calvet JP, Grantham JJ. The genetics and physiology of polycystic kidney disease. Semin Nephrol. 2001;21:107–123. doi: 10.1053/snep.2001.20929. [DOI] [PubMed] [Google Scholar]
- 4.Lanoix J, D’Agati V, Szabolcs M, Trudel M. Dysregulation of cellular proliferation and apoptosis mediates human autosomal dominant polycystic kidney disease (ADPKD) Oncogene. 1996;13:1153–1160. [PubMed] [Google Scholar]
- 5.Nadasdy T, Laszik Z, Lajoie G, et al. Proliferative activity of cyst epithelium in human renal cystic diseases. J Am Soc Nephrol. 1995;5:1462–1468. doi: 10.1681/ASN.V571462. [DOI] [PubMed] [Google Scholar]
- 6.Chang MY, Parker E, Ibrahim S, et al. Haploinsufficiency of Pkd2 is associated with increased tubular cell proliferation and interstitial fibrosis in two murine Pkd2 models. Nephrol Dial Transplant. 2006;21:2078–2084. doi: 10.1093/ndt/gfl150. [DOI] [PubMed] [Google Scholar]
- 7.Tao Y, Kim J, Schrier RW, Edelstein CL. Rapamycin markedly slows disease progression in a rat model of polycystic kidney disease. J Am Soc Nephrol. 2005;16:46–51. doi: 10.1681/ASN.2004080660. [DOI] [PubMed] [Google Scholar]
- 8.Aukema HM, Housini I. Dietary soy protein effects on disease and IGF-I in male and female Han:SPRD-cy rats. Kidney Int. 2001;59:52–61. doi: 10.1046/j.1523-1755.2001.00465.x. [DOI] [PubMed] [Google Scholar]
- 9.Nakamura T, Ebihara I, Nagaoka I, et al. Growth factor gene expression in kidney of murine polycystic kidney disease. J Am Soc Nephrol. 1993;3:1378–1386. doi: 10.1681/ASN.V371378. [DOI] [PubMed] [Google Scholar]
- 10.Wanke R, Hermanns W, Folger S, et al. Accelerated growth and visceral lesions in transgenic mice expressing foreign genes of the growth hormone family: an overview. Pediatr Nephrol. 1991;5:513–521. doi: 10.1007/BF01453693. [DOI] [PubMed] [Google Scholar]
- 11.Rossetti S, Chauveau D, Walker D, et al. A complete mutation screen of the ADPKD genes by DHPLC. Kidney Int. 2002;61:1588–1599. doi: 10.1046/j.1523-1755.2002.00326.x. [DOI] [PubMed] [Google Scholar]
- 12.Yamaguchi T, Nagao S, Wallace DP, et al. Cyclic AMP activates B-Raf and ERK in cyst epithelial cells from autosomal-dominant polycystic kidneys. Kidney Int. 2003;63:1983–1994. doi: 10.1046/j.1523-1755.2003.00023.x. [DOI] [PubMed] [Google Scholar]
- 13.Bhunia AK, Piontek K, Boletta A, et al. PKD1 Induces p21(waf1) and Regulation of the Cell Cycle via Direct Activation of the JAK-STAT Signaling Pathway in a Process Requiring PKD2. Cell. 2002;109:157–168. doi: 10.1016/s0092-8674(02)00716-x. [DOI] [PubMed] [Google Scholar]
- 14.Nishio S, Hatano M, Nagata M, et al. Pkd1 regulates immortalized proliferation of renal tubular epithelial cells through p53 induction and JNK activation. J Clin Invest. 2005;115:910–918. doi: 10.1172/JCI22850. [DOI] [PMC free article] [PubMed] [Google Scholar]
- 15.Kim H, Bae Y, Jeong W, et al. Depletion of PKD1 by an antisense oligodeoxynucleotide induces premature G1/S-phase transition. Eur J Hum Genet. 2004;12:433–440. doi: 10.1038/sj.ejhg.5201136. [DOI] [PubMed] [Google Scholar]
- 16.Sutters M, Yamaguchi T, Maser RL, et al. Polycystin-1 transforms the cAMP growth-responsive phenotype of M-1 cells. Kidney Int. 2001;60:484–494. doi: 10.1046/j.1523-1755.2001.060002484.x. [DOI] [PubMed] [Google Scholar]
- 17.Parnell SC, Magenheimer BS, Maser RL, et al. Polycystin-1 activation of c-Jun N-terminal kinase and AP-1 is mediated by heterotrimeric G proteins. J Biol Chem. 2002;277:19566–19572. doi: 10.1074/jbc.M201875200. [DOI] [PubMed] [Google Scholar]
- 18.Boca M, Distefano G, Qian F, et al. Polycystin-1 Induces Resistance to Apoptosis through the Phosphatidylinositol 3-Kinase/Akt Signaling Pathway. J Am Soc Nephrol. 2006 doi: 10.1681/ASN.2005050534. [DOI] [PMC free article] [PubMed] [Google Scholar]
- 19.Ong AC, Harris PC. Molecular basis of renal cyst formation--one hit or two? Lancet. 1997;349:1039–1040. doi: 10.1016/S0140-6736(05)62286-6. [DOI] [PubMed] [Google Scholar]
- 20.Ong AC, Harris PC, Davies DR, et al. Polycystin-1 expression in PKD1, early-onset PKD1, and TSC2/PKD1 cystic tissue. Kidney Int. 1999;56:1324–1333. doi: 10.1046/j.1523-1755.1999.00659.x. [DOI] [PubMed] [Google Scholar]
- 21.Hanaoka K, Guggino WB. cAMP regulates cell proliferation and cyst formation in autosomal polycystic kidney disease cells. J Am Soc Nephrol. 2000;11:1179–1187. doi: 10.1681/ASN.V1171179. [DOI] [PubMed] [Google Scholar]
- 22.Yamaguchi T, Pelling JC, Ramaswamy NT, et al. cAMP stimulates the in vitro proliferation of renal cyst epithelial cells by activating the extracellular signal-regulated kinase pathway. Kidney Int. 2000;57:1460–1471. doi: 10.1046/j.1523-1755.2000.00991.x. [DOI] [PubMed] [Google Scholar]
- 23.Yamaguchi T, Wallace DP, Magenheimer BS, et al. Calcium restriction allows cAMP activation of the B-Raf/ERK pathway, switching cells to a cAMP-dependent growth-stimulated phenotype. J Biol Chem. 2004;279:40419–40430. doi: 10.1074/jbc.M405079200. [DOI] [PubMed] [Google Scholar]
- 24.Schaffner DL, Barrios R, Massey C, et al. Targeting of the rasT24 oncogene to the proximal convoluted tubules in transgenic mice results in hyperplasia and polycystic kidneys. Am J Pathol. 1993;142:1051–1060. [PMC free article] [PubMed] [Google Scholar]
- 25.Chang MY, Parker E, El Nahas M, et al. Endothelin B receptor blockade accelerates disease progression in a murine model of autosomal dominant polycystic kidney disease. J Am Soc Nephrol. 2007;18:560–569. doi: 10.1681/ASN.2006090994. [DOI] [PubMed] [Google Scholar]
- 26.O’Hare MJ, Bond J, Clarke C, et al. Conditional immortalization of freshly isolated human mammary fibroblasts and endothelial cells. Proc Natl Acad Sci U S A. 2001;98:646–651. doi: 10.1073/pnas.98.2.646. [DOI] [PMC free article] [PubMed] [Google Scholar]
- 27.Streets AJ, Newby LJ, O’Hare MJ, et al. Functional analysis of PKD1 transgenic lines reveals a direct role for polycystin-1 in mediating cell-cell adhesion. J Am Soc Nephrol. 2003;14:1804–1815. doi: 10.1097/01.asn.0000076075.49819.9b. [DOI] [PubMed] [Google Scholar]
- 28.Rossetti S, Strmecki L, Gamble V, et al. Mutation analysis of the entire PKD1 gene: genetic and diagnostic implications. Am J Hum Genet. 2001;68:46–63. doi: 10.1086/316939. [DOI] [PMC free article] [PubMed] [Google Scholar]
- 29.Ong AC, Ward CJ, Butler RJ, et al. Coordinate expression of the autosomal dominant polycystic kidney disease proteins, polycystin-2 and polycystin-1, in normal and cystic tissue. Am J Pathol. 1999;154:1721–1729. doi: 10.1016/S0002-9440(10)65428-4. [DOI] [PMC free article] [PubMed] [Google Scholar]
- 30.Newby LJ, Streets AJ, Zhao Y, et al. Identification, characterization, and localization of a novel kidney polycystin-1-polycystin-2 complex. J Biol Chem. 2002;277:20763–20773. doi: 10.1074/jbc.M107788200. [DOI] [PubMed] [Google Scholar]
- 31.Streets AJ, Moon DJ, Kane ME, et al. Identification of an N-terminal glycogen synthase kinase 3 phosphorylation site which regulates the functional localization of polycystin-2 in vivo and in vitro. Hum Mol Genet. 2006;15:1465–1473. doi: 10.1093/hmg/ddl070. [DOI] [PMC free article] [PubMed] [Google Scholar]