

Abstract
Background
Influenza A has the ability to rapidly mutate and become resistant to the commonly prescribed influenza therapeutics, thereby complicating treatment decisions.
Objective
To design a cost-effective low-density microarray for use in detection of influenza resistance to the adamantanes.
Study Design
We have taken advantage of functional genomics and microarray technology to design a DNA microarray that can detect the two most common mutations in the M2 protein associated with adamantane resistance, V27A and S31N.
Results
In a blind study of 22 influenza isolates, the Antiviral Resistance-Chip (AVR-Chip) had a success rate of 95% for detecting these mutations. Microarray data from a larger set of samples were further analyzed using an artificial neural network and resulted in a correct identification rate of 94% for influenza virus samples that had V27A and S31N mutations.
Conclusions
The AVR-Chip provided a method for rapidly screening influenza viruses for adamantane sensitivity, and the general approach could be easily extended to detect resistance to other chemotherapeutics.
Introduction
Influenza virus is a significant human pathogen that results in a large number of deaths each year (Layne et al., 2001). Upon identification of the influenza virus, antivirals are often prescribed to limit the severity and duration of infection. However, the frequency of antiviral drug resistance has increased dramatically over the last 10 years, and prompted the need to identify drug susceptibility.
Amantadine, and its methylated derivative rimantadine, inhibit ion flow through the ion-channel (designated M2) of influenza, thereby preventing a productive infection. (Weinstock and Zuccotti, 2006). These drugs have been used extensively worldwide, but, unfortunately, adamantane resistance readily develops both in vivo and in vitro (Belshe et al., 1989). Resistance generally results from single point mutations in M2, although double mutations have been observed (Belshe et al., 1988, Cheung et al., 2006). Mutations result in single amino acid changes at residues 26, 27, 30, 31 or 34 of the M2 protein and do not appear to result in significant virus growth impairment (Bright et al., 2005, Bright et al., 2006, Hay et al., 1986, Saito et al., 2003, Suzuki et al., 2003, Sweet et al., 1991, Ziegler et al., 1999).
The ability to reproducibly and rapidly detect resistance to antivirals has been a major challenge (Hayden et al., 1980). ELISA of infected MDCK cells has historically been the standard for resistance determination of uncharacterized viruses (Belshe et al., 1988). More recently, identification of the most common mutable positions has allowed detection by genomic sequencing or by novel techniques that quickly assay a few nucleotide positions of the genome. A restriction fragment length polymorphism methodology was developed to determine resistance mutations in patient samples (Klimov et al., 1995, Saito et al., 2002). Pyrosequencing can also be used to detect mutations (Ahmadian et al., 2000), however, detecting resistance to multiple drugs or to detect mutations that do not cluster in one region of the genome would require multiple assays.
An oligonucleotide microarray is a highly attractive approach to genotyping due to the multiplexing capability and has been applied to other antiviral resistance problems (Pannucci et al., 2004). For example, microarrays to detect point mutations that give rise to drug resistant M. tuberculosis and S. aureus have been demonstrated (Couzinet et al., 2005, Troesch et al., 1999). Booth et al. developed a low-density microarray for detecting drug-resistant N. gonorrhoeae (Booth et al., 2003).
Here we report the development and characterization of a low-density DNA microarray to distinguish between adamantane resistant and sensitive influenza A viruses. The two most common mutations, V27A and S31N, were specifically targeted using a small set of capture and label sequences. A blind study demonstrated that the microarray could rapidly and accurately detect resistance and identify the mutation responsible.
Methods
A generalized schematic representing the two-step hybridization used is shown in Figure 1. Briefly, an amino modified “capture” sequence is immobilized on the microarray surface and binds the target RNA during hybridization. The RNA is labeled by hybridization to a secondary sequence with an attached fluorophore. The microarray is then washed, scanned and visualized.
Figure 1.
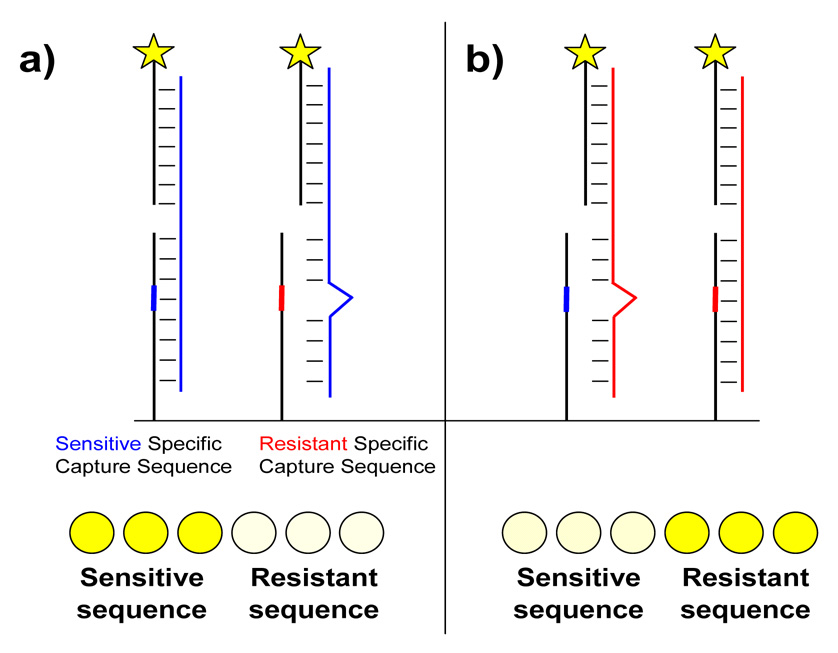
Schematic for two-step hybridization and detection of antiviral resistance on a microarray. a) Viral RNA from a sensitive virus (blue) hybridizes perfectly to the sensitive specific capture sequence but not to the resistant specific sequence. Captured RNA is detected by hybridization to a fluorophore-conjugated secondary sequence. The row of spots at the bottom represents a typical pattern observed when RNA from a sensitive virus hybridizes to triplicate spots of each capture sequence. Both capture sequences are identical except for the single position designed to probe resistance. b) The reverse scenario where RNA from a resistant virus (red) hybridizes to the same sequences.
Sequence Selection
Sequences were selected using a modification of the protocol described in (Mehlmann et al., 2006, Smagala et al., 2005). Two novel programs were written for use in the sequence selection process. The rm_dup program was written in Python and eliminated identical sequences from an aligned FASTA file. The program, rm_dup, removed duplicates by comparing both accession numbers and genome sequence data. Removal of duplicate genome data, while occasionally eliminating valid sequences, prevented artificial weighting of the database to clusters of genomes that were collected in one region over a short period of time. The gen_mismatch_report program compared chosen capture and label sequences with the genomes present in each subtree of the database. The average number of mismatches between each capture/label sequence was output and this value used to determine the best sequences that covered each database.
Modifications to the Sequence Selection Methodology
Due to the high variability of portions of the M2 gene, the capture and label sequences were chosen separately and allowed to be between 6–25 nt apart. Capture probes targeted the highly variable region covering the mutable positions and label sequences targeted the more conserved neighboring regions. An additional benefit of this approach was that only a few label sequences were necessary to cover the entire influenza database.
Microarray Sequence Selection
We used 1018 M gene segment sequences from the Los Alamos National Labs Influenza Sequence Database1 (Macken et al., 2001) and 1194 sequences of ‘influenza segment 7’ (M gene) from NCBI’s nucleotide database2 on 2/1/06. Sequence files with either identical accession numbers or identical nucleotide sequences were removed using rm_dup. The final database of 1086 influenza sequences was aligned using Clustal W (Thompson et al., 1994).
From this database, DNADIST was used to create a phylogenetic tree using only sequence data from nucleotide positions 754–849. Analysis, phylogenetic grouping and conserved region selection were performed as previously described (Mehlmann et al., 2006). A modified version of find_oligos was used to select single sequences (either capture or label) independently, without the restriction that they be 0 or 1 nt apart. Oligos were scored and picked using score_oligos and pick_oligos. All picked oligos were examined using gen_mismatch_report, to determine which sequences best covered the 1086 sequences in the database. Label sequences were chosen from the more conserved nucleotide regions 754–789 and 816–849. Capture sequences were selected that covered the five known mutable positions (Table 1) within the M2 gene and in which the mutable position was at least 6–8 nucleotides from either end of the oligo. A total of 111 sequences ranging from 16–25 nucleotides were “picked” by the automated pick_oligo program. From these sequences, 8 label sequences (4 from nt 754–789 and from nt 816–849) were selected, based on their coverage of the 1086 influenza sequences, and ordered with a conjugated Quasar-570 fluorophore (Biosearch Technologies, Novato, CA). A total of 9 capture sequences (5 targeting position 805 and 4 targeting position 793) were initially selected. For each capture sequence selected, two probes were synthesized (Operon, Huntsville, AL). The first was a perfect match with a sensitive virus (sensitive specific) and the second was a perfect match for a resistant virus (resistant specific). Selected sequences are available for non-profit organizations by request to CU Technology Transfer Office3.
Table 1.
Mutations associated with adamantane resistance.
| Amino acid position | Mutation | Nucleotide positiona | Nucleotide changea |
|---|---|---|---|
| 26 | Leu → Phe | 789 | C → U |
| " | 791 | A → U,C | |
| " | 791 | G → U,C | |
| 27 | Val → Ala | 793 | U → C |
| 30 | Ala → Thr | 801 | G → A |
| 31 | Ser → Asn | 805 | G → A |
| 34 | Gly → Glu | 814 | G → A |
Mutations are provided in terms of the change found in the coding strand (+ sense RNA or cDNA) of the virus.
Microarray Preparation
Capture and label sequences were spotted as described previously (Townsend et al., 2006). Capture sequences designed to probe for mutations at either nucleotide 805 or 793 were spotted in triplicate. Immobilized positive control (PC) sequences that bound directly to label sequences were used both to test chip spot quality and hybridization performance and provide orientation when viewing the array.
Samples and Sample Processing
The samples for the blind study contained purified vRNA from 7 H1N1 and 15 H3N2 influenza isolates obtained during the 2005–2006 season. Samples used for the NN study included H1N1 and H3N2 viruses isolated during 2003–2006.
Nucleic acid purification, amplification and microarray hybridization and analysis were performed as described previously (Townsend et al., 2006). Briefly, purified viral RNA was RT-PCR amplified with the M specific primers SZAM+ and T7-SZAM- (which incorporated a T7 promoter site in addition to the standard primer) (Zou, 1997). PCR products were used for run-off transcription of RNA. Reverse transcribed RNA was briefly fragmented to eliminate secondary structure and hybridized to the array for 2 hours at room temperature. Slides were scanned using a Bio-Rad Laboratores (Hercules, CA) VersArray scanner. Contrast optimized images were used for the blind study. The VersArray analyzer software was used for image quantitation.
Artificial Neural Network Sample Identification
EasyNN Plus Software4 (Version 7.0j) was used for analysis by an artificial neural net (ANN). The ANN program is a supervised pattern recognition algorithm that was used to identify input data from “unknowns” based on its training with “known” samples. The ANN was developed and used as described in (Dawson et al., 2006).
Results
Detection of Antiviral Resistance on a Microarray
Two capture probes were designed for each sequence chosen; one a perfect match for a sensitive virus and one a perfect match for a resistant virus. As outlined in Figure 1, it was anticipated that RNA from a sensitive virus would hybridize more efficiently to the “sensitive” capture probe and less efficiently to the “resistant” capture probe due to the mismatch with the resistant probe. Thus, by examining the signal from sensitive and resistant probes, a determination could be made as to the antiviral susceptibility of the virus.
Figure 2 shows the microarray layout (a, b) and contrast optimized images (c–f) used to query positions 793 and 805. Hybridization of H3N2 sensitive viruses produced a pattern where greater fluorescence intensity was present on most of the sensitive specific probes. By comparison, hybridization of H3N2 resistant viruses generally resulted in higher intensity hits on the resistant specific probes. Although all probes were not equally sensitive to the presence of a mismatch, the built in redundancy provided several options to detect resistance mutations. A simple visual examination could determine virus drug sensitivity. It is instructive to note that the probes were designed to provide identification for a range of influenza viruses. Thus, while some sequences appear non-discriminatory, they may work more appropriately for a different virus.
Figure 2.
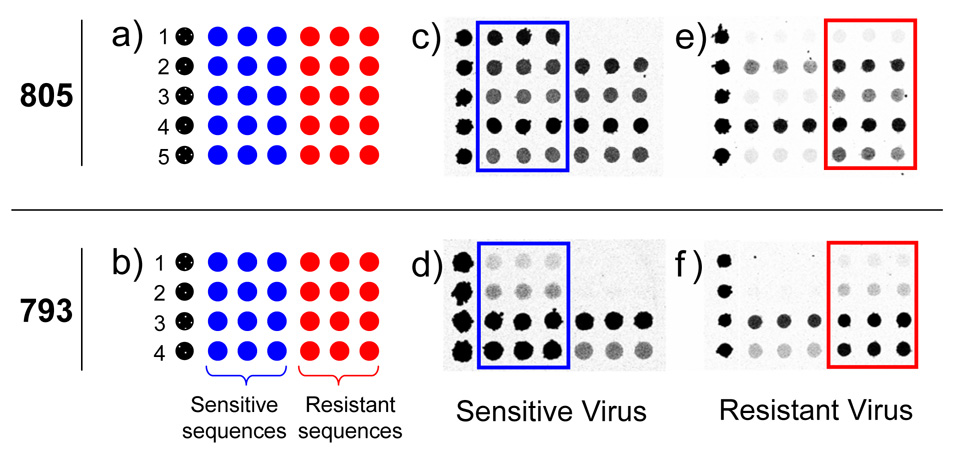
Microarray layout (a and b) and hybridization images (c–f) for probes designed to query positions 805 (S31N mutation) and 793 (V27A mutation). Each numbered row represents a specific probe sequence designed for either the 805 or 793 mutation. In (c–f) darker grey represents higher fluorescence intensity. The drug sensitive specific sequences are boxed in blue and the drug resistant sequences are boxed in red for ease of viewing. Images c and d were from drug sensitive A/H3N2 viruses. Images e and f were from drug resistant A/H3N2 viruses.
Blind Study Results
Using a set of 22 H3N2 and H1N1 influenza virus isolates, we performed a blind study to evaluate the ability of the AVR-Chip to identify drug-resistant and–sensitive viruses. Visual interpretation of the microarray images was based on evaluation of fluorescence intensity differences between the sensitive and resistant-specific capture/label set. These results are summarized in Table 2. Overall, 95% of the samples were correctly typed. The single incorrectly identified sample contained a V28I mutation in addition to the S31N mutation, which yielded a fluorescence image pattern sufficiently different than the expected patterns that the results for the virus were categorized as “inconclusive.” In contrast, samples 13–15 also contained additional mutations but were correctly identified.
Table 2.
Blind study results for microarray detection of drug resistance
| Sample | Subtype | Visual Assignment | Position | Correct? | Additional Mutations |
|---|---|---|---|---|---|
| 1 | H1N1 | Sensitive | - | ✓ | |
| 2 | H3N2 | Sensitive | - | ✓ | |
| 3 | H3N2 | Resistant | V27A | ✓ | |
| 4 | H3N2 | Resistant | S31N | ✓ | |
| 5 | H3N2 | Sensitive | - | ✓ | |
| 6 | H1N1 | Resistant | S31N | ✓ | |
| 7 | H1N1 | Sensitive | - | ✓ | |
| 8 | H1N1 | Resistant | S31N | ✓ | |
| 9 | H3N2 | Resistant | V27A | ✓ | |
| 10 | H3N2 | Resistant | S31N | ✓ | |
| 11 | H3N2 | Resistant | S31N | ✓ | |
| 12 | H3N2 | Resistant | S31N | ✓ | |
| 13 | H3N2 | Resistant | S31N | ✓ | A30T |
| 14 | H3N2 | Resistant | S31N | ✓ | V28A |
| 15 | H3N2 | Resistant | S31N | ✓ | P25L |
| 16 | H1N1 | Sensitive | - | ✓ | |
| 17 | H3N2 | Resistant | S31N | ✓ | |
| 18 | H3N2 | Sensitive | - | ✓ | |
| 19 | H3N2 | Sensitive | - | ✓ | |
| 20 | H3N2 | Sensitive | - | ✓ | |
| 21 | H1N1 | Resistant | S31N | ✗ | V28I |
| 22 | H1N1 | Resistant | S31N | ✓ |
ANN Identification of Antiviral Drug Sensitivity
To test the feasibility of automated analysis, data from all samples were quantified and used for drug sensitivity determination with an Artificial Neural Network (ANN). Negative control samples were included in both training and as unknowns. The output options provided for the ANN were Negative, Sensitive, and Resistant. The 94 images in this data set were divided into 10 groups. Each group was individually queried while the ANN was trained with the samples from the other 9 groups. As shown in Table 3, 94% of the samples were correctly identified, 4% were false negatives, and 2% were false positives. The AVR-Chip’s results correspond to a sensitivity [true positives / (true positives + false negatives)] of 95% and specificity [true negatives / (true negatives + false positives)] of 89%. These values compare well with previous diagnostic tests used to determine influenza drug sensitivity (St George et al., 2002). The full result set from the ANN output is available as a supplement (Table S1).
Table 3.
Summary of ANN - aided identification of drug resistance
| Sample Type | Number of Sample Images in Data Set | Number Correctly Identified | Number of False Negatives | Number of False Positives |
|---|---|---|---|---|
| Influenza Negative | 16 | 14 | 2 | |
| S-H1N1 | 16 | 15 | 1 | |
| R-H1N1 (V27A) | 2 | 2 | ||
| R-H1N1 (S31N) | 5 | 4 | 1 | |
| S-H3N2 | 28 | 28 | ||
| R-H3N2 (V27A) | 2 | 1 | 1 | |
| R-H3N2 (S31N) | 25 | 24 | 1 | |
| All Samples | 94 | 88 | 4 | 2 |
Of the samples that were incorrectly identified, two were false positives from negative control samples. Careful analysis of these two samples showed no significant fluorescence signal on any of the influenza specific sequences or other spurious signals and they would easily be identified as negative by visual analysis.
Discussion
The extensive impact of influenza, along with the cyclic global pandemics, has prompted efforts to improve the speed and comprehensiveness of influenza diagnostics. We previously demonstrated a microarray-based approach for rapidly typing and subtyping influenza (Mehlmann et al., 2006, Townsend et al., 2006). Here we have extended this work to detect antiviral resistance.
Being able to rapidly assess whether or not a patient is infected by a drug-resistant strain of influenza could enhance both the treatment of the patient and help limit the spread of resistance. Currently only a small number of patient samples are tested for resistance due to the time and expense involved, and these limited data are then used for widespread treatment recommendations. Increased surveillance would allow more timely changes in treatment recommendations, thereby helping limit the propagation of drug resistant virus.
The V27A and S31N mutations account for up to 97% of adamantane resistance (Bright et al., 2005, Bright et al., 2006, Hay et al., 1986, Saito et al., 2003, Suzuki et al., 2003, Sweet et al., 1991, Ziegler et al., 1999). By choosing appropriate capture and label sequences along with a simple array design, we found that we could visually identify viruses as sensitive or resistant with high accuracy. Additionally, we have shown that the data can be accurately analyzed using an ANN. Furthermore, we anticipate that as the size of the training set is increased, the accuracy of the ANN will improve.
One implicit assumption for these studies was that mismatches at nucleotides other than the queried position should reduce binding to both the sensitive and resistant specific probes. Since such mutations would result in an additional mismatch for binding to both the sensitive and resistant probe, the signal from both probes should be reduced similarly. Since three of the four samples containing additional mutations were correctly identified, this assumption appears generally correct.
To our knowledge, this is only the second application of a low density array for detection of antiviral resistance for influenza viruses (Booth et al., 2003). As compared with higher-density arrays, benefits of low-density arrays include ease of data management and lower cost while having the multiplexing ability of microarrays. The total cost for this assay, including slides and all reagents used during printing, amplification and hybridization, is less than $20. Although only 18 probes were utilized for this analysis, the current array production format would readily allow incorporation of additional sequences with minimal extra cost. These properties make low-density arrays attractive for routine diagnostic applications. In addition, although the current protocol utilized virus isolates, we have demonstrated that an analogous analysis of influenza type and subtype present in patient samples only requires ~7 hr (Dawson et al., 2006). Thus, microarray-based differentiation of drug-sensitive and drug-resistant virus from patient samples should also be ~7 hr.
A limitation to all sequence based technologies is that there must be a priori knowledge of the mutable position responsible for resistance. Adamantane resistance has been well characterized and provided a starting point for the development of the AVR-Chip. Although the current proof-of-principle array tests for resistance at the two current most important positions, future resistant viruses with mutations at other M2 positions could become prominent. Importantly, the established sequence selection methodology, as well as the ease with which the array could be modified, would allow easy update for detection of these new mutations. Furthermore, the technology developed herein could be extended to detect resistance mutations in other virus subtypes such as the H5N1 avian influenza viruses, and potentially to detect resistance to other antiviral drugs. For example, resistance to neuraminidase inhibitors has been observed (15,32). Although there is not yet a clear and predictable relationship between all mutations and functional neuraminidase resistance, commonly observed mutations that are known to be correlated with resistance could be queried in a microarray format to provide some degree of screening.
Conclusions
We developed a simple and inexpensive method to determine adamantane drug resistance in influenza viruses. The success rate for identifying resistance due to the mutations V27A and S31N exceeded 94%. This approach is amenable to combination with previously described microarrays (Dawson et al., 2006, Townsend et al., 2006) where virus type and subtype are determined, and could also be adapted to future arrays designed to provide further genetic analysis of influenza. Indeed, it should be possible to extend this approach to detect resistance to the other primary class of influenza drugs, the neuraminidase inhibitors, thereby providing a complete profile of what drugs will work with a given influenza infection.
Supplementary Material
Acknowledgements
We gratefully acknowledge funding form the National Institute of Allergy and Infection Diseases, NIH (grand U01 AI056528-03). We thank Dr. Martin Mehlmann, Dr. Daniela Dankbar, and Dr. Chad Moore for their contributions to the FluChip project.
Footnotes
Contact Address: Technology Transfer Office, 4740 Walnut Street, Suite 100, Boulder, CO 80309
Publisher's Disclaimer: This is a PDF file of an unedited manuscript that has been accepted for publication. As a service to our customers we are providing this early version of the manuscript. The manuscript will undergo copyediting, typesetting, and review of the resulting proof before it is published in its final citable form. Please note that during the production process errors may be discovered which could affect the content, and all legal disclaimers that apply to the journal pertain.
References
- Ahmadian A, Gharizadeh B, Gustafsson AC, Sterky F, Nyren P, Uhlen M, Lundeberg J. Single-nucleotide polymorphism analysis by pyrosequencing. Anal Biochem. 2000;280:103–110. doi: 10.1006/abio.2000.4493. [DOI] [PubMed] [Google Scholar]
- Belshe RB, Smith MH, Hall CB, Betts R, Hay AJ. Genetic basis of resistance to rimantadine emerging during treatment of influenza virus infection. J Virol. 1988;62:1508–1512. doi: 10.1128/jvi.62.5.1508-1512.1988. [DOI] [PMC free article] [PubMed] [Google Scholar]
- Belshe RB, Burk B, Newman F, Cerruti RL, Sim IS. Resistance of influenza A virus to amantadine and rimantadine: results of one decade of surveillance. J Infect Dis. 1989;159:430–435. doi: 10.1093/infdis/159.3.430. [DOI] [PubMed] [Google Scholar]
- Booth SA, Drebot MA, Martin IE, Ng LK. Design of oligonucleotide arrays to detect point mutations: molecular typing of antibiotic resistant strains of Neisseria gonorrhoeae and hantavirus infected deer mice. Mol Cell Probes. 2003;17:77–84. doi: 10.1016/s0890-8508(03)00005-7. [DOI] [PubMed] [Google Scholar]
- Bright RA, Medina MJ, Xu X, Perez-Oronoz G, Wallis TR, Davis XM, Povinelli L, Cox NJ, Klimov AI. Incidence of adamantane resistance among influenza A (H3N2) viruses isolated worldwide from 1994 to 2005: a cause for concern. Lancet. 2005;366:1175–1181. doi: 10.1016/S0140-6736(05)67338-2. [DOI] [PubMed] [Google Scholar]
- Bright RA, Shay DK, Shu B, Cox NJ, Klimov AI. Adamantane resistance among influenza A viruses isolated early during the 2005–2006 influenza season in the United States. Jama. 2006;295:891–894. doi: 10.1001/jama.295.8.joc60020. [DOI] [PubMed] [Google Scholar]
- Cheung CL, Rayner JM, Smith GJ, Wang P, Naipospos TS, Zhang J, Yuen KY, Webster RG, Peiris JS, Guan Y, Chen H. Distribution of amantadine-resistant H5N1 avian influenza variants in Asia. J Infect Dis. 2006;193:1626–1629. doi: 10.1086/504723. [DOI] [PubMed] [Google Scholar]
- Couzinet S, Yugueros J, Barras C, Visomblin N, Francois P, Lacroix B, Vernet G, Lew D, Troesch A, Schrenzel J, Jay C. Evaluation of a high-density oligonucleotide array for characterization of grlA, grlB, gyrA and gyrB mutations in fluoroquinolone resistant Staphylococcus aureus isolates. J Microbiol Methods. 2005;60:275–279. doi: 10.1016/j.mimet.2004.09.015. [DOI] [PubMed] [Google Scholar]
- Dawson ED, Moore CL, Smagala JA, Dankbar DM, Mehlmann M, Townsend MB, Smith CB, Cox NJ, Kuchta RD, Rowlen KL. MChip: a tool for influenza surveillance. Anal Chem. 2006;78:7610–7615. doi: 10.1021/ac061739f. [DOI] [PubMed] [Google Scholar]
- Hay AJ, Zambon MC, Wolstenholme AJ, Skehel JJ, Smith MH. Molecular basis of resistance of influenza A viruses to amantadine. J Antimicrob Chemother. 1986;18 Suppl B:19–29. doi: 10.1093/jac/18.supplement_b.19. [DOI] [PubMed] [Google Scholar]
- Hayden FG, Cote KM, Douglas RG., Jr Plaque inhibition assay for drug susceptibility testing of influenza viruses. Antimicrob Agents Chemother. 1980;17:865–870. doi: 10.1128/aac.17.5.865. [DOI] [PMC free article] [PubMed] [Google Scholar]
- Klimov AI, Rocha E, Hayden FG, Shult PA, Roumillat LF, Cox NJ. Prolonged shedding of amantadine-resistant influenzae A viruses by immunodeficient patients: detection by polymerase chain reaction-restriction analysis. J Infect Dis. 1995;172:1352–1355. doi: 10.1093/infdis/172.5.1352. [DOI] [PubMed] [Google Scholar]
- Layne SP, Beugelsdijk TJ, Patel CK, Taubenberger JK, Cox NJ, Gust ID, Hay AJ, Tashiro M, Lavanchy D. A global lab against influenza. Science. 2001;293:1729. doi: 10.1126/science.293.5536.1729. [DOI] [PubMed] [Google Scholar]
- Macken C, Lu H, Goodman J, Boykin L. The value of a database in surveillance and vaccine selection. Amsterdam: Elsevier Science; 2001. [Google Scholar]
- Mehlmann M, Dawson ED, Townsend MB, Smagala JA, Moore CL, Smith CB, Cox NJ, Kuchta RD, Rowlen KL. Robust Sequence Selection Method Used To Develop the FluChip Diagnostic Microarray for Influenza Virus. J Clin Microbiol. 2006;44:2857–2862. doi: 10.1128/JCM.00135-06. [DOI] [PMC free article] [PubMed] [Google Scholar]
- Pannucci J, Cai H, Pardington PE, Williams E, Okinaka RT, Kuske CR, Cary RB. Virulence signatures: microarray-based approaches to discovery and analysis. Biosensors & Bioelectronics. 2004;20:706–718. doi: 10.1016/j.bios.2004.04.005. [DOI] [PubMed] [Google Scholar]
- Saito R, Oshitani H, Masuda H, Suzuki H. Detection of amantadine-resistant influenza A virus strains in nursing homes by PCR-restriction fragment length polymorphism analysis with nasopharyngeal swabs. J Clin Microbiol. 2002;40:84–88. doi: 10.1128/JCM.40.1.84-88.2002. [DOI] [PMC free article] [PubMed] [Google Scholar]
- Saito R, Sakai T, Sato I, Sano Y, Oshitani H, Sato M, Suzuki H. Frequency of amantadine-resistant influenza A viruses during two seasons featuring cocirculation of H1N1 and H3N2. J Clin Microbiol. 2003;41:2164–2165. doi: 10.1128/JCM.41.5.2164-2165.2003. [DOI] [PMC free article] [PubMed] [Google Scholar]
- Smagala JA, Dawson ED, Mehlmann M, Townsend MB, Kuchta RD, Rowlen KL. ConFind: a robust tool for conserved sequence identification. Bioinformatics. 2005;21:4420–4422. doi: 10.1093/bioinformatics/bti719. [DOI] [PubMed] [Google Scholar]
- St George K, Patel NM, Hartwig RA, Scholl DR, Jollick JA, Jr, Kauffmann LM, Evans MR, Rinaldo CR., Jr Rapid and sensitive detection of respiratory virus infections for directed antiviral treatment using R-Mix cultures. J Clin Virol. 2002;24:107–115. doi: 10.1016/s1386-6532(01)00239-6. [DOI] [PubMed] [Google Scholar]
- Suzuki H, Saito R, Masuda H, Oshitani H, Sato M, Sato I. Emergence of amantadine-resistant influenza A viruses: epidemiological study. J Infect Chemother. 2003;9:195–200. doi: 10.1007/s10156-003-0262-6. [DOI] [PubMed] [Google Scholar]
- Sweet C, Hayden FG, Jakeman KJ, Grambas S, Hay AJ. Virulence of rimantadine-resistant human influenza A (H3N2) viruses in ferrets. J Infect Dis. 1991;164:969–972. doi: 10.1093/infdis/164.5.969. [DOI] [PubMed] [Google Scholar]
- Thompson JD, Higgins DG, Gibson TJ. CLUSTAL W: improving the sensitivity of progressive multiple sequence alignment through sequence weighting, position-specific gap penalties and weight matrix choice. Nucleic Acids Research. 1994;22:4673–4680. doi: 10.1093/nar/22.22.4673. [DOI] [PMC free article] [PubMed] [Google Scholar]
- Townsend MB, Dawson ED, Mehlmann M, Smagala JA, Dankbar DM, Moore CL, Smith CB, Cox NJ, Kuchta RD, Rowlen KL. Experimental Evaluation of the FluChip Diagnostic Microarray for Influenza Virus Surveillance. J Clin Microbiol. 2006;44:2863–2871. doi: 10.1128/JCM.00134-06. [DOI] [PMC free article] [PubMed] [Google Scholar]
- Troesch A, Nguyen H, Miyada CG, Desvarenne S, Gingeras TR, Kaplan PM, Cros P, Mabilat C. Mycobacterium species identification and rifampin resistance testing with high-density DNA probe arrays. J Clin Microbiol. 1999;37:49–55. doi: 10.1128/jcm.37.1.49-55.1999. [DOI] [PMC free article] [PubMed] [Google Scholar]
- Weinstock DM, Zuccotti G. Adamantane resistance in influenza A. Jama. 2006;295:934–936. doi: 10.1001/jama.295.8.934. [DOI] [PubMed] [Google Scholar]
- Ziegler T, Hemphill ML, Ziegler ML, Perez-Oronoz G, Klimov AI, Hampson AW, Regnery HL, Cox NJ. Low incidence of rimantadine resistance in field isolates of influenza A viruses. J Infect Dis. 1999;180:935–939. doi: 10.1086/314994. [DOI] [PubMed] [Google Scholar]
- Zou S. A practical approach to genetic screening for influenza virus variants. J Clin Microbiol. 1997;35:2623–2627. doi: 10.1128/jcm.35.10.2623-2627.1997. [DOI] [PMC free article] [PubMed] [Google Scholar]
Associated Data
This section collects any data citations, data availability statements, or supplementary materials included in this article.