

Abstract
The role of GABA in the central processing of complex auditory signals is not fully understood. We have studied the involvement of GABAA-mediated inhibition in the processing of birdsong, a learned vocal communication signal requiring intact hearing for its development and maintenance. We focused on caudomedial nidopallium (NCM), an area analogous to parts of the mammalian auditory cortex with selective responses to birdsong. We present evidence that GABAA-mediated inhibition plays a pronounced role in NCM's auditory processing of birdsong. Using immunocytochemistry, we show that approximately half of NCM's neurons are GABAergic. Whole cell patch-clamp recordings in a slice preparation demonstrate that, at rest, spontaneously active GABAergic synapses inhibit excitatory inputs onto NCM neurons via GABAA receptors. Multi-electrode electrophysiological recordings in awake birds show that local blockade of GABAA-mediated inhibition in NCM markedly affects the temporal pattern of song-evoked responses in NCM without modifications in frequency tuning. Surprisingly, this blockade increases the phasic and largely suppresses the tonic response component, reflecting dynamic relationships of inhibitory networks that could include disinhibition. Thus processing of learned natural communication sounds in songbirds, and possibly other vocal learners, may depend on complex interactions of inhibitory networks.
INTRODUCTION
Songbirds can modify their vocalizations based on auditory input, and have been used extensively as a model for vocal learning, which is necessary for the acquisition of spoken language (Doupe and Kuhl 1999; Konishi 1965b; Zeigler and Marler 2004). Like humans, songbirds rely on audition to generate auditory memories that are used as templates for the normal development of vocal behavior (Konishi 1965a; for reviews see Doupe and Kuhl 1999; Koppl et al. 2000; Nottebohm 1999; Zeigler and Marler 2004). In addition, song discrimination and the formation of auditory memories in adult animals is central for key behaviors, such as territorial defense, mate selection and individual recognition (Catchpole and Slater 1995; Kroodsma and Miller 1982; Nowicki and Searcy 2004). Thus a great deal of effort has been directed at understanding the anatomical and functional organization of brain areas involved in the auditory processing of birdsong. A particular focus has been the caudomedial nidopallium (NCM), an area considered analogous to the supragranular layers of the mammalian auditory cortex because it receives input from the primary telencephalic thalamo-recipient area field L and participates in intra-telencephalic circuitry that precedes the descending auditory projections from the arcopallium (Karten and Shimizu 1989; Mello et al. 1998; Vates et al. 1996; Wild et al. 1993). It is currently unknown whether NCM and other avian auditory areas have correspondence to portions of the primary versus higher-order auditory cortical areas of mammals. NCM displays strong electrophysiological responses to song stimulation, with greater selectivity for complex stimuli, compared with responses at earlier stations in the ascending auditory pathway, such as the thalamo-recipient field L2 (Chew et al. 1995, 1996; Muller and Leppelsack 1985; Sen et al. 2001; Terleph et al. 2006, 2007). NCM's responses also show a preference for conspecific over heterospecific songs or artificial stimuli (Chew et al. 1996; Mello et al. 1992), suggesting that this area contributes to auditory discrimination of birdsong. Importantly, evidence from electrophysiological and gene expression studies suggest that NCM plays a role in the formation and/or storage of song auditory memories learned from tutors (Bolhuis et al. 2000; Phan et al. 2006; Terpstra et al. 2004). Furthermore, lesions to NCM can disrupt important aspects of the perceptual discrimination of birdsong (Gobes and Bolhuis 2007).
Here we explore the contribution of GABAergic inhibition to shaping auditory responses in NCM. GABAergic transmission, especially that mediated through GABAA receptors, plays a pivotal role in shaping receptive field (RF) properties in several sensory systems and experimental models. For example, GABAA receptor antagonism expands RFs in primary somatosensory (S1) and visual (V1) cortices (Dykes et al. 1984; Eysel et al. 1998; Ramoa et al. 1988; Tremere et al. 2001). In addition, direction and orientation selectivity in V1 neurons are controlled by GABAergic transmission (Sillito 1975a, 1977, 1979), indicating that inhibition contributes to the generation of complex response properties of sensory neurons. GABAA-mediated transmission also regulates the responses of neurons in auditory circuits. For instance, GABAA receptor blockade expands frequency tuning curves of central auditory neurons of mammals, including cortical ones (Chen and Jen 2000; Jen and Feng 1999; Suga et al. 1997; Yang et al. 1992), and plays a critical role in experience-dependent plasticity of auditory spatial maps in the avian (barn owl) brain (Zheng and Knudsen 1999, 2001).
Using a multi-disciplinary approach, we report here a marked role for GABA-mediated inhibition in the physiology of songbird NCM. First, using immunocytochemistry specific to the neurotransmitter GABA, we show that GABAergic cells comprise at least half of all neurons in NCM. Second, patch-clamp electrophysiological recordings in brain slices show that, under resting conditions, a high density of spontaneously active GABAergic synapses suppresses the excitatory synaptic inputs onto NCM neurons. Finally, coupling multi-electrode recordings in NCM of the awake songbird with pharmacological interventions, we show that GABAA receptor blockade markedly alters the temporal organization of auditory responses without changes in frequency tuning. Taken together, our findings show that complex and unconventional interactions of inhibitory networks play a key role in the auditory processing of natural communication signals in the songbird auditory forebrain. We suggest that these interactions may be important for the processing of complex learned vocalizations as in the case of birdsong and human speech.
METHODS
Immunocytochemistry (ICC) and specificity controls
A total of 16 zebra finches (Taeniopygia guttata; n = 8 males and 8 females) were anesthetized and perfused transcardially with 20 ml of phosphate-buffered saline (PBS 0.1 M, pH = 7.2–7.4) followed by 60 ml of an ice-cold mix of 1% paraformaldehyde and 2% glutaraldehyde in PBS. Brains were dissected out, cryoprotected overnight in 30% sucrose, and dried. The hemispheres were separated at the midsagittal plane, included in embedding medium (Tissue-Tek, Sakura Finetek, Torrance, CA), frozen in a dry-ice/isopropanol bath, sectioned at 20 μm on a cryostat, and thaw-mounted onto Fisherbrand Superfrost Plus glass slides.
We used a commercial rabbit anti-GABA antibody to detect GABAergic cells in our preparations, using a protocol previously described (Pinaud et al. 2006). Briefly, sections were hydrated for 30 min in PBS and sequentially incubated in a humid chamber in the following solutions: 1) blocking buffer (BB; 0.5% albumin and 0.3% Triton X-100 in 0.1 M PB) for 30 min at room temperature (RT); 2) primary antibody (1:200 dil in BB; Chemicon International, Temecula, CA), overnight at 4°C; 3) biotinylated goat anti-rabbit IgG antibody (1:200 dil in BB; Vector Laboratories, Burlingame, CA), for 2 h at RT; and 4) ABC reagent (1:100 dil in PBS; Vector Laboratories). Sections were developed by incubation in a filtered solution containing 0.03% diaminobenzidine, 0.15% nickel sulfate, and 0.001% hydrogen peroxide in PBS. All steps in the preceding text were separated by 3 × 10-min washes in PBS.
Omission of the primary antibody resulted in absence of cellular staining, demonstrating the specificity of our ICC detection system (secondary antibody plus ABC reagent). To determine the specificity of the anti-GABA antibody, we preabsorbed it with GABA conjugated to a carrier protein, analogous to the immunizing conjugate used to generate this antibody. We first generated a GABA-BSA conjugate as described previously (Walrond et al. 1993) with modifications. Specifically, we cross-linked GABA (5 mM; Sigma) with BSA (5 mg/ml) using glutaraldehyde (at 1% in 0.1M PB) for 1 h at RT, under stirring. This solution was then dialyzed against 30 volumes of cold 0.01 M PB (10 volume/day for 3 day, at 4°C). To preabsorb the anti-GABA antibody with the conjugate, we incubated the antibody at its working dilution with various concentrations of the postdialysis conjugate overnight at 4°C under agitation. The preabsorbed antibody was then used in the ICC procedure. We found that preabsorption with the GABA-BSA conjugate in the 10- to 50-μM range completely abolished GABA-like immunoreactivity in brain sections (Supplementary Fig. S1B).1 Further preabsorption controls using unbound BSA at the same concentrations as for the GABA-BSA conjugate did not alter GABA-like immunoreactivity in our preparations (Supplementary Fig. S1A). These procedures are in accordance with strict established guidelines for determining antibody specificity (Saper and Sawchenko 2003).
Cell measurements and counts
We used previously described methods to estimate maximum cell diameter and area and to quantify densities of neurons in NCM, using Neurolucida software integrated with a Nikon E-600 microscope equipped with a motorized stage drive (LEP Mac5000) and coupled to a PC through a Lucivid system (Microbrightfield; Colchester, VT) (Pinaud et al. 2006). Briefly, to obtain cell diameter and area, we reconstructed the perimeters of 200 neurons, in three randomly placed NCM fields that encompassed the dorsal-to-ventral extent of this area, at three predefined stereotaxic levels (0.1, 0.5 and 0.9 mm from the midline, to provide a broad coverage of the medial-to-lateral extent of NCM). Given that no intra-animal differences were detected for cell sizes in dorsal versus ventral and medial versus lateral NCM comparisons (not shown), all data for soma diameter and area were combined for each animal. Cell diameter and area calculations were done using NeuroExplorer (Pinaud et al. 2006).
To generate estimates of local densities of GABAergic cells, a grid containing squares of 100 × 100 μm was superimposed on sections reacted for GABA ICC at the same planes detailed in the preceding text. A minimum of 15 such squares per stereotaxic level, per bird, evenly spaced through rostral and caudal NCM were used for counting labeled cells. To estimate neuronal cell density, we counted the number of neurons per unit area in Nissl-stained adjacent sections of the same animals using the same sampling as in the preceding text for GABA. The inclusion criteria for neurons were a large pale nucleus, usually with clear staining nucleolus, and prominent Nissl substance, whereas the exclusion criteria consisted of small cells with dark, homogeneously stained nuclei and scant cytoplasm. Because no regional differences were detected in NCM in relation to the overall neuronal and GABAergic cell populations or between sexes (not shown), results were averaged for each of the three planes examined and across birds (including n = 5 males and 5 females).
Whole cell patch-clamp electrophysiology
Twenty-three adult zebra finches (20 females and 3 males) were used in the in vitro experiments. All the quantitative data were obtained in females for consistency. Males were used only on a few occasions for qualitative comparisons. Birds were bought from local dealers and kept in aviaries at the animal facilities at the NSI or at the University of São Paulo in Ribeirão Preto. Birds were decapitated, and the brains were quickly dissected and placed in ice-cold artificial cerebrospinal fluid solution (ACSF) modified for slicing and consisting of (in mM): 87 NaCl, 25 NaHCO3, 2.5 KCl, 1.25 NaH2PO4, 0.5 CaCl2, 7 MgCl2, 25 glucose, 75 sucrose, 0.4 ascorbic acid, 2 sodium piruvate, and 3 myo-inositol, 354 mosM/kgH2O, pH 7.4 when bubbled with carbogen 95%O2-%CO2. Parasagittal sections (200 μm thick; 4–5 sections starting at the midline) covering the medial–to-lateral extent of NCM and adjacent areas were obtained on a vibratome (Series 1000, Vibratome, St Louis, MO). Slices could be stored in this solution at RT for 4–6 h. These slices contained NCM as well as the adjacent auditory regions field L2 and the caudomedial mesopallium (CMM). Although these regions are thought to provide input to NCM, we note that it is currently unknown whether the projection fibers from these input sources are preserved in our slice preparations. For recordings, slices were transferred to a chamber mounted on a stage of an upright microscope (Olympus BX51WI) and continuously perfused with regular ACSF, which consisted of (in mM) 125 NaCl, 2.5 KCl, 25 NaHCO3, 1.25 NaH2PO4, 25 glucose, 2 CaCl2, 1 MgCl2, 0.4 ascorbic acid, 2 sodium pyruvate, and 3 myo-inositol, 310 mosM/kgH2O, pH 7.4 when bubbled with 95%CO2-5%O2. Single neurons were visualized with DIC-IR optics, approached and patched with borosilicate glass pipettes (Sutter Instruments, Novato, CA) prepared using a P-97 horizontal puller (Sutter Instruments). Spontaneous postsynaptic currents (sPSCs) were recorded at –70 mV in whole cell voltage-clamp with an EPC-10 patch-clamp amplifier (HEKA Eletronics, Germany) using the Pulse acquisition software. For recording, the pipettes were back-filled with filtered internal solution consisting of (in mM) 140 CsCl, 5 EGTA, 10 HEPES, 4 ATP-Mg, and 20 phosphocreatine-Na, pH 7.3 with CsOH. A low-chloride internal solution, where CsCl was replaced by Cs-methanesulphonate (130 mM) and KCl (10 mM), was used in experiments intended to isolate GABAergic and glutamatergic transmission based on the sPSC reversal potential. In these experiments, cells were held at –20 mV, a membrane potential between the reversal potential of GABAergic Cl− currents (–56 mV, after correction of a liquid junction potential of 11 mV) and of cationic glutamatergic currents (0 mV), resulting in outward Cl− currents and inward cationic currents. Reversal potentials and liquid junction potentials were calculated using the Patcher's Power Tools of the IGOR Pro software (Wavemetrics, Lake Oswego, OR). For measuring membrane potential changes, we used a potassium gluconate-based internal solution (CsCl replaced by 130 mM Kgluc/20 mM KCl), and neurons were kept at their resting membrane potential (approximately −60 mV); membrane potential changes were measured in the current-clamp mode. Resistance of the pipettes in the bath was in the 4- to 10-MΩ range, and compensated series resistance was <20 MΩ. Bicuculline (BIC) and dinitroquinoxaline-2,3(1H,4H)-dione (DNQX) were from SIGMA (St. Louis, MO) and 1,000× stock solutions of these drugs were prepared in DMSO; the final DMSO concentration in the bath was 0.1%. This concentration did not affect the sPSCs (data not shown). Tetrodotoxin citrate (TTX) stock solutions were prepared in deionized water (1 mM; Tocris). The sPSCs were analyzed using the mini analysis software Synaptosoft (Decatur GA). This software reliably detects events based on threshold, time to peak, decay time, and area. However, to avoid false positives, we manually checked events using a fast rise-time followed by an exponential-like decay time, and an amplitude clearly distinguishable from baseline noise (roughly twice the noise), as criteria. The control mean amplitudes and frequencies passed a Kolmogorov-Smirnoff normality test, and they were considered normal (P > 0.05) and, in accordance, data were analyzed with parametric statistics, as appropriate. The criterion for statistical significance was set at P < 0.05.
Extracellular recordings in awake restrained animals
We used 10 adult female zebra finches for the in vivo experiments. We focused this component of our study in females to avoid a potential confound although there have been no reported differences in NCM physiology between the sexes. Animals were raised in an aviary at Rutgers University. To prepare for electrophysiological recording, birds were anesthetized (Nembutal 50 mg/kg im, Abbot Laboratories, N. Chicago, IL) and placed in a stereotaxic device. The outer layer of skull was opened over the target area, and dental cement (Dentsply Caulk, Milford, DE) was used to form a chamber for chronic recording and to attach a metal head post to the skull.
After a 48-h recovery period, the birds were placed in an acoustically isolated booth for testing. The head post and a plastic body tube permitted restraint of awake animals during recording and microinjections. The chamber was opened and a landmark on the brain surface (bifurcation of the sagittal sinus) was used to position seven 2- to 4-MOhm microelectrodes (Quartz-Platinum/Tungsten Type ESI2ec, Thomas Recording, Giessen, Germany) and a glass micropipette (Drummond Scientific, Broomall, PA) above NCM. Three electrodes were then driven into the left hemisphere (control side) and four into the right (experimental side) by a calibrated electrode microdrive (Thomas Recording), and white noise was used to locate responsive sites. Microelectrode signals were amplified and filtered (low-pass: 5 kHz, high-pass: 500 Hz) and digitized (Cambridge Electronic Design Power 1401 with Spike 2 software) together with the acoustic stimulus.
After playing pre-BIC auditory stimulus sets (described in the following text) a glass micropipette (tip: ∼30 μm ID) was driven into the right hemisphere to approximately the same depth as the electrodes, and BIC (0.2 mM, Sigma) was administered with a microinjector (Narishige Scientific Instrument Labs, Tokyo, Japan). We intentionally used very low BIC concentrations so as to avoid the impact of seizure-like activity in our recordings. Doses were adjusted for each bird so that neural firing remained just below threshold for seizure-like activity, as assessed by spontaneous neural activity in real-time. Subjects received an initial loading dose (6–10 nl), followed 5–15 min later by maintenance doses (1–2 nl every 1–4 min) for the duration of the auditory stimulus trials.
Stimuli
Stimuli included four conspecific song segments played in a pseudorandom order through a small speaker at an amplitude of 70 dB SPL, under computer control (Spike2 version 5.05, Cambridge Electronic Design, Cambridge, UK). Each song segment was played 25 times before infusion of BIC or PTX injection and then repeated 25 times during drug treatment (stimulus durations: 1.18, 1.10, 1.48, and 1.12 s, inter-stimulus interval of 8 s). A set of 20 tone burst stimuli (duration: 260 ms, range: 250–5,000 Hz in 250-Hz increments, interstimulus interval of 6 s; 5 repeats of each stimulus in pseudorandom order) was also played for frequency tuning analysis before and during drug infusion.
Analysis of auditory responses
Multiunit responses (typically 5–10 units) were recorded at each site to enable valid comparisons between conditions (before vs. during drug administration) because these responses are stable over a period of 1–2 h. Single units cannot always be held for the necessary time period in the awake preparation. These multiunit neural responses to song stimuli were quantified as the difference between the root-mean-square (RMS) value obtained for each electrode during a response window (from stimulus onset to stimulus offset plus 100 ms) and the RMS during the control period of each trial (a 500-ms window occurring prior to stimulus onset). To compute the RMS, each digitized value is squared, the mean of these squares over the response interval is computed, and the square root of that mean is taken. This provides a method of rectifying the multiunit activity and computing its average power. In addition, the RMS procedure was used to rectify neural activity for averaging across trials as displayed in Fig. 5.
FIG. 5.

Blockade of GABAA receptors alters temporal dynamics and pattern of song-evoked responses in NCM. A: 2 representative songs used as auditory stimuli for awake animals. Top: spectrograms (frequency × time) of the 2 songs; bottom: the averaged root-mean-square (RMS) value over 10-ms windows associated with each song. B: averaged responses (n = 25 sweeps for the same song) to the 2 conspecific songs shown in A at 4 sites (2 left—control, 2 right—BIC) in NCM before (blue) and after (red) local BIC injection. On the control side (top 4 graphs), the response pattern is similar before and after BIC. Small changes likely reflect variability and habituation to stimulus presentation. On the BIC side (bottom 4 graphs), responses become dramatically more phasic with a significant disappearance of sustained responses throughout the stimulus. Note that peaks of activity (small horizontal arrows in bottom graphs) are higher while “valleys” (small vertical arrows in bottom graphs) are lower under BIC compared with control, suggesting that the reorganization of spiking patterns may involve the recruitment of units from the tonic component of the response to the phasic window. Also note that certain song syllables no longer correlate with spiking activity under BIC (e.g., shaded boxes).
In an additional analysis, the RMS was calculated over 1-ms windows to provide a measure of the local burstiness or temporal variance of the responses over short time intervals. To measure this temporal variance, the SD of these values (the RMS of each 1 ms window) was calculated over time during the response period for each song, both pre and during drug application at each recording site. Then the ratio of the SD (during/pre) was computed for each song, and these ratios were averaged across sites in each hemisphere.
Mult-unit responses to tone stimuli were also analyzed using the RMS method described in the preceding text. Phasic responses were quantified during a 50-ms window at stimulus onset, and tonic responses were quantified during a 70-ms window immediately following (for details, see Terleph et al. 2006). Tuning curves were obtained averaging the five responses at each stimulus frequency of the tuning set and plotting the resulting average amplitude.
The effect of drug treatment with BIC and PTX on the pattern of auditory responses to song stimuli was quantified as follows. The sliding cross-correlogram was computed between the RMS of each test song and the averaged RMS of the multiunit activity during the response to that song (from stimulus onset to stimulus offset plus 100 ms) at each recording site before and during drug treatment. The maximum r2 of the correlogram function (within a window corresponding to a 10- to 30-ms response latency) during drug treatment was divided by the maximum r2 before drug treatment at each site to compute a song envelope correlation index (SECI). If there was no effect of treatment, this index would be ∼1.0, indicating no change in the average correlation. If treatment reduced the correlation, the SECI would be <1.0.
Auditory response data were analyzed with parametric statistics, as appropriate. When normality assumptions were violated, nonparametric tests were applied. The criterion for statistical significance was set at P < 0.05. Factorial ANOVAs included recordings from the same electrode site before versus during drug treatment as a repeated measure. ANOVAs used data from each recording site as a sample. However, to avoid pseudoreplication effects, the degrees of freedom used when computing the probability for each F value were reduced to the number of animals and/or stimuli as appropriate.
Histological confirmation of recording sites
To confirm recording locations, electrolytic lesions (10 μA of current for 10 s, 3 lesions per hemisphere) were made at several recording sites in each brain. Animals were killed by sodium pentobarbital (Nembutal) overdose and perfused transcardially with saline followed by a 4% paraformaldehyde solution. Fixed brains were removed and cut on a vibratome parasagittally (50-μm sections), and processed for Cresyl-violet staining following standard protocols (Pinaud et al. 2006).
All animal handling and experimentation procedures described in the preceding text were approved by the IACUC committees of OHSU, Rutgers University, and University of São Paulo, and are in accordance with National Institutes of Health guidelines.
RESULTS
GABAergic neurons are highly prevalent in NCM
We have previously cloned the zebra finch homologue of the 65-kDa glutamic acid decarboxylase gene (zGAD65), a specific GABAergic cell marker, and shown by in situ hybridization that zGAD65-positive cells account for ∼40% of the overall neuronal population in NCM (Pinaud et al. 2004). However, the representation of GABAergic neurons may have been underestimated, given that cells expressing zGAD67 (the other synthetic enzyme for GABA) were not detected with our probe. We have now conducted an immunocytochemical (ICC) analysis with a specific anti-GABA antibody that labels GABAergic cells irrespective of their synthetic enzyme. Our procedure reliably identified known populations of GABAergic neurons in several brain areas (Supplementary Fig. S2). In NCM, we found a particularly high density of evenly distributed GABAergic neurons (Fig. 1, A and B) with relatively few clusters of two to four neurons (Fig. 1B, ▴) that occurred in a wide range of sizes. These cells had an overall normal distribution of sizes (mean diameter = 16.1 μm and median diameter = 15.5 μm). Interestingly, the mode of the distribution was 9.8 μm, indicating a higher frequency of small-sized cells (as can be seen in Fig. 1C, ▴). We also observed the occurrence of larger cells (>20 μm diam), suggesting the possible presence of a second population of cells. We note, however, that these were much less frequent than the smaller ones, so that the general cell size distribution was not bimodal and had no obviously abnormal right tail. Nonetheless, our qualitative observations are consistent with our previous findings using zGAD65-specific riboprobes (Pinaud et al. 2004).
FIG. 1.

GABAergic cells are the prevalent neuronal cell type in caudomedial nidopallium (NCM). A–C: photomicrographs depicting GABA-positive cells in NCM. B: high-power view depicting heterogeneity of size and shapes of GABA-labeled cells in NCM, and cluster of GABAergic cells (▴). C: high-power photomicrographs depicting large (↓) and small (▴) GABAergic cells in NCM. D: comparison of cell diameter (left) and cell area (right) reveals that GABA-positive neurons in NCM are, on average, significantly smaller than the overall population of neurons in this auditory area. Scale bars (in μm): 50 (A); 25 (B); 50 (C).
Quantitative analysis revealed that GABAergic neurons account for 51.9 ± 1.4% (mean ± SE) of the overall neuronal population. A reconstruction of 200 GABA-positive neurons (n = 4 birds) revealed an average cell diameter of 9.2 ± 0.6 μm (range: 3.3–20.8 μm), which was significantly smaller than the average diameter of the general neuronal population in NCM (11.8 ± 0.3 μm; P = 0.0016; Student's t-test; Fig. 1D). The area of GABAergic cell somata averaged 34.6 ± 0.9 μm2 and was also significantly different from the average soma area of the overall neuronal population in NCM (38.1 ± 1.0 μm2; P = 0.00046; Student's t-test; Fig. 1D). GABAergic cell density in NCM proved to be substantially higher than other auditory stations such as the brain stem nucleus angularis (19.3 ± 1.5% of the overall neuronal population), the HVC shelf (29.7 ± 0.6%), field L2 (44.9 ± 2.0) and structures of the song-control system, such as the lateral magnocellular nucleus of the anterior nidopallium (LMAN; 29.2 ± 0.3%). CMM exhibited a similarly high density of GABAergic neurons (51.8 ± 1.4 of the overall neuronal population) as compared with NCM.
The data described in the preceding text shows that the GABAergic neuronal population in NCM is primarily composed of small neurons, which are typically encountered in local neuronal circuits. More importantly, GABAergic neurons are the prevalent cell type in NCM, suggesting that inhibitory transmission may play a key role in the physiology of this auditory area.
Spontaneous GABA release suppresses the activity of excitatory circuitry in NCM slices
To characterize the potential roles for GABAergic and glutamatergic inputs to NCM neurons at rest, we conducted whole cell patch-clamp recordings in slices containing the NCM and the adjacent projection areas field L and CMM. We found that all recorded neurons in NCM receive strong synaptic input, as revealed by a high frequency of spontaneous postsynaptic currents (sPSCs; Fig. 2, A–C). These sPSCs exhibited a frequency of 3.1 ± 0.3 (SE) Hz (n = 31 neurons from 21 birds) and amplitude and half-width of −48 ± 3.2 pA and 9.9 ± 0.7 ms, respectively.
FIG. 2.

Spontaneous inhibitory postsynaptic currents (IPSCs) in NCM are GABAergic and suppress the activity of instrinsic excitatory network. A: spontaneous synaptic currents recorded in an NCM neuron before (left) and after (right) application of bicuculline (BIC, 20 μM) to the recording bath. Note the different time and amplitude scales in both panels. B: cumulative frequency histograms of the interevent intervals (left) and sPSC amplitudes (right) from the same cell shown in A. The number of events analyzed is shown in parenthesis. C: effect of BIC on the frequency and amplitude of the synaptic events (n = 23; *, significantly different from control; P < 0.01, paired t-test). D: bursts of glutamatergic activity were elicited in some cells after perfusion of BIC. The lower trace is an expanded view of an individual burst. E: action potentials were elicited by BIC-induced bursts of glutamatergic activity.
To assess the fraction of fast neurotransmission contributed by excitatory or inhibitory mechanisms, we used BIC, a competitive GABAA receptor antagonist, and DNQX, an alpha-amino-3-hydroxy-5methyl-4-isoxazole propionic adic (AMPA)/kainate receptor antagonist. Application of BIC to the recording bath significantly decreased the frequency of sPSCs from 2.7 ± 0.3 to 0.4 ± 0.1 Hz (n = 23; P < 0.0001, paired t-test; Fig. 2, A–C), resulting in an average 87 ± 3% suppression. The remaining, BIC-resistant, events had significantly smaller amplitude (P = 0.0005; paired t-test; Fig. 2, A–C) and were completely blocked by co-application of DNQX to the recording bath (Supplementary Fig. S3), indicating that these were excitatory. Thus the vast majority of spontaneous synaptic currents recorded in the brain slices containing NCM are GABAergic.
It is noteworthy that a distinct form of synaptic activity was elicited by BIC in a significant fraction of cells (9 of 28–32%). This consisted of regular bursts of synaptic currents (Fig. 2D, top trace). Compared with spontaneous inhibitory postsynaptic currents (sIPSCs) or mean spontaneous excitatory postsynaptic currents (sEPSCs), these bursts were notably larger (mean amplitude of 232.5 ± 37.6 pA) but occurred at a much lower frequency (0.08 ± 0.01 Hz; n = 9) and in a seemingly rhythmic pattern (Fig. 2D). These events are suprathreshold as they were able to elicit a train of action potentials, as seen in current-clamp mode (Fig. 2E). Application of DNQX (10 μM) to the recording bath eliminated these events, confirming that they originate from glutamatergic synapses normally inhibited by the spontaneous GABAergic tone. Although we cannot determine if the recorded neurons are glutamatergic or GABAergic, it is reasonable to conclude that under resting conditions, GABAergic sIPSCs suppress components of the excitatory network that drives NCM neurons in our slice preparation and that only becomes active when the basal GABAergic tone is inhibited.
We next applied DNQX (without BIC) to the bath, to investigate the contribution of AMPA/kainate receptors to the sPSCs. DNQX failed to trigger significant changes in sPSCs frequency (control: 4.0 ± 0.7 Hz; DNQX: 3.4 ± 0.6 Hz; n = 9; P = 0.411; paired t-test) or amplitude (control: 51.5 ± 6 pA; DNQX: 41.5 ± 3.6 pA; n = 9; P = 0.08; paired t-test; Fig. 3, A–C). In fact, in only three of nine cells DNQX had a detectable effect on sPSCs frequency. Subsequent application of BIC inhibited all the remaining events (not shown). By comparing the GABAergic sIPSCs (DNQX-resistant events) with the glutamatergic sEPSCs (BIC-resistant events), it is clear that spontaneous GABAergic activity is substantially stronger and more frequent than spontaneous glutamatergic activity (mean peak conductances of 592 vs. 270 pS, and 3.4 vs. 0.4 Hz for sIPSCs and sEPSCs, respectively).
FIG. 3.

Frequency and amplitude of sIPSCs are Independent of glutamatergic input. A: spontaneous synaptic currents recorded in an NCM neuron before (left) and after (right) application of 20 μM of dinitroquinoxaline-2,3(1H,4H)-dione (DNQX). B: cumulative frequency histograms of the inter-event intervals (left) and sPSC amplitudes (right) from the same cell shown in A. The number of analyzed events is shown in parenthesis. C: effects of DNQX on the frequency and amplitude of the synaptic events. D: recordings made at –20 mV using a low-chloride internal solution. The outward currents are GABAergic and blocked by BIC, while the inward currents are glutamatergic and blocked by DNQX. E: summary of the effects of DNQX on the outward sIPSCs frequency (left) and amplitude (right).
In addition, GABAergic sIPSCs were driven by action potentials because they were strongly inhibited by application of TTX (frequency from 3.6 ± 0.7 to 0.4 ± 0.07 Hz; amplitudes from 44.5 ± 6.7 to 24.9 ± 1.8 pA, both P < 0.05, paired t-test; n = 9). These findings were different from those obtained for glutamatergic sEPSCs, which were basically composed by miniature currents given they were not significantly affected by TTX application (frequency from 0.74 ± 0.1 to 0.49 ± 0.2 Hz; amplitudes from 35.1 ± 3.7 to 30.2 ± 3.1 pA, both P > 0.05, paired t-test; n = 6).
The preceding findings suggest that GABAergic neurons are spontaneously active, independent of excitatory drive. To confirm this hypothesis, we performed experiments using a low-chloride internal solution (see methods) and held cells at −20 mV. Under these conditions, chloride-mediated synaptic currents (GABAergic) are outward, whereas cationic synaptic currents (glutamatergic) are inward. As predicted, we observed a high frequency of outward currents (2.6 ± 0.3 Hz; n = 9) and only minor inward currents (0.6 ± 0.07 Hz; n = 6; quantified at −50 mV to increase signal-to-noise ratio; Fig. 3D). Application of DNQX inhibited all inward currents but did not affect either the frequency (control: 2.4 ± 0.8 Hz; DNQX: 3.1 ± 1.1 Hz; n = 6; P = 0.13, paired t-test) or the amplitude (control 20.0 ± 2.7 pA; DNQX: 20.2 ± 2.3 pA; n = 6; P = 1.0, paired t-test) of outward currents (Fig. 3E). These results confirm that spontaneous GABAergic synaptic activity in NCM is not dependent on glutamatergic interneuron activity and likely reflects spontaneous activity from GABAergic neurons.
GABAA receptors regulate temporal dynamics of song-evoked responses
The experiments in the preceding text suggest a prominent role for GABA in NCM synaptic physiology and possibly function. To directly investigate the contribution of GABAergic transmission to birdsong auditory processing in NCM, we combined multi-electrode extracellular recordings in awake restrained birds with local pharmacological interventions during playback of a randomized series of conspecific and heterospecific songs and tone stimuli (see methods).
Before injections, typical song-evoked responses were detectable at recording sites in both hemispheres (Supplementary Fig. S4). These responses typically consisted of bursts of multiunit action potentials in response to song syllables with a sustained (tonic) activity that bridged the intervals between syllables and outlasted the stimulus (Figs. 4A and 5B, control electrodes). Note that NCM has a high level of irregular spontaneous activity that can be seen preceding the stimulus in the panels of Fig. 4. Application of BIC dramatically changed the pattern of NCM responses to song playback. First, song-evoked responses were converted from tonic, to large phasic bursts of activity that exhibited on-off-like features (Figs. 4B and 5B, BIC electrodes). This BIC-induced phasic behavior during song presentation was especially robust in response to the first syllable. Second, the sustained firing between syllables was largely abolished by BIC application (Figs. 4B and 5B, BIC electrodes). As described in methods, drug doses were maintained at a level that affected spontaneous activity somewhat, producing increased burstiness without changing the average level of activity.
FIG. 4.

Local BIC and PTX application alters the temporal organization of song-induced spikes in NCM. A: raw traces depicting multiunit responses to song playback from representative electrodes located in control and experimental hemispheres prior to drug application. Note that responses are sustained throughout the duration of the stimulus in both hemispheres. NCM typically has a high level of irregular spontaneous activity that can be seen preceding the stimulus. Song syllables can vary widely in amplitude, as seen on the stimulus envelope traces. B: application of BIC in the experimental hemisphere drastically changes the response profile of song-activated units. Note that the response becomes highly phasic and synchronized, particularly in relation to the 1st syllable, and that sustained activity between syllables is largely abolished. C: PTX treatment induces changes similar to those observed with BIC.
To gain insight into this reorganization of song-evoked responses, we calculated a ratio between the response amplitude after and before BIC application (Fig. 6A; a value of 1 indicates no effect). We found no difference in this ratio when comparing BIC and control sites (Student's t-test, df = 22, t = 0.453, P = 0.655, 2-tailed), indicating that BIC did not change the overall size of the response. However, a significant difference was obtained between experimental and control sites when comparing the temporal variance (Student's t-test, df = 22, t = 3.018, P = 0.006, 2-tailed), reflecting the increase in phasic bursts separated by periods of lowered activity (Fig. 6A). Interestingly, despite this clear change in the temporal pattern, the total response magnitude was unchanged, indicating that BIC altered network response properties at the recorded NCM sites without affecting the overall size of the recruited cell population (e.g., by lowering action potential threshold).
FIG. 6.

BIC application affects temporal response properties, but not response amplitude, in song-stimulated awake birds. A: total response amplitude for 4 conspecific songs was quantified as the RMS over the response period (stimulus duration +100-ms prestimulus window). The post-BIC value was divided by the pre-BIC value to obtain a ratio. This ratio did not differ between BIC and control hemispheres (left), indicating that total neuronal activity is unaffected by BIC. The temporal structure of the response was quantified by computing the SD of the response over the response period. The post-BIC value was divided by the pre-BIC value to obtain a ratio. This ratio was significantly higher in the BIC than in the control hemisphere, indicating that variability has increased under BIC, reflecting the more phasic character of the response. B: illustration of the hypothesis that BIC treatment recruits spiking activity from the tonic to the phasic window without affecting the overall response magnitude. The cartoon compares the temporal pattern of response to a single song syllable with (red) and without (blue) BIC based on data presented in Fig. 5. The BIC response has a higher phasic peak, followed by a lower tonic valley, corresponding to the higher variation seen under BIC (and in accordance with arrows in bottom graphs of Fig. 5B); the area under the 2 curves (alpha and alpha′) is the same. C: average response (n = 5 sweeps for the same stimulus) to a tone stimulus before (blue) and after (red) BIC application. Note that responses before BIC application are high at the onset of the stimulus and present a sustained response throughout the duration of the presentation. Under BIC, activity gets highly synchronized in response to the onset of the stimulus (higher peak). However, the sustained response throughout the duration of the stimulus decreases significantly as compared with control levels (lower valley). D: the song envelope correlation index (SECI; mean ± SE; see methods for definition and details) is compared for control and experimental hemispheres injected with BIC (red) or PTX (green). The values are close to 1 for the control sites indicating no drug-induced changes in the temporal pattern of auditory responses. Conversely, correlation values are significantly and comparably decreased (scores <1) in the experimental hemisphere after BIC and PTX treatments.
We next conducted the same in vivo experiment as in the preceding text except that picrotoxin (PTX), which blocks both GABAA and GABAC receptors, was used instead of BIC. As observed with BIC, local PTX administration converted the sustained responses found in the preinjection condition to highly phasic on-off-like responses (Fig. 4C). In addition, quantitative analysis showed no significant differences between the BIC and PTX effects (Supplementary Fig. S5). These data suggested that there were no additional quantitative effects of GABAC blockade on the measured responses. Thus we combined results from BIC and PTX experiments for the analyses that follow.
To further examine the drug-induced shift from a tonic to a phasic response pattern (see schematic model in Fig. 6B), we stimulated birds with pure tones, which are acoustically simpler than songs, and monitored the response profiles in NCM before and after either BIC or PTX injections. Under control conditions, responses to tone stimuli included both a phasic component at stimulus onset, and tonic activity persisting throughout the stimulus at a lower level (Fig. 6C; blue trace). Interestingly, under drug treatment, phasic onset responses significantly increased in size while the tonic component was markedly reduced (Fig. 6C; red trace). We quantified this relationship by computing a phasic/tonic response ratio for the best frequency at each site. When these ratios were compared between the predrug and drug conditions and between the control and experimental hemispheres, using a repeated-measures ANOVA, there was a significant effect of drug treatment on the phasic/tonic response ratio [F(1,19) = 9.06, P = 0.0072] and a significant interaction between drug treatment and hemisphere [F(1,19) = 16.81, P = 0.0061; post hoc testing with Bonferroni correction showed a significant increase in the phasic/tonic ratio only the drug hemisphere, P = 0.0033]. These results obtained with tone stimuli clearly confirm that BIC shifts neuronal responses from the tonic/sustained period to the phasic response window (schematized in Fig. 6B), as suggested by the increased phasic, and lower tonic, responses to full songs under BIC (Fig. 5B, arrows in bottom BIC graphs).
Correlation of phasic and tonic components is preserved during drug treatment
We have shown that blockade of inhibition, which would in theory enhance the excitability of NCM circuitry, instead triggers a marked suppression of the sustained component of song-evoked responses. One potential explanation for the drug-induced suppression of tonic responses is that when neuronal activity is recruited to the phasic period, after pharmacological treatment, the patterns of activity of the responding neurons becomes better correlated. One possibility is that the refractory periods of the responding neurons become synchronized; however, the time scale of the phasic-tonic relationship is tens of milliseconds, much longer than a biophysical refractory period. Nonetheless it is probable that the activity we record is strongly influenced by an oscillatory network. Thus it is possible that GABAergic antagonists effectively change the oscillation period of this network, leading to reduced excitability during the tonic interval. We could not directly test this hypothesis, but we investigated several relevant parameters in the data we collected. First, we observed that neurons recorded in NCM slices could fire at rates >20 Hz under BIC treatment (Fig. 2E shows a representative neuron) (see also Supplementary Fig. S6), corresponding to an interspike interval of 50 ms, which is a typical duration for the phasic burst. Although this finding suggests that NCM neurons could participate in both phasic and tonic periods of the response, this observation might not be true of all NCM neurons. Second, in vivo evoked auditory responses in NCM were unaffected by spontaneous bursts that, by chance, immediately preceded stimulus onset (Supplementary Fig. S7). Although this observation is highly supportive, it is not conclusive because we recorded a multiunit population, which prevents us from ruling out the possibility that different subpopulations participated in the spontaneous and stimulus-elicited activity. Finally, to answer these concerns, we undertook an analysis of the correlation and regression between the phasic and tonic activity for each response to tone stimuli at the best frequency for each site. In the predrug condition, these correlations were significant across recording sites in each bird (r2 range: 0.204–0.551, P < 0.05), and the regressions had positive slopes. When the slopes before and after BIC or PTX treatment, and between control and drug hemispheres, were compared using a repeated-measures ANOVA, we found a significant change in regression slope with drug treatment [F(1,12) = 6.34, P = 0.027] but no significant interaction between drug treatment and hemisphere. In post hoc tests with Bonferroni correction, we found no significant difference in slopes in either the control or experimental hemisphere before and after drug application (control hemisphere, P = 0.352, experimental hemisphere, P = 0.232). Thus the overall decrease reflects the increase in phasic responses and decrease in tonic responses that was documented earlier for group data. However, the regression slopes remained positive in all birds tested and correlations were significant in the treated (r2 range = 0.218–0.363, P < 0.05) and untreated (r2 range = 0.261–0.383, P < 0.05) hemisphere in six of seven birds tested. If synchronized excitability (or depression) that depended on an initial high frequency were the explanation for the suppression of tonic/sustained responses following GABAergic blockade, then trials with higher phasic activity (representing some combination of more units recruited, greater synchronization and higher firing rates) should have exhibited lower tonic responses. Interestingly, the opposite is in fact observed: trials with higher phasic responses also clearly have higher tonic responses, as determined by the positive correlations. While this does not rule out a subtle effect of changes in the periodicity or strength of an oscillatory network, it does suggest that the lower tonic response does not inversely reflect synchronization related to the higher phasic response.
GABAergic transmission regulates the temporal pattern of song-evoked responses
Whereas all song syllables normally elicited neuronal responses in NCM, the responses to a number of song syllables were either reduced or absent under BIC or PTX (Fig. 5B; examples in shaded boxes), indicating that GABAergic transmission blockade is changing the temporal profile of auditory processing in NCM. To demonstrate this effect, we compared the correlation between the stimulus envelope and the averaged response for the control versus experimental conditions. NCM responses do not closely parallel the amplitude waveform of the stimulus, even in the control condition, but this analysis demonstrates the type of changes in correlation associated with temporal reorganization of responses. A repeated-measures ANOVA that included drug type (BIC and PTX) and hemisphere as factors showed that GABA-receptor antagonists significantly reduced the correlation in the experimental hemisphere compared with the control hemisphere [F(1,7) = 53.4, P = 0.0016]. There was no interaction with drug type, confirming similar effects for both BIC and PTX [F(1,7) = 1.8, P = 0.222]. These comparisons are presented as a SECI (see methods), which shows no change for the control hemisphere and comparable changes in the experimental hemisphere for both BIC and PTX (Fig. 6D). These findings indicate that the BIC- and PTX-induced alterations in firing behavior resulted in a decreased temporal correlation of NCM responses to song elements. Thus we infer that under normal conditions, local GABAergic transmission contributes to the ability of NCM activity to follow the temporal envelope of the stimulus and thus could contribute to the fidelity of auditory processing in NCM.
GABAA antagonism does not influence frequency tuning in NCM
The changes in the temporal profile of the responses described in the preceding text might reflect decreased discrimination capabilities of NCM induced by expanded frequency tuning. In fact, this effect has been previously shown in central auditory neurons where local BIC treatment triggers significant expansion of frequency tuning curves in both single cell and population responses (Chen and Jen 2000; Suga et al. 1997; Yang et al. 1992). To explore this possibility, we determined the frequency tuning curves for NCM sites in both control and experimental hemispheres before and after BIC application. We observed, however, no effect of BIC on frequency tuning curves in NCM (Fig. 7), and an ANOVA showed no significant change in tuning width with drug treatment [F(1,47) = 1.45, P = 0.23] and no difference between hemispheres with treatment [F(1,47) = 1.60, P = 0.21; Fig. 7]. These findings indicate that although firing patterns are markedly altered by local GABAergic antagonism, frequency discrimination is preserved at the recorded NCM sites. Thus tuning changes do not account for the changes in the temporal profile of the responses to auditory stimulation under BIC.
FIG. 7.

GABAergic transmission does not shape frequency tuning in NCM. Tuning functions based on normalized phasic (0–50 ms) responses to tone stimuli (250–5,000 Hz) before (blue) and after (red) BIC application are shown for 4 recording sites (2 left hemisphere—control; 2 right hemisphere—BIC). Bottom traces in each graph show background levels of activity. Different sites show different best frequencies and tuning widths, but BIC does not cause any changes in the overall shape of the tuning functions.
DISCUSSION
Our results show that GABAergic neurons are abundant in NCM, that GABAergic synapses inhibit excitatory responses in NCM at rest, as evidenced from slice recordings, and that GABAergic transmission is necessary for normal temporal organization of song-evoked auditory responses in awake birds. Thus our study establishes that GABA-mediated transmission plays an important role in auditory processing of natural communication signals in the songbird NCM. More specifically, we observed that NCM responses to birdsong, recorded in awake restrained birds, shift from a primarily sustained (tonic) firing mode to a highly synchronized, phasic-like response pattern, on local blockade of GABAA receptors. This marked alteration in the temporal organization of NCM responses occurs without changes in the overall response amplitude at the recorded sites. Blockade of GABAergic transmission also suppresses the evoked responses to some song syllables. This action appears to be mediated primarily through GABAA receptors because spontaneous inhibitory transmission in NCM slices could be completely abolished by BIC, and no further effect was observed when both GABAC and GABAA receptors were blocked in our in vivo auditory experiments.
GABAergic transmission is known to play an important role in shaping the response properties of neurons from several sensory modalities. Consistent with its predominantly inhibitory action, GABA seems to restrain, both spatially and temporally, the excitatory activity that occurs during sensory processing in the majority of systems studied. Typically, antagonists of GABA-mediated transmission decrease the threshold for action potential generation, thereby increasing the excitability of neuronal networks and their firing frequency. In the auditory system, the focus of our interest, GABAA receptor antagonism markedly expands frequency-tuning curves at the level of the mesencephalon, thalamus, and/or cortex in various vertebrate species and shifts evoked responses from predominantly phasic to tonic (sustained) patterns (Chen and Jen 2000; Jen and Feng 1999; Lu et al. 1998; Pollak and Park 1993). GABAergic transmission has also been shown to play a role in more complex aspects of auditory processing as in the case of experience-dependent plasticity of auditory spatial maps in the barn owl (Zheng and Knudsen 1999, 2001). Importantly, GABAergic regulation of the integration dynamics in the time domain influences the statistical probability and/or timing precision of action potential generation, a mechanism postulated to encode perception. In the big brown bat (Eptesicus fuscus), for example, auditory cortical neurons that typically have brief response patterns, hence “phasic” responders, can be converted to “tonic” (sustained) responders by blocking GABAA receptors (Chen and Jen 2000; Jen and Feng 1999). Such changes suggest that during normal auditory processing, GABA suppresses sustained excitatory drive in response to stimulation. Comparable findings have also been reported in the primary cortical visual area V1, where blockade of inhibition converts phase-locked response patterns to tonic responses through enhanced overall neuronal excitability (Sillito 1975b, 1979).
Our present findings for the songbird NCM depart substantially from these previously described GABAergic mechanisms. For instance, one might have predicted that local BIC application would result in an expansion of tuning curves as occurs in other systems, leading to decreased frequency discrimination ability in NCM. However, frequency tuning curves in NCM were not affected by BIC, indicating that frequency discrimination in NCM is insensitive to GABAA-mediated inhibition. If GABAergic transmission regulates frequency tuning in the songbird auditory system, it does so outside NCM, possibly in preceding stations in the auditory pathway such as the primary telencephalic thalamo-recipient field L2. In fact, field L2a neurons in canary NCM exhibit strong inhibition at frequencies that flank the neuron's preferred frequency (Terleph et al. 2006). Such inhibitory sidebands are not found in NCM, supporting the notion that inhibition does not play a role in frequency encoding in this auditory area (Terleph et al. 2006).
Another remarkable difference from the previous literature was the tonic-to-phasic shift observed under BIC and PTX treatment. Although this finding attests to the importance of GABAA-mediated inhibition in NCM, the mechanism is presently unclear. A possible explanation is that, under normal GABAergic transmission (control condition), the refractory periods of song-responsive cells in our multiunit recordings are asynchronous, so cells would be able to encode the auditory stimulus by responding at different times, and/or with different latencies to specific acoustic features. Under BIC, however, song-responsive cells would show a strong phasic activation and then synchronize their refractory periods, resulting in a lack of responsiveness over a specific time window.
According to this hypothesis (synchronization of refractory periods), we would expect firing activity to be completely suppressed during the period that follows a phasic response. However, our observations make this possibility highly unlikely based on both phenomenological and analytical grounds. First, NCM neurons in slices fire, under BIC, at rates >20 Hz, so such neurons would not be expected to become refractory over the time periods of the phasic and tonic responses we observed. Second, evoked auditory responses in the NCM of awake birds were still reliably elicited following spontaneous bursts of activity that immediately occurred prior to stimulus onset. These data strongly suggest that the recorded NCM sites recover from inactivation rapidly and can respond to successive inputs well within the range of intersyllable intervals in a typical song. Finally, we showed that phasic and tonic responses are positively correlated in control and BIC conditions, which is inconsistent with the hypothesis that higher phasic responses reflect greater synchronous excitation that leads to synchronized refractoriness.
An interesting alternative hypothesis is that GABAA-mediated inhibition normally suppresses a secondary inhibitory network in NCM. Such a network would be “released,” or disinhibited, from GABAA-receptor influence on the local application of BIC and actively prevent NCM neurons from responding in a sustained/tonic fashion to song. Such hypothesis could also explain the lack of neuronal responses to some syllables, reflected in decreased fidelity of auditory responses. Based on our data, though, this secondary network would have to rely on a BIC-insensitive inhibitory mechanism, which could be implemented in various ways. For example, inhibitory neurons that relied on GABAB-mediated transmission could be under the control of the BIC-sensitive inhibitory network and thus actively suppress sustained song-evoked firing under BIC. However, the BIC-induced tonic-to phasic reversal of NCM's firing pattern occurred in a time scale substantially faster than that typically carried out by metabotropic GABAB receptors (Bowery et al. 2002; Dutar and Nicoll 1988a,b; Tamas et al. 2003). The possibility that GABAB receptors were tonically disinhibited by BIC or PTX treatment over the whole course of the experiment cannot be ruled out with our data. Importantly, however, BIC abolished all measurable sIPSCs in our slice recordings, which indicates no GABAB influence was present, although this might not generalize to the in vivo condition. Thus the involvement of GABAB receptors seems at present unlikely but cannot be ruled out.
Another possible scenario is that GABA might act as an excitatory transmitter at a subset of NCM synapses as described for the mammalian brain (Cohen et al. 2002; Gulledge and Stuart 2003; reviewed in Stein and Nicoll 2003); the blockade of such synapses could decrease some components of song-evoked responses. Yet another possibility is that NCM contains distinct populations of GABAA-mediated inhibitory synapses with different sensitivities to BIC. Under this hypothesis, our BIC application (which was not maximal, intentionally, so as to avoid seizure-inducing concentrations) would have blocked the synapses with highest affinity for BIC, whereas less BIC-sensitive synapses would still be able to exert an inhibitory effect on NCM responses. Preliminary data indicate that GABAergic cells in NCM can themselves express the GABAA receptor (not shown), providing a possible substrate for a GABAA-dependent double-inhibitory circuit if different classes of GABAA synapses differ in BIC sensitivity.
Finally, one cannot exclude the possibility that the BIC-insensitive inhibition in NCM might be mediated by an inhibitory neurotransmitter different from GABA. For example, metabotropic glutamate receptors, which can trigger inhibitory effects under physiological conditions (Fiorillo and Williams 1998) and are highly expressed in NCM (Wada et al. 2004), could be involved. Alternatively, glycinergic transmission, which plays an important role in the physiology of auditory brain stem areas of other vertebrates (Caspary et al. 2005; Kotak et al. 1998; Suneja et al. 1998) could participate in a putative double-inhibitory (disinhibitory) circuit. Indeed although our preliminary attempts to verify glycinergic transmission in NCM slices have been unsuccessful, recent in situ hybridization data show that glycine receptor components are expressed in NCM, and in vivo recordings in awake zebra finches show that local application of strychnine, a glycinergic receptor antagonist, can modulate some aspects of the NCM response to birdsong (Mello et al. 2007). Further studies are needed to establish the precise nature of the novel and complex inhibitory interactions we have uncovered here. In addition, subsequent investigations will be necessary to more precisely characterize the role of inhibitory transmission on the detection and analysis of the spectral and temporal features of song.
Our patch-clamp data show that spontaneously released GABA actively inhibits the excitatory network that drives NCM neurons in our slice preparations on BIC application. It seems likely that the elements of this excitatory network may be intrinsic to NCM because about half of NCM neurons are likely excitatory (Pinaud and Mello 2007; Pinaud et al. 2004). Alternatively, the excitatory drive we observed could come from the adjacent auditory field L and/or CMM, which are present in our slices and are thought to provide input to NCM (Vates et al. 1996), although we currently do not know whether the fibers from these input pathways are present in the slices. We do not know the extent to which the events observed in the slices also occur in vivo. It is tempting to speculate, however, that during auditory stimulation, the GABAergic cells that suppress the excitatory drive onto NCM neurons may be inhibited so that the excitatory network can become functional and process and transmit auditory information to other brain areas (Fig. 8). Should this configuration be confirmed, it will be important to determine whether the inhibition directed at spontaneously active GABAergic cells arises from sources extrinsic or intrinsic to NCM (Fig. 8; top vs. bottom schematics).
FIG. 8.

Anatomical-functional NCM model. This simplified model suggests that under resting conditions, spontaneously active GABAergic synapses suppress NCM's excitatory network and that on auditory stimulation, spontaneously active GABAergic synapses are suppressed by a secondary inhibitory network that is inactive at rest and that is activated by auditory stimuli. The inhibition of spontaneously active GABAergic synapses could arise from locations remote to NCM, such as field L (A and B), as well as from GABAergic neurons intrinsic to NCM (C and D). GABAergic neurons are illustrated in red while excitatory cells are black; bright colors indicate activated neurons while faded colors illustrate resting cells.
Unconventional interactions of inhibitory networks similar to those reported here may also be present, but still undetected, in cortical areas of other sensory systems or species. NCM is a telencephalic pallial area comparable, based on connectivity, to supragranular layers of the mammalian auditory cortex because it receives projections from the primary thalamo-recipient region field L and participates in intra-telencephalic circuitry that precedes the descending auditory projections originating in the arcopallium (Karten and Shimizu 1989; Mello et al. 1998). To our knowledge, a high-resolution analysis of the role of GABAergic inhibition in the encoding of complex sounds has not yet been performed at a comparable brain level in mammals although we should point out that we do not know the extent to which NCM and other avian auditory regions may compare with parts of the primary and higher-order auditory cortical fields in the mammalian brain. It is also possible, however, that the mechanisms we uncovered here are specific to NCM and reflect specializations related to the processing and encoding of learned vocalizations and/or behaviorally-relevant vocal communication signals. Songbirds are among the very few animals that evolved vocal learning (besides humans, cetaceans, bats, and 2 other avian orders), whereas most species, including non-human primates and rodents, lack this trait (reviewed in Jarvis 2004). Interestingly, in some auditory stations (e.g., the mammalian medial geniculate nucleus), an increase in GABAergic cell number has been shown to parallel phylogenetic increases in the computational requirements associated with a growing complexity of auditory-related behaviors (Winer and Larue 1996). In NCM, about half of the neuronal population is GABAergic, and a large proportion of these neurons participate in the auditory response to song (Pinaud et al. 2004); in contrast, only 25–30% of the neuronal population in the presumed mammalian NCM counterpart is inhibitory (Jones 1993). This high density of GABAergic elements in NCM and the apparently unique and complex interaction of inhibitory circuits we described here could reflect the high demands of encoding and/or memorization of learned natural communication signals. Should this hypothesis prove correct, our results could shed an important light on the function and evolution of auditory processing areas in other vocal learners as well as the neural basis of speech acquisition and language processing in humans.
GRANTS
This work was supported by National Institutes of Health Grants 02853 to C. V. Mello, 40900 to D. S. Vicario, and TW006955 to C. V. Mello and R. M. Leāo and Fundacao de Amparo a Pesquisa do Estado de Sao Paulo Grant 03/04319-0 to R. M. Leão. R, Pinaud was an N. L. Tartar Research Fellow.
Supplementary Material
Acknowledgments
The authors thank Profs. Jane MacPherson, Henrique von Gersdorff, Curtis Bell, and Matthew Frerking for insightful discussions and critical feedback on this manuscript. We also thank Drs. Wamberto Varanda (FMRP-USP) and Henrique von Gersdorff (Vollum Institute) for support with earlier experiments.
The costs of publication of this article were defrayed in part by the payment of page charges. The article must therefore be hereby marked “advertisement” in accordance with 18 U.S.C. Section 1734 solely to indicate this fact.
Footnotes
The online version of this article contains supplemental data.
REFERENCES
- Bolhuis et al. 2000.Bolhuis JJ, Zijlstra GG, den Boer-Visser AM, Van Der Zee EA. Localized neuronal activation in the zebra finch brain is related to the strength of song learning. Proc Natl Acad Sci USA 97: 2282–2285, 2000. [DOI] [PMC free article] [PubMed] [Google Scholar]
- Bowery et al. 2002.Bowery NG, Bettler B, Froestl W, Gallagher JP, Marshall F, Raiteri M, Bonner TI, Enna SJ. International Union of Pharmacology. XXXIII. Mammalian gamma-aminobutyric acid(B) receptors: structure and function. Pharmacol Rev 54: 247–264, 2002. [DOI] [PubMed] [Google Scholar]
- Caspary et al. 2005.Caspary DM, Schatteman TA, Hughes LF. Age-related changes in the inhibitory response properties of dorsal cochlear nucleus output neurons: role of inhibitory inputs. J Neurosci 25: 10952–10959, 2005. [DOI] [PMC free article] [PubMed] [Google Scholar]
- Catchpole and Slater 1995.Catchpole CK, Slater PJB. Bird Song: Biological Themes and Variations. Cambridge, UK: Cambridge Univ. Press, 1995.
- Chen and Jen 2000.Chen QC, Jen PH. Bicuculline application affects discharge patterns, rate-intensity functions, and frequency tuning characteristics of bat auditory cortical neurons. Hear Res 150: 161–174, 2000. [DOI] [PubMed] [Google Scholar]
- Chew et al. 1995.Chew SJ, Mello C, Nottebohm F, Jarvis E, Vicario DS. Decrements in auditory responses to a repeated conspecific song are long-lasting and require two periods of protein synthesis in the songbird forebrain. Proc Natl Acad Sci USA 92: 3406–3410, 1995. [DOI] [PMC free article] [PubMed] [Google Scholar]
- Chew et al. 1996.Chew SJ, Vicario DS, Nottebohm F. A large-capacity memory system that recognizes the calls and songs of individual birds. Proc Natl Acad Sci USA 93: 1950–1955, 1996. [DOI] [PMC free article] [PubMed] [Google Scholar]
- Cohen et al. 2002.Cohen I, Navarro V, Clemenceau S, Baulac M, Miles R. On the origin of interictal activity in human temporal lobe epilepsy in vitro. Science 298: 1418–1421, 2002. [DOI] [PubMed] [Google Scholar]
- Doupe and Kuhl 1999.Doupe AJ, Kuhl PK. Birdsong and human speech: common themes and mechanisms. Annu Rev Neurosci 22: 567–631, 1999. [DOI] [PubMed] [Google Scholar]
- Dutar and Nicoll 1988a.Dutar P, Nicoll RA. A physiological role for GABAB receptors in the central nervous system. Nature 332: 156–158, 1988a. [DOI] [PubMed] [Google Scholar]
- Dutar and Nicoll 1988b.Dutar P, Nicoll RA. Pre- and postsynaptic GABAB receptors in the hippocampus have different pharmacological properties. Neuron 1: 585–591, 1988b. [DOI] [PubMed] [Google Scholar]
- Dykes et al. 1984.Dykes RW, Landry P, Metherate R, Hicks TP. Functional role of GABA in cat primary somatosensory cortex: shaping receptive fields of cortical neurons. J Neurophysiol 52: 1066–1093, 1984. [DOI] [PubMed] [Google Scholar]
- Eysel et al. 1998.Eysel UT, Shevelev IA, Lazareva NA, Sharaev GA. Orientation tuning and receptive field structure in cat striate neurons during local blockade of intracortical inhibition. Neuroscience 84: 25–36, 1998. [DOI] [PubMed] [Google Scholar]
- Fiorillo and Williams 1998.Fiorillo CD, Williams JT. Glutamate mediates an inhibitory postsynaptic potential in dopamine neurons. Nature 394: 78–82, 1998. [DOI] [PubMed] [Google Scholar]
- Gobes and Bolhuis 2007.Gobes SM, Bolhuis JJ. Birdsong memory: a neural dissociation between song recognition and production. Curr Biol 17: 789–793, 2007. [DOI] [PubMed] [Google Scholar]
- Gulledge and Stuart 2003.Gulledge AT, Stuart GJ. Excitatory actions of GABA in the cortex. Neuron 37: 299–309, 2003. [DOI] [PubMed] [Google Scholar]
- Jarvis 2004.Jarvis ED Learned birdsong and the neurobiology of human language. Ann NY Acad Sci 1016: 749–777, 2004. [DOI] [PMC free article] [PubMed] [Google Scholar]
- Jen and Feng 1999.Jen PH, Feng RB. Bicuculline application affects discharge pattern and pulse-duration tuning characteristics of bat inferior collicular neurons. J Comp Physiol [A] 184: 185–194, 1999. [DOI] [PubMed] [Google Scholar]
- Jones 1993.Jones EG GABAergic neurons and their role in cortical plasticity in primates. Cereb Cortex 3: 361–372, 1993. [DOI] [PubMed] [Google Scholar]
- Karten and Shimizu 1989.Karten HJ, Shimizu T. The origins of neocortex: connections and lamination as distinct events in evolution. J Cogn Neurosci 1: 291–301, 1989. [DOI] [PubMed] [Google Scholar]
- Konishi 1965a.Konishi M Effects of deafening on song development in American robins and black-headed grosbeaks. Z Tierpsychol 22: 584–599, 1965a. [PubMed] [Google Scholar]
- Konishi 1965b.Konishi M The role of auditory feedback in the control of vocalization in the white-crowned sparrow. Z Tierpsychol 22: 770–783, 1965b. [PubMed] [Google Scholar]
- Koppl et al. 2000.Koppl C, Manley GA, Konishi M. Auditory processing in birds. Curr Opin Neurobiol 10: 474–481, 2000. [DOI] [PubMed] [Google Scholar]
- Kotak et al. 1998.Kotak VC, Korada S, Schwartz IR, Sanes DH. A developmental shift from GABAergic to glycinergic transmission in the central auditory system. J Neurosci 18: 4646–4655, 1998. [DOI] [PMC free article] [PubMed] [Google Scholar]
- Kroodsma and Miller 1982.Kroodsma DE, Miller EH. Acoustic Communication in Birds. New York: Academic, 1982.
- Lu et al. 1998.Lu Y, Jen PH, Wu M. GABAergic disinhibition affects responses of bat inferior collicular neurons to temporally patterned sound pulses. J Neurophysiol 79: 2303–2315, 1998. [DOI] [PubMed] [Google Scholar]
- Mello et al. 2007.Mello CV, Lovell PV, Lu K, Vicario DS. Glycinergic transmission in the avian auditory telencephalon. Soc Neurosci Abstr 532.512, 2007. [Google Scholar]
- Mello et al. 1998.Mello CV, Vates GE, Okuhata S, Nottebohm F. Descending auditory pathways in the adult male zebra finch (Taeniopygia guttata). J Comp Neurol 395: 137–160, 1998. [PubMed] [Google Scholar]
- Mello et al. 1992.Mello CV, Vicario DS, Clayton DF. Song presentation induces gene expression in the songbird forebrain. Proc Natl Acad Sci USA 89: 6818–6822, 1992. [DOI] [PMC free article] [PubMed] [Google Scholar]
- Muller and Leppelsack 1985.Muller CM, Leppelsack HJ. Feature extraction and tonotopic organization in the avian auditory forebrain. Exp Brain Res 59: 587–599, 1985. [DOI] [PubMed] [Google Scholar]
- Nottebohm 1999.Nottebohm F The anatomy and timing of vocal learning in birds. In: The Design of Animal Communication, edited by Konishi M. Cambridge: MIT Press, 1999, p. 63–110.
- Nowicki and Searcy 2004.Nowicki S, Searcy WA. Song function and the evolution of female preferences: why birds sing, why brains matter. Ann NY Acad Sci 1016: 704–723, 2004. [DOI] [PubMed] [Google Scholar]
- Phan et al. 2006.Phan ML, Pytte CL, Vicario DS. Early auditory experience generates long-lasting memories that may subserve vocal learning in songbirds. Proc Natl Acad Sci USA 103: 1088–1093, 2006. [DOI] [PMC free article] [PubMed] [Google Scholar]
- Pinaud et al. 2006.Pinaud R, Fortes AF, Lovell P, Mello CV. Calbindin-positive neurons reveal a sexual dimorphism within the songbird analogue of the mammalian auditory cortex. J Neurobiol 66: 182–195, 2006. [DOI] [PubMed] [Google Scholar]
- Pinaud and Mello 2007.Pinaud R, Mello CV. GABA immunoreactivity in auditory and song control brain areas of zebra finches. J Chem Neuroanat 34: 1–21, 2007. [DOI] [PMC free article] [PubMed] [Google Scholar]
- Pinaud et al. 2004.Pinaud R, Velho TA, Jeong JK, Tremere LA, Leao RM, von Gersdorff H, Mello CV. GABAergic neurons participate in the brain's response to birdsong auditory stimulation. Eur J Neurosci 20: 1318–1330, 2004. [DOI] [PubMed] [Google Scholar]
- Pollak and Park 1993.Pollak GD, Park TJ. The effects of GABAergic inhibition on monaural response properties of neurons in the mustache bat's inferior colliculus. Hear Res 65: 99–117, 1993. [DOI] [PubMed] [Google Scholar]
- Ramoa et al. 1988.Ramoa AS, Paradiso MA, Freeman RD. Blockade of intracortical inhibition in kitten striate cortex: effects on receptive field properties and associated loss of ocular dominance plasticity. Exp Brain Res 73: 285–296, 1988. [DOI] [PubMed] [Google Scholar]
- Saper and Sawchenko 2003.Saper CB, Sawchenko PE. Magic peptides, magic antibodies: guidelines for appropriate controls for immunohistochemistry. J Comp Neurol 465: 161–163, 2003. [DOI] [PubMed] [Google Scholar]
- Sen et al. 2001.Sen K, Theunissen FE, Doupe AJ. Feature analysis of natural sounds in the songbird auditory forebrain. J Neurophysiol 86: 1445–1458, 2001. [DOI] [PubMed] [Google Scholar]
- Sillito 1975a.Sillito AM The contribution of inhibitory mechanisms to the receptive field properties of neurones in the striate cortex of the cat. J Physiol 250: 305–329, 1975a. [DOI] [PMC free article] [PubMed] [Google Scholar]
- Sillito 1975b.Sillito AM The effectiveness of bicuculline as an antagonist of GABA and visually evoked inhibition in the cat's striate cortex. J Physiol 250: 287–304, 1975b. [DOI] [PMC free article] [PubMed] [Google Scholar]
- Sillito 1977.Sillito AM Inhibitory processes underlying the directional specificity of simple, complex and hypercomplex cells in the cat's visual cortex. J Physiol 271: 699–720, 1977. [DOI] [PMC free article] [PubMed] [Google Scholar]
- Sillito 1979.Sillito AM Inhibitory mechanisms influencing complex cell orientation selectivity and their modification at high resting discharge levels. J Physiol 289: 33–53, 1979. [DOI] [PMC free article] [PubMed] [Google Scholar]
- Stein and Nicoll 2003.Stein V, Nicoll RA. GABA generates excitement. Neuron 37: 375–378, 2003. [DOI] [PubMed] [Google Scholar]
- Suga et al. 1997.Suga N, Zhang Y, Yan J. Sharpening of frequency tuning by inhibition in the thalamic auditory nucleus of the mustached bat. J Neurophysiol 77: 2098–2114, 1997. [DOI] [PubMed] [Google Scholar]
- Suneja et al. 1998.Suneja SK, Potashner SJ, Benson CG. Plastic changes in glycine and GABA release and uptake in adult brain stem auditory nuclei after unilateral middle ear ossicle removal and cochlear ablation. Exp Neurol 151: 273–288, 1998. [DOI] [PubMed] [Google Scholar]
- Tamas et al. 2003.Tamas G, Lorincz A, Simon A, Szabadics J. Identified sources and targets of slow inhibition in the neocortex. Science 299: 1902–1905, 2003. [DOI] [PubMed] [Google Scholar]
- Terleph et al. 2006.Terleph TA, Mello CV, Vicario DS. Auditory topography and temporal response dynamics of canary caudal telencephalon. J Neurobiol 66: 281–292, 2006. [DOI] [PubMed] [Google Scholar]
- Terleph et al. 2007.Terleph TA, Mello CV, Vicario DS. Species differences in auditory processing dynamics in songbird auditory telencephalon. Dev Neurobiol 67: 1498–1510, 2007. [DOI] [PubMed] [Google Scholar]
- Terpstra et al. 2004.Terpstra NJ, Bolhuis JJ, den Boer-Visser AM. An analysis of the neural representation of birdsong memory. J Neurosci 24: 4971–4977, 2004. [DOI] [PMC free article] [PubMed] [Google Scholar]
- Tremere et al. 2001.Tremere L, Hicks TP, Rasmusson DD. Expansion of receptive fields in raccoon somatosensory cortex in vivo by GABA(A) receptor antagonism: implications for cortical reorganization. Exp Brain Res 136: 447–455, 2001. [DOI] [PubMed] [Google Scholar]
- Vates et al. 1996.Vates GE, Broome BM, Mello CV, Nottebohm F. Auditory pathways of caudal telencephalon and their relation to the song system of adult male zebra finches. J Comp Neurol 366: 613–642, 1996. [DOI] [PubMed] [Google Scholar]
- Wada et al. 2004.Wada K, Sakaguchi H, Jarvis ED, Hagiwara M. Differential expression of glutamate receptors in avian neural pathways for learned vocalization. J Comp Neurol 476: 44–64, 2004. [DOI] [PMC free article] [PubMed] [Google Scholar]
- Walrond et al. 1993.Walrond JP, Govind CK, Huestis SE. Two structural adaptations for regulating transmitter release at lobster neuromuscular synapses. J Neurosci 13: 4831–4845, 1993. [DOI] [PMC free article] [PubMed] [Google Scholar]
- Wild et al. 1993.Wild JM, Karten HJ, Frost BJ. Connections of the auditory forebrain in the pigeon (Columba livia). J Comp Neurol 337: 32–62, 1993. [DOI] [PubMed] [Google Scholar]
- Winer and Larue 1996.Winer JA, Larue DT. Evolution of GABAergic circuitry in the mammalian medial geniculate body. Proc Natl Acad Sci USA 93: 3083–3087, 1996. [DOI] [PMC free article] [PubMed] [Google Scholar]
- Yang et al. 1992.Yang L, Pollak GD, Resler C. GABAergic circuits sharpen tuning curves and modify response properties in the mustache bat inferior colliculus. J Neurophysiol 68: 1760–1774, 1992. [DOI] [PubMed] [Google Scholar]
- Zeigler and Marler 2004.Zeigler HP, Marler P. Behavioral Neurobiology of Birdsong. New York: New York Academy of Sciences, 2004. [DOI] [PubMed]
- Zheng and Knudsen 1999.Zheng W, Knudsen EI. Functional selection of adaptive auditory space map by GABAA-mediated inhibition. Science 284: 962–965, 1999. [DOI] [PubMed] [Google Scholar]
- Zheng and Knudsen 2001.Zheng W, Knudsen EI. Gabaergic inhibition antagonizes adaptive adjustment of the owl's auditory space map during the initial phase of plasticity. J Neurosci 21: 4356–4365, 2001. [DOI] [PMC free article] [PubMed] [Google Scholar]
Associated Data
This section collects any data citations, data availability statements, or supplementary materials included in this article.
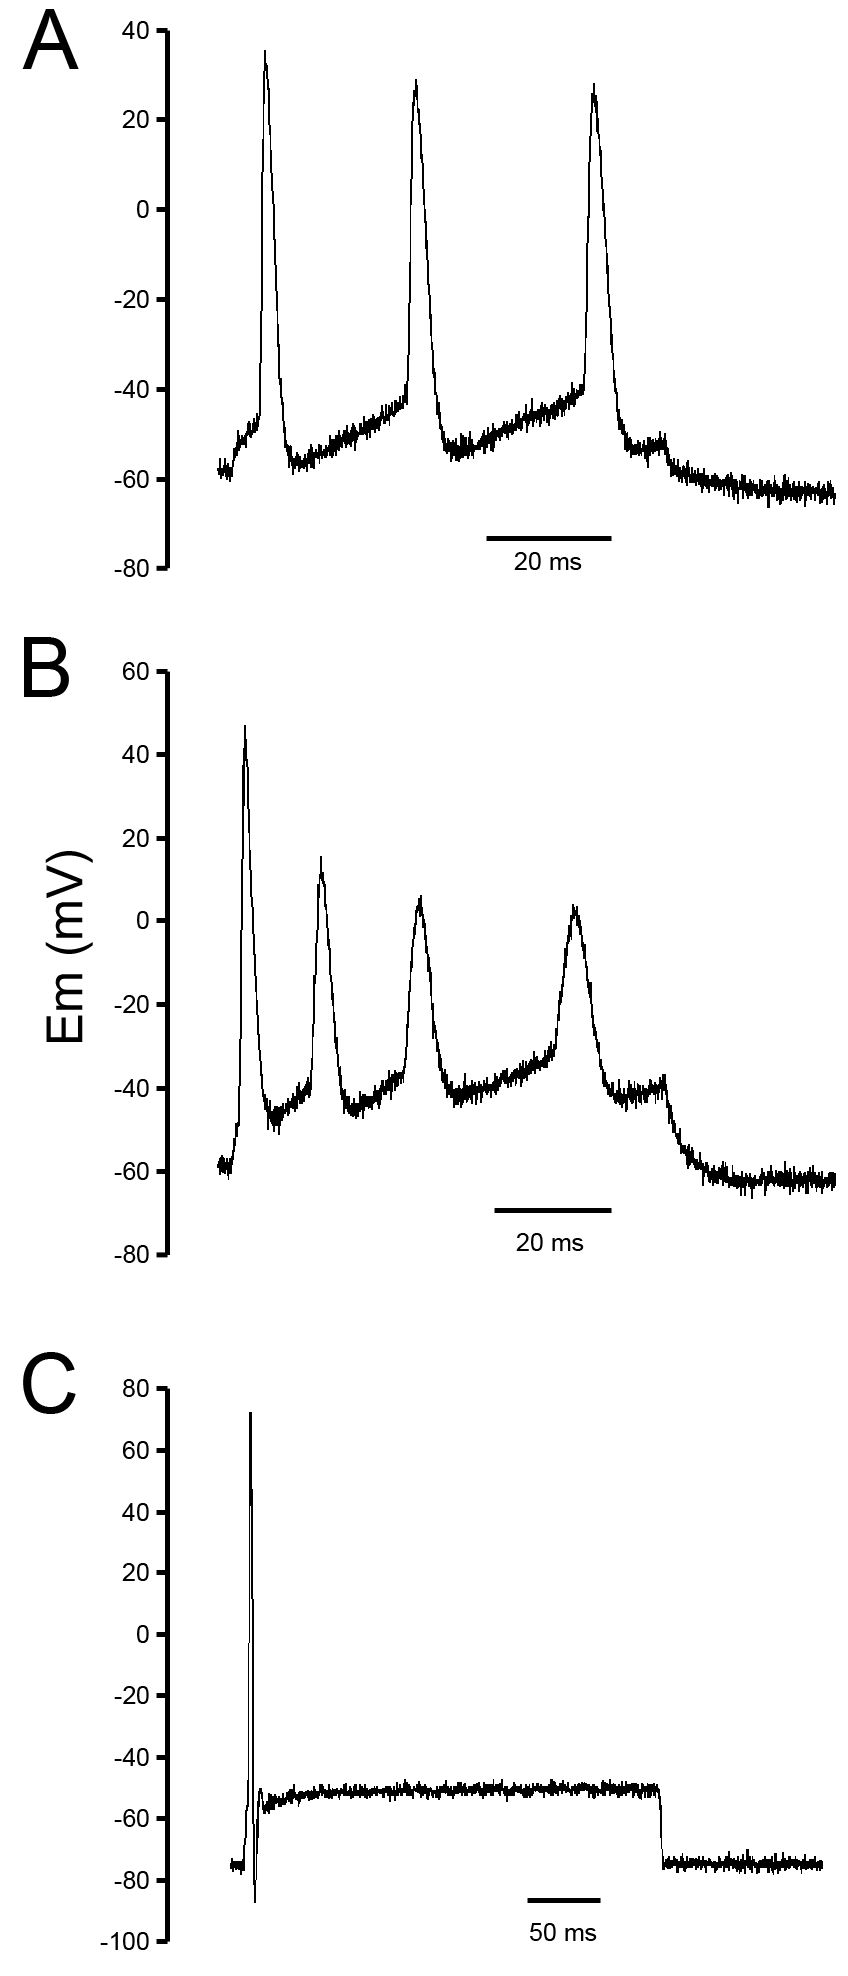