Abstract
Collecting duct cells swell when exposed to arginine vasopressin (AVP) in the presence of a transepithelial osmolality gradient. We investigated the mechanisms of AVP-induced cell swelling in isolated, perfused rat inner medullary collecting ducts (IMCDs) using quantitative video microscopy and fluorescence-based measurements of transepithelial water transport. We tested the roles of transepithelial water flow, basolateral solute entry, and the cytoskeleton (actomyosin). When a transepithelial osmolality gradient was imposed by addition of NaCl to the bath, AVP significantly increased both water flux and cell height. When the osmolality gradient was imposed by addition of mannitol, AVP increased water flux but not cell height, suggesting that AVP-induced cell swelling requires a NaCl gradient and is not merely dependent on the associated water flux. Bumetanide (Na-K-2Cl cotransporter inhibitor) added to the bath markedly diminished the AVP-induced cell height increase. AVP-induced cell swelling was absent in IMCDs from NKCC1-knockout mice. In rat IMCDs, replacement of Na, K, or Cl in the peritubular bath caused significant cell shrinkage, consistent with a basolateral solute transport pathway dependent on all three ions. Immunocytochemistry using an antibody to NKCC1 confirmed basolateral expression in IMCD cells. The conventional nonmuscle myosin II inhibitor blebbistatin also diminished the AVP-induced cell height increase and cell shape change, consistent with a role for the actin cytoskeleton and myosin II. We conclude that the AVP-induced cell height increase is dependent on basolateral solute uptake via NKCC1 and changes in actin organization via myosin II, but is not dependent specifically on increased apical water entry.
Keywords: cell volume, blebbistatin, cytoskeleton, kidney, inner medulla
an early observation made soon after introduction of the isolated, perfused tubule technique was that the cortical collecting duct (CCD) of the rabbit undergoes certain morphological changes upon exposure to vasopressin, including an increase in cell height, widening of the intercellular space, a change in cell shape with bulging of the center of the apical region into the lumen, and the formation of intracellular vacuoles (10). Similar observations have been made in isolated, perfused inner medullary collecting ducts (20). These changes were seen also in vivo (31) and are unique features of the collecting duct system.
The mechanism of these morphological changes (often described as “cell swelling”) has been controversial. One idea is that the cell swelling occurs simply as a result of an increase in water flow across the cells. The cell swelling is presumed to be due to a disproportionate increase in the water permeability of the apical plasma membrane vs. the basolateral plasma membrane (10). Thus, water uptake across the apical plasma membrane is thought to transiently exceed efflux across the basolateral plasma membrane until a new steady state is reached. This idea has been widely accepted because collecting ducts perfused without the presence of a transepithelial osmolality gradient showed no swelling (10). However, whether the increase in water flow is a direct cause of cell swelling remains questionable as revealed from later studies. For example, using video-differential interference contrast microscopy coupled with optical sectioning to estimate osmotic water permeability of each individual plasma membrane (24) and cell volume (25) in isolated, perfused CCDs, Strange and Spring estimated a ratio of basolateral-to-apical water permeability of at least 7:1. They found no substantial increase in cell volume in response to arginine vasopressin (AVP) in the presence of a transepithelial osmolality gradient. They reasoned that, because the basolateral plasma membrane has a much higher surface area and water permeability than the apical plasma membrane, a large AVP-induced transepithelial water flow in the absorptive direction can occur without increasing cell volume.
Nielsen et al. (20) showed that morphological changes induced by AVP in the inner medullary collecting duct (IMCD) were similar to those seen previously in the CCD. Moreover, they observed that while both AVP and cAMP both increase osmotic water permeability, cell swelling was observed in response to AVP but not to cAMP. These data also raised doubts about whether AVP-induced cell swelling is caused by increased transepithelial water flow.
Another idea is that the cell swelling occurs because vasopressin induces a flux of solutes into the cell, dragging water with it. Solute transporters such as Na+-H+ exchangers and ion cotransporters such as NKCC1 have been implicated in cell volume homeostasis in many cell types. In accordance with this idea, a previous study by Sun and Hebert (26) on IMCD cells established that AVP could induce a rapid recovery in cell volume secondary to hypertonic shrinkage, which was inhibitable by amiloride and DIDS. It was concluded that AVP-dependent cell volume recovery is achieved by salt uptake via parallel Na+-H+ and Cl−-HCO3− transport processes in the basolateral membrane (26). Using electron probe microanalysis to measure intracellular ion content in rat IMCD suspensions under hypertonic NaCl conditions, Grunewald and Kinne (12) also demonstrated a faster and greater increase in Na+ and Cl− content in the IMCD cells treated with cAMP compared with the cells without cAMP. These authors, however, commented that the gain in total intracellular inorganic electrolytes is too small to account for the observed volume increase and proposed that additional osmolytes or organic compounds have to be invoked to account for the total volume recovery.
A third possibility is that the cell swelling occurs because of a vasopressin-induced rearrangement of the cytoskeleton. The actin cytoskeleton in association with nonmuscle myosin II is known to play important roles in cell mobility, cell division, and cell shape maintenance. Activation of nonmuscle myosin II by phosphorylation of its regulatory light chain (MLC) would enhance the acto-myosin interaction in muscle and nonmuscle tissue and affect the stiffness/plasticity of cytoskeleton (4). Previously, we demonstrated that AVP increases both monophospho-ser19-MLC and diphospho-thr18/ser19-MLC in IMCD suspensions (5). AVP also causes a significant rearrangement of actin filament distribution and a significant increase in cell height in IMCD cells in primary culture (5). These observations suggested that AVP-induced IMCD cell swelling or cell shape change could involve reorganization of the actin cytoskeleton.
The purpose of the present study was to investigate mechanisms involved in vasopressin-induced cell swelling in the rat IMCD, focusing on the above hypotheses. The results from isolated, perfused tubule studies suggest that AVP-induced cell swelling in IMCD is attributable to both solute uptake across the basolateral membrane of IMCD cell via the bumetanide-sensitive cotransporter NKCC1 and AVP-induced cytoskeleton rearrangement via nonmuscle myosin II activation. We also obtained biochemical evidence for the presence of NKCC1 mRNA and protein in IMCD cells and demonstrated the basolateral membrane localization of NKCC1 protein in the principal cells of rat IMCD.
MATERIALS AND METHODS
N-methyl-d-glucamine, sodium d-gluconate, calcium d-gluconate, and bumetanide were purchased from Sigma (Milwaukee, WI). AVP was purchased from Bachem (Torrance, CA). S-(−)-Blebbistatin was purchased from Toronto Research Chemicals (North York, Ontario). Rabbit polyclonal antibodies against aquaporin-1 (AQP1; AP 266), AQP2 (AP 127), NCC (A857), KCC1 (L572), and chicken primary antibody against AQP2 (LL265) were produced in our laboratory. Two rabbit polyclonal antibodies against NKCC1 (COOH terminus and NH2 terminus) were generous gifts from Dr. J. Turner (National Institutes of Health).
Experimental animals.
Unless otherwise stated, all experiments were done in IMCD segments isolated from Sprague-Dawley rats [National Heart, Lung, and Blood Institute (NHLBI)/DIR ACUC animal protocol #H-0110]. Some experiments were done in mice in which the NKCC1 gene was deleted (9) or in age- and weight-matched control mice of the SV129/Black Swiss strain (NHLBI/DIR ACUC animal protocol #H-0047).
Isolated tubule microperfusion study.
IMCD segments were obtained from the region 30–70% of the distance along the axis of the inner medullas of pathogen-free male Sprague-Dawley rats (80–120 g; Taconic Farms, Germantown, NY) by freehand microdissection with Dumont #5 forceps. This was done in a physiological perfusate solution containing (in mM) 120 NaCl, 2 K2HPO4, 5 KCl, 25 NaHCO3, 2 CaCl2, 1.2 MgSO4, and 5.5 glucose (290 mosmol/kgH2O) without enzymatic pretreatment. The tubules were mounted on miniature glass pipettes and perfused in vitro at 37°C utilizing the method described originally by Burg (3). To measure osmotic water permeability, an osmotic gradient was imposed across the epithelium. The lumen was perfused with the same solution described above, and the peritubular bath solution was the same as perfusate except that an additional 111 mM NaCl was added to raise the osmolality to 490 mosmol/kgH2O. One millimolar fluorescein sulfonate (Molecular Probes) was added to the luminal perfusate as a readily measurable, impermeant luminal marker, which is concentrated when water moves from the lumen to the peritubular bath. Fluorescein sulfonate concentrations in perfusate and collected fluid were measured by continuous-flow ultramicrofluorometry (28), allowing calculation of transepithelial water flux and osmotic water permeability (Pf) according to the equation of Al Zahid et al. (1).
To measure the cell height of perfused IMCD segments, we used a Sony digital photo camera (DKC-5000) mounted on a Leitz inverted microscope equipped with differential interference contrast optics to record tubule images. The condenser and objectives were both long-working distance lenses (×32/0.40 numerical aperture). The total magnification was ×450 when the images were displayed. All images acquired from the same tubule were displayed and aligned using Adobe Photoshop to ensure uniform cell height comparisons throughout different experimental periods. Both outer diameter (O.D.) and inner diameter (I.D.) were measured from recorded images using a calibrated electronic caliper on Photoshop. The cell height was calculated as (O.D. − I.D.)/2. For each tubule, the cell height measurements were made from three to five points along the tubule and averaged.
Ion substitution experiments.
To determine what solute transport pathway in the basolateral membrane of the IMCD cell could contribute to cell height maintenance, we carried out ion substitution experiments similar in approach to those used by Sands et al. (22). Compositions of solutions used for isotonic removal of Na+, K+, or Cl− from bath solution are listed in Table 1. All bicarbonate-buffered solutions were equilibrated with 95% air-5% CO2. Solution without bicarbonate was gassed by 100% O2. N-methyl-d-glucamine-Cl was prepared by dissolving N-methyl-d-glucamine in water and titrating with HCl to pH 7.4. N-methyl-d-glucamine-HCO3 was prepared by dissolving N-methyl-d-glucamine in water, bubbling with CO2 to pH 9.0, and titrating to pH 7.5.
Table 1.
Composition of solutions
| Perfusate | Bath | Na-free Bath | K-free Bath | Cl-free Bath | Mannitol Bath | |
|---|---|---|---|---|---|---|
| NaCl | 120 | 231 | 0 | 120 | 0 | 120 |
| NaHCO3 | 25 | 25 | 0 | 25 | 25 | 25 |
| K2HPO4 | 2 | 2 | 2 | 0 | 2 | 2 |
| MgSO4 | 1.2 | 1.2 | 1.2 | 1.2 | 1.2 | 1.2 |
| CaCl2 | 2 | 2 | 2 | 2 | 0 | 2 |
| Glucose | 5.5 | 5.5 | 5.5 | 5.5 | 5.5 | 5.5 |
| Urea | 5 | 5 | 5 | 5 | 5 | 5 |
| Na2HPO4 | 0 | 0 | 0 | 2 | 0 | 0 |
| N-methyl-d-glucamine-Cl | 0 | 0 | 120 | 0 | 0 | 0 |
| N-methyl-d-glucamine-HCO3 | 0 | 0 | 25 | 0 | 0 | 0 |
| Na d-gluconate | 0 | 0 | 0 | 0 | 120 | 0 |
| Ca d-gluconate | 0 | 0 | 0 | 0 | 7 | 0 |
| Mannitol | 0 | 0 | 0 | 0 | 0 | 179 |
| Osmolality | 290 | 490 | 290 | 290 | 290 | 490 |
All concentrations are in mM, and osmolality is in mosmol/kgH2O.
IMCD suspensions.
IMCD suspensions were prepared as previously described with slight modification (6). Inner medullas were dissected, minced, and digested into suspensions by 70- to 90-min incubation at 37°C in digestion fluid (250 mM sucrose, 10 mM triethanolamine, pH 7.6) containing collagenase B (2 mg/ml) and hyaluronidase (1,000 U/ml). One-third of the inner medullary suspension was collected without fractionation and labeled as “whole IM.” The remaining two-thirds of the inner medullary suspension was subjected to one low-speed centrifugation (at 70 g, 20 s) to separate IMCD-enriched fragments in the pellet from the lighter, non-IMCD structures in the supernatant. The IMCD-enriched fraction was further purified by resuspending the pellet in the same sucrose solution and spinning at 70 g, 20 s, twice. The final pellet was collected and labeled as “IMCD.” The non-IMCD fraction collected from the supernatant was harvested by spinning at 1,500 g for 10 min. The non-IMCD fraction was further purified by resuspending in bicarbonate-buffered solution and spinning at 70 g, 20 s, twice. The final supernatant was harvested by spinning at 1,500 g, for 10 min. This fraction was collected and labeled “non-IMCD.” All three samples, whole IM, IMCD, and non-IMCD, were homogenized in 1× Laemmli buffer (1.5% SDS, 6% glycerol, 10 mM Tris, pH 6.8) by a sonicator (Misonix model 3000, Farmingdale, NY). After the protein content was quantified using the BCA method (Pierce), samples were stored at −80°C in the presence of 40 mM dithiothreitol (DTT).
Immunoblotting.
Proteins were resolved by SDS-PAGE on Criterion polyacrylamide gels (Bio-Rad, Hercules, CA) at 200 V for 1 h and transferred electrophoretically onto nitrocellulose membranes at 80 V for 40 min. Blots were blocked for 1 h with a proprietary blocking buffer (Li-Cor, Lincoln, NE), rinsed, and probed with the respective affinity-purified antibodies at proper dilution (in Licor blocking buffer containing 0.1% Tween 20) overnight at 4°C. After 1-h incubation with secondary antibody (Alexa fluor 680 anti-rabbit immunoglobulin G; Invitrogen) at 1:5,000 dilution, sites of antibody-antigen reaction were detected using the Odyssey infrared imager (Li-Cor).
Immunofluorescence confocal microscopy.
The immunofluorescence staining procedure was described previously (32). Briefly, paraffin-embedded kidney sections containing cortex and medulla were dewaxed and rehydrated. Antigen retrieval was performed with microwave heat for 15 min in TEG buffer (in mM: 10 Tris and 0.5 EGTA, pH 9.0). The sections were neutralized with NH4Cl buffer and blocked with 1% BSA, 0.2% gelatin, and 0.05% saponin in PBS before incubation overnight with primary antibody diluted in 0.1% BSA and 0.3% Triton X-100 in PBS. After being rinsed with 0.1% BSA, 0.2% gelatin, and 0.05% saponin in PBS, the sections were reacted for 1 h with secondary antibody diluted in 0.1% BSA and 0.3% Triton X-100 in PBS. The secondary antibodies used were conjugated with fluorophore Alexa 488 or Alexa 568 (Invitrogen). Cell nuclei were stained with DAPI [4 μl DAPI stock solution (0.2 mg/ml) diluted in 10 ml PBS]. The sections were then preserved in fluorescence mounting medium (S3023, Dako North America). Confocal fluorescence images were taken using a Zeiss LSM 510 microscope and software (Carl Zeiss MicroImaging, Thornwood, NY) at the Light Microscopic Facility in NHLBI.
RT-PCR.
After the animal was euthanized, the left kidney was surgically prepared to be perfused with 10 ml of ice-cold dissection solution, followed by 10 ml of the same solution containing collagenase B (2 mg/ml) and hyaluronidase (1,000 U/ml). The inner medulla was dissected, torn into small slices, and incubated in the same digestion solution for 40 min at 37°C. IMCD segments were microdissected in dissection solution containing 5 mM vanadyl ribonucleoside (BioLabs), a potent RNase inhibitor. Microdissected IMCDs (2 mm per sample) were transferred by glass bead to a second dissection dish to wash out contaminating debris and then transferred into RT-PCR reaction tubes, which contained 8.7 μl of permeabilizing agent (>1 U/μl RNase inhibitor, 0.2% Triton X-100, and 5 mM DTT).
Reverse transcription was initiated by adding 11.3 μl of a mixture containing 50 U avian myeloblastosis virus (AMV) reverse transcriptase (Boehringer-Mannheim), 50 U RNase inhibitor, 20 nmol of each deoxynuclotide phosphate, and 1.6 μg of poly(dT)15 in Boehringer-Mannheim reverse transcription incubation buffer. For reverse transcription negative control reactions, the enzyme was replaced by an equal volume of DEPC water. The reaction was carried out for 60 min at 42°C followed by enzyme inactivation for 5 min at 95°C and storage at 4°C until the addition of the PCR reagents.
PCR was performed using a Gene-Amp DNA amplification reagent kit (Applied Biosystems). The sequences of all specific primers used in this study are listed in Table 2. To carry out the PCR experiment, 80 μl of PCR master mix containing 20 nmol of deoxynucleotide phosphate, 50 pmol each of sense and antisense primers, and 2.5 U AmpliTag DNA polymerase were added to each tube. The samples were processed for 30 cycles [94°C, 1 min (5 min for the initial cycle); 55–60°C, 1 min; 72°C, 1 min]. The elongation period in the last cycle was extended to 7 min. The final PCR products were mixed with RNA buffer containing ethidium bromide and incubated at 65°C for 5 min. After the sample on ice was chilled, the samples were loaded on 1% agarose RNA gels for eletrophoresis. The gels were visualized and photographed under UV light using a Kodak FOTO/UV 300 imaging system.
Table 2.
Primer sequences used in RT-PCR
| NKCC1 F | 5′-TGTTGGTTTAATGATCTGTGGCC-3′ |
| NKCC1 R | 5′-CTCGGATCTTACAATCTTTCCAC-3′ |
| KCC1 F | 5′-TGCACATTAAGCCGGACCAGT-3′ |
| KCC1 R | 5′-ACCAGTCATCTCGAGTCAGGA-3′ |
| KCC2 F | 5′-GCCTCAATGTTCCCGAAGAGACAG-3′ |
| KCC2 R | 5′-AGTTGCTCAGTGAGGACCTCCAGG-3′ |
| KCC3ab F | 5′-GACAACAGTATCCAGATGAAGAAG-3′ |
| KCC3ab R | 5′-CTCGTTCTAATCCCTCAGTGAGC-3′ |
| KCC3b F | 5′-GCCCGGATTCAGGATTCAGATGA-3′ |
| KCC3b R | 5′-AACTTGTTCACATAGCGTACGCC-3′ |
| KCC4 F | 5′-ATCTGTGCTAGAGGGCACC-3′ |
| KCC4 R | 5′-AGCAGGACCAGTTGGGCAT-3′ |
F, forward; R, reverse.
Measurement of cAMP.
Fifty-microliter aliquots of IMCD suspensions were preincubated at 37°C for 20 min with 0.5 mM isobutyl methylxanthine (IBMX) in the presence or absence of 100 μM blebbistatin followed by incubation with 0.1 nM AVP for 5 min. Samples were pelleted at 1,000 g for 1 min, and the supernatant was discarded. Tissue pellets were lysed by adding 0.2 N HCl and incubating for 20 min at room temperature followed by centrifugation at >10,000 g for 10 min. Pellets were used to measure protein content (BCA assay, Pierce), and supernatants were saved for measuring cAMP as previously described (14).
Statistical analysis.
Data are presented as means ± SE. For each tubule, the measured Pf or cell height was averaged for each experimental period. The mean values from all tubules were compared using paired t-test or ANOVA test. P < 0.05 was considered significant.
RESULTS
AVP-induced cell height increase in rat IMCD.
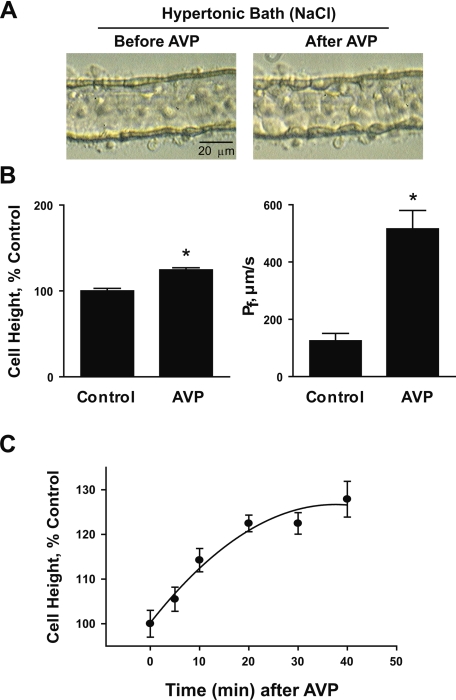
Rat IMCD segments were perfused in vitro for measurement of osmotic water permeability and cell height. Upon exposure to the hypertonic bath solution, IMCD cell height was rapidly (within seconds) and significantly reduced (steady-state cell heights were control: 7.0 ± 0.2; hypertonic: 5.6 ± 0.2 μm, n = 17, P < 0.001). Figure 1 shows typical steady-state images of perfused IMCD segments in the presence of a 200 mosmol/kgH2O bath-to-lumen osmolality gradient (made by adding NaCl to the bath solution) before and after AVP stimulation. Before AVP stimulation, the IMCD epithelium had a relatively smooth luminal profile. After exposure to AVP until a new steady state was reached, the IMCD epithelium underwent a substantial change in cell shape associated with an increase in average cell height of 24% (before AVP: 5.6 ± 0.2; after AVP: 7.0 ± 0.1 μm, n = 17, P < 0.001) and a fourfold increase in water permeability (before AVP: 125 ± 26; after AVP: 516 ± 64 μm/s, n = 11, P < 0.001). A recognizable cell height increase was generally observed within 5–10 min after administration of AVP and a steady state was established within 20–40 min (Fig. 1C). The cell height increase is reversible with a significant cell height reduction detectable at 10–20 min after vasopressin washout reaching steady state in 50–60 min. The cell shape change consisted of bulging of individual cells into the lumen with better definition of cell boundaries. Under isotonic conditions (perfusate = bath = 290 mosmol/kgH2O), i.e., without preshrinkage of the cells, AVP did not cause a significant change in cell height (before AVP: 7.5 ± 0.4; after AVP: 7.8 ± 0.4 μm, n = 3, NS).
Fig. 1.
Isolated, perfused rat inner medullary collecting duct (IMCD) segments in hypertonic NaCl bath. A: light microscopic images of IMCD segments showing arginine vasopressin (AVP)-induced cell swelling. B: averaged percentage changes in cell height and measured osmotic water permeability (Pf) before and after 30-min exposure to 0.1 nM AVP. IMCD segments were perfused in the presence of a 200 mosmol/kgH2O bath-to-lumen osmolality gradient made by additional NaCl in the bath (perfusate: 290, bath: 490 mosmol/kgH2O). C: time course of AVP-induced cell height increase. *Significantly different from control period.
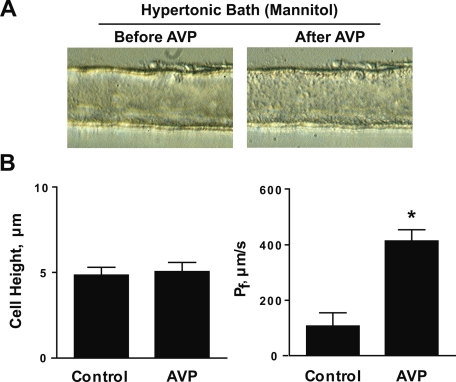
Figure 2 shows the result of experiments similar to those in Fig. 1, except that mannitol was used to establish the bath hypertonicity. Under these conditions, the IMCD segments did not show a significant increase in cell height in response to AVP stimulation (before AVP: 4.8 ± 0.5; after AVP: 5.1 ± 0.5 μm, n = 4), despite a large increase in water permeability from 107 ± 48 to 414 ± 41 μm/s, n = 4, P < 0.005. This result suggests that the AVP-induced cell height increase is dependent on the presence of a bath-to-lumen NaCl gradient rather than an osmolality gradient. It also demonstrated that the AVP-induced cell height increase does not always accompany increased transepithelial water flow. The dependence on an inwardly directed NaCl gradient suggests that vasopressin-induced cell height increase may be due to net entry of an Na+ salt, a Cl− salt, or NaCl itself into the cells across the basolateral plasma membrane.
Fig. 2.
Isolated, perfused rat IMCD segments in hypertonic mannitol bath. A: light microscopic images of IMCD segments showing no significant effect of AVP on cell height. B: averaged cell height and Pf before and after 30-min exposure to 0.1 nM AVP. These are parallel experiments to those done in Fig. 1, except that nonelectrolyte mannitol was used in the peritubular bath solution to generate a 200 mosmol/kgH2O transepithelialosmolality gradient. *Significantly different from control period.
Ion substitution experiments in rat IMCD.
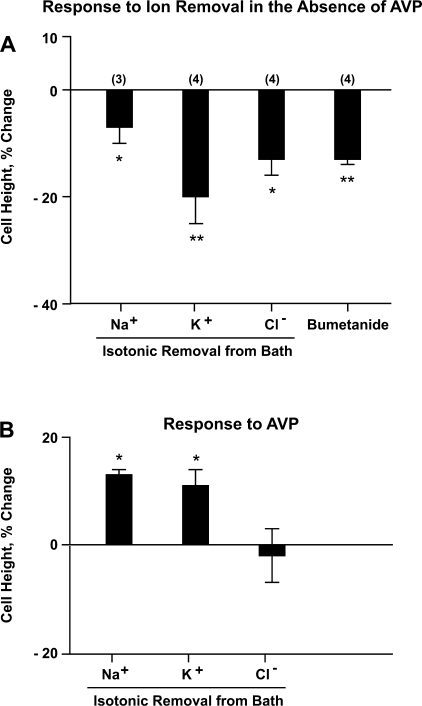
To determine what solute transport processes in the basolateral plasma membrane contribute to steady-state IMCD cell volume maintenance, we performed ion substitution experiments. IMCD segments were perfused with the same 290 mosmol/kgH2O solution in lumen and bath followed by isotonic removal of Na+ or K+ or Cl− from the peritubular bath solution. Figure 3A shows the changes in IMCD cell height due to each ion substitution. There was a significant reduction in IMCD cell height after isotonic removal of Na+ (−7 ± 3%, n = 3, P < 0.05) or K+ (−20 ± 5%, n = 4, P < 0.01) or Cl− (−13 ± 3%, n = 4, P < 0.05) from the bath solution. In addition, we found that bumetanide (100–300 μM) added to the peritubular bath also significantly reduced IMCD cell height (−13 ± 1%, n = 4, P < 0.005), indicating the presence of a bumetanide-sensitive transport pathway that mediates an inward net solute flux under steady-state isotonic conditions, presumably the secretory isoform of Na+-K+-2Cl− cotransporter (NKCC1).
Fig. 3.
Ion substitution experiments. Rat IMCD segments were perfused with equal 290 mosmol/kgH2O solution in the perfusate and the bath throughout 3 experimental periods (control, ion substitution, and ion substitution plus AVP). Each tubule was subjected to one ion substitution only. After cell height measurement at equilibrium condition in control period, Na+ or K+ or Cl− was isotonically removed from the bath solution (see Table 1). A: percentage changes in cell height in response to each ion substitution or adding bumetanide to the bath compared with the cell height measured in control period. *P < 0.05; **P < 0.01. B: percentage changes in cell height in response to addition of AVP to the bath compared with the cell height measured in previous period (ion substitution without AVP). *P < 0.01.
Figure 3B shows the cell height changes in response to AVP after a steady state had been established following each ion substitution. There was a small but significant increase in cell height seen in response to AVP with zero Na+ bath (13 ± 1%, P < 0.01) or zero K+ bath (11 ± 5%, P < 0.01) but not in zero Cl− bath (−2 ± 5%, NS). The effect of AVP on cell height with the same physiological saline solution in perfusate and bath was not significantly different from zero as noted above in the first paragraph of results.
Effect of bumetanide on AVP-induced cell height increase in rat IMCD.
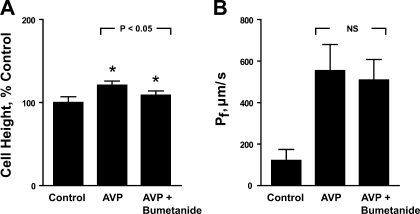
We next tested whether a bumetanide-sensitive pathway is responsible for the AVP-induced cell height increase seen in the presence of a bath solution made hypertonic by addition of NaCl. As shown in Fig. 4A, 100–300 μM bumetanide added to the peritubular bath significantly reduced the cell height increase induced by AVP from 21 ± 5 to 9 ± 5% (n = 5, P < 0.01). Although IMCD cell height was reduced by bumetanide, the AVP-dependent transepithelial water permeability was not significantly decreased by bumetanide in the same tubules (Fig. 4B), providing further evidence for dissociation between osmotic water flux and cell height. This result also demonstrates that the increase in IMCD cell height in response to AVP is attributable in part to basolateral solute uptake mediated by a bumetanide-sensitive transporter. In separate experiments, when IMCD segments were pretreated with bumetanide, AVP markedly increased water permeability from 141 ± 51 to 509 ± 82 μm/s with only a nominal 13 ± 3% increase in cell height (n = 3, P = 0.06). Since the electrochemical gradient is oriented inward for Na+-K+-2Cl− cotransporter and outward for K+-Cl− cotransporter (30), it appears likely that the transporter responsible for the AVP-induced cell height increase is an Na+-K+-2Cl− cotransporter, presumably NKCC1, which has been previously reported to be present in the IMCD of the mouse (18).
Fig. 4.
Effect of bumetanide on AVP-increased cell height (A) and Pf (B). Rat IMCD segments were perfused in the presence of a transepithelial osmolality gradient as in Fig. 1, with 3 different experimental periods in sequence: control, AVP alone, AVP+bumetanide. Both cell height and Pf were measured at equilibrium conditions in each experimental period. One hundred to three hundred micromolar bumetanide added to the bath significantly reduced IMCD cell height increased by AVP but had no significant effect on AVP-stimulated water permeability. The effect of 100 μM bumetanide was tested on 3 tubules and the effect of 300 μM bumetanide was tested on 2 tubules. Because of the similar effect, data were pooled. *Significantly different from previous period.
Isolated, perfused IMCD segments from NKCC1 null mice.
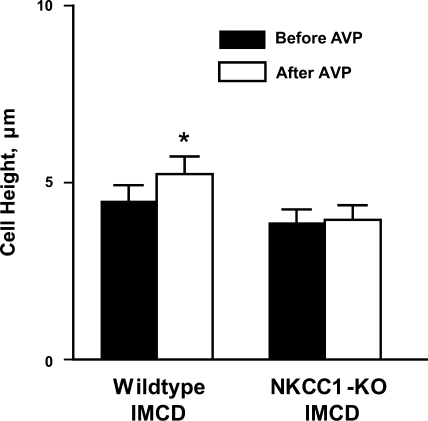
To further address the role of NKCC1 in the AVP-induced cell height increase, IMCD segments isolated from NKCC1 null mice were perfused in vitro. The IMCD tubules dissected from NKCC1 knockout mice had notably flatter cell height compared with IMCD tubules dissected from wild-type mice (wild-type: 6.0 ± 0.8 μm, n = 5; NKCC1 knockout: 4.0 ± 0.4 μm, n = 4, P < 0.05). Moreover, as shown in Fig. 5, IMCD segments dissected from NKCC1 knockout mice did not show a significant increase in cell height after exposure to AVP in the presence of a hypertonic bath, whereas there was a significant 17 ± 2% (n = 5, P < 0.01) cell height increase in IMCD segments from wild-type mice.
Fig. 5.
Lack of AVP-induced cell swelling response in IMCD microdissected from NKCC1 knockout mice. IMCD segments microdissected from NKCC1 knockout or wild-type mice were perfused in vitro and compared for the cell swelling response to AVP stimulation. IMCD microdissected from NKCC1 knockout mice had notably lower cell height than those from wild-type mice and did not have apparent cell height increase in response to AVP stimulation. *Significantly different from previous period.
Evidence for NKCC1 mRNA and protein expression in rat IMCD.
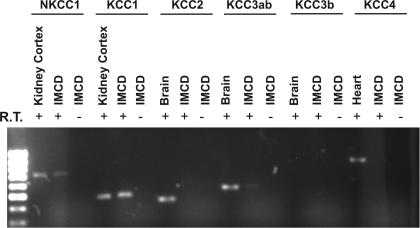
NKCC1 belongs to the SLC12 cation/Cl cotransporter gene family (solute carrier family 12, SLC12), which comprises several proteins known to drive Cl− influx (NCC, NKCC1 and NKCC2) or drive Cl− efflux (the KCl cotransporters, KCC1-KCC4) coupled with Na+ or K+ across the plasma membrane. RT-PCR experiments were performed to test the expression of mRNA of NKCC1 and KCC isoforms in microdissected IMCD segments (Fig. 6). These data provided evidence of expression of NKCC1 and KCC1 mRNA in microdissected IMCD segments.
Fig. 6.
RT-PCR detection of NKCC1 and KCC isoforms mRNA in microdissected rat IMCD segments. Two-millimeter length of microdissected IMCD segment was loaded for each sample. RNA was reverse-transcribed using AMV reverse transcriptase. cDNA was amplified by PCR using specific primers listed in Table 2 for 30 cycles. Amplified fragments corresponding to PCR target regions of NKCC1 (616 bp) and KCC1 (480 bp) were found in rat IMCD. A very faded band of KCC3ab (553 bp) was also seen. RT-PCR products without reverse transcriptase (R.T.) show no bands.
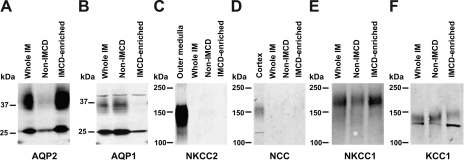
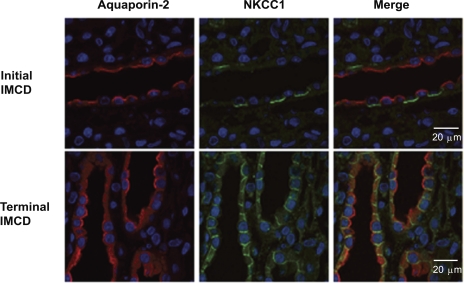
Figure 7 shows immunoblots for SLC12 proteins in whole inner medulla as well as fractionated “non-IMCD” and “IMCD-enirched” cells. The degree of enrichment of AQP2 (collecting duct marker) and deenrichment of AQP1 (loop of Henle and vasa recta marker) is documented in Fig. 7, A and B. As shown in Fig. 7, C and D, there was no evidence of NKCC2 or NCC in either fraction in contrast to strong signals from other portions of the kidneys. As shown in Fig. 7, E and F, NKCC1 and KCC1 are predominantly expressed in IMCD-enriched fractions relative to non-IMCD fractions, suggesting the presence of both proteins in the rat IMCD. Immunofluorescence labeling of NKCC1 in rat kidney showed predominant lateral membrane localization of NKCC1 in the terminal IMCD (Fig. 8). All cells in the terminal IMCD were labeled with antibodies to both AQP2 and NKCC1. In the initial IMCD (defined as being from the outer 25% of the inner medulla, nearest the inner-outer medullary junction), NKCC1 is predominantly present in the basolateral membrane of intercalated cells, in agreement with previous findings in rats (11). Thus, within the initial part of the IMCD, AQP2 and NKCC1 are expressed in different cell types, viz. principal cells and intercalated cells, respectively. In contrast, in the terminal part of the IMCD, the focus of the current study, both are expressed in the same cells, namely the so-called IMCD cells.
Fig. 7.
Immunoblotting of NKCC1 and KCC1 in rat inner medulla. The presence of NKCC1 or KCC1 protein was tested in 3 different fractions of inner medullary suspensions: whole inner medulla, non-IMCD, and IMCD-enriched, which were separated by low-speed centrifugations (see materials and methods). The enrichment of IMCD and non-IMCD fractions was confirmed by probing with aquaporin-2 (AQP2) and AQP1, respectively (A and B). Both NKCC1 and KCC1 are predominantly expressed in IMCD-enriched fractions (E and F), whereas NKCC2 and NCC are not present in IMCD cell fractions (C and D).
Fig. 8.
Immunolocalization of NKCC1 in the IMCD of rat kidney. NKCC1 was identified by a NH2-terminal antibody (1:200) and visualized by secondary antibody conjugated to Alexa Fluor 488 (green). Collecting duct principal cells were confirmed by the presence of AQP2 by a chicken AQP2 antibody (1:200) and visualized by secondary antibody conjugated to Alexa Fluor 568 (red). Nuclei are stained by DAPI (blue).
Effect of blebbistatin on AVP-induced cell height increase in rat IMCD.
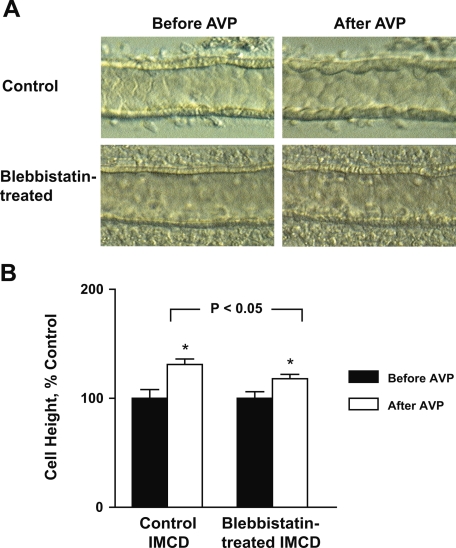
The fact that bumetanide attenuated but did not completely block AVP-induced IMCD cell height increases suggested the existence of an NKCC1-independent component involved in the cell height increase. We demonstrated previously in IMCD suspensions that AVP induces rearrangement of the actin cytoskeleton and stimulates phosphorylation of myosin regulatory light chain, the chief regulator of nonmuscle myosins, i.e., myosin II isoforms (5). Here, we employed blebbistatin, a relatively specific inhibitor of nonmuscle myosin II (23), to test the involvement of myosin II in the AVP-induced cell height increase. Figure 9 shows the effects of AVP on the IMCD with and without pretreatment with 100 μM blebbistatin. The tubules pretreated with blebbistatin not only had a diminished cell height increase (control: 31 ± 5%, n = 3 vs. blebbistatin-treated: 18 ± 4%, n = 4; P < 0.05), but also had a relatively smooth luminal profile following AVP stimulation compared with the control tubules. Blebbistatin-treated IMCD tubules also exhibited a significantly lower AVP-stimulated water permeability than the control tubules (control: 571 ± 108 vs. blebbistatin-treated: 256 ± 28 μm/s, n = 4, P < 0.05), but with a higher AVP-stimulated intracellular cAMP production (control: 436 ± 23; blebbistatin-treated: 708 ± 45 fmol cAMP/μg protein, n = 3, P < 0.01). This result suggests myosin II plays an important role in the cell height increase and cell shape changes that follow AVP stimulation, most likely through AVP-induced actin cytoskeleton rearrangement.
Fig. 9.
Effect of blebbistatin on AVP-induced cell swelling. AVP-induced cell swelling was compared in 2 groups of rat IMCD segments perfused in vitro, with and without 30-min pretreatment with a nonmuscle myosin II inhibitor blebbistatin. A: light microscopic images of perfused IMCD segments. Tubules pretreated with blebbistatin had attenuated cell height increase response and did not show striking cell shape changes as seen in tubules without blebbistatin pretreatment. B: averaged percentage changes in cell height before and after AVP stimulation. *Significantly different from previous period.
DISCUSSION
The present study examines the mechanisms involved in the vasopressin-induced cell swelling response of IMCD cells. As described earlier, three hypotheses have been proposed previously to account for the cell height increase in the IMCD following AVP stimulation, namely, increased transepithelial water flow, solute uptake, and cytoskeletal rearrangement. Several experiments provided data ruling out the first possibility. First, AVP markedly increased water absorption in bumetanide-pretreated tubules without a significant increase in cell height. Second, bumetanide addition after AVP exposure largely reversed the AVP-induced cell height increase, while having no significant effect on water permeability (Fig. 4). Third, when mannitol was used to produce a hypertonic bath, AVP did not significantly increase IMCD cell height despite a substantial increase in water flux (Fig. 2). Fourth, when the transepithelial osmolality gradient (and presumably the transepithelial water flux) was set to zero, the cells still responded to vasopressin with an increase in cell height in ion substitution experiments (Fig. 3B). The data demonstrate that the AVP-induced increase in cell height and AVP-induced increases in water flow in the IMCD can be disassociated and are therefore independent processes. The results suggest instead that AVP-induced cell height increase is related to a bath>lumen NaCl gradient rather than changes in water flux.
Involvement of solute uptake by NKCC1 in the AVP-induced cell height increase.
Based on the results of the present study, we conclude that solute uptake by NKCC1 across the basolateral membrane of the collecting duct cell, followed by water entry, accounts for a large fraction of the IMCD cell height increase following AVP stimulation. This conclusion is based on several pieces of evidence: 1) the dependence of this response on a bath>lumen NaCl gradient (Fig. 2); 2) the attenuation of the cell height increase with removal of Na+, K+, or Cl− from the pertitubular bath (Fig. 3); 3) the sensitivity of this response to bumetanide (Fig. 4); and 4) the lack of an AVP-induced cell-swelling response in IMCD segments microdissected from NKCC1 knockout mice (Fig. 5).
Although the bumetanide concentrations used in this study (100–300 μM) are higher than those used in cultured cells or parotid acinar cells (0.5–10 μM) (19), 100 μM bumetanide is needed to fully inhibit NKCC1 in rat (13, 27) or mouse (29) collecting duct cells. At these higher bumetanide concentrations, K+-Cl− cotransporters are partly inhibited (16). However, the inhibition of K+-Cl− cotransporters is unlikely to be the cause of a reduction in the cell height by bumetanide seen in the present study because the net electrochemical gradient for transport via neutral K+-Cl− cotransporters is oriented outward in the IMCD as in other cell types (30). In contrast, Na+-K+-2Cl− cotransporters mediate net Na+, K+, and Cl− uptake driven by the inwardly directed Na+ and Cl− gradients (30). Thus, K+-Cl− cotransport inhibition by bumetanide should increase cell height, rather than decrease it as seen in the present study.
Sun and Hebert (26) showed that AVP-dependent hypertonic volume regulation is dependent on Na+ uptake across the basolateral plasma membrane of rat IMCD, through parallel Na+-H+ and Cl−-HCO3− exchange pathways, different transporters than the transporter (NKCC1) implicated in the present study. However, the experimental conditions used in these two studies differed greatly. The osmotic agent used in the present study was NaCl, whereas sucrose was used in the previous study. Second, in the present study the osmolality was increased only in the peritubular bath, whereas in Sun and Hebert's study, the osmolalilties in both the perfusate and bath were increased, thereby avoiding a transepithelial osmotic gradient or an NaCl gradient. Because of the differing experimental conditions, the results cannot be compared directly. Thus, the functional role of NKCC1 in the AVP-induced cell height increase in IMCD is not necessarily in conflict with a role of parallel Na+-H+ and Cl−-HCO3− exchangers in the volume regulatory response following a different hypertonic challenge. Multiple alternative solute transport pathways often exist in epithelia. For example, Cl−-HCO3− exchanger abundance and function are increased in parotid acinar cells from NKCC1 null mice relative to wild-type mice, presumably compensating for the loss of functional NKCC1 protein (8).
Presence of NKCC1 in rat IMCD cells.
Electroneutral Na+-K+-2Cl− cotransporters are encoded by two separate genes NKCC1 (BSC2) and NKCC2 (BSC1). NKCC2, the absorptive isoform of NKCC, is kidney specific and expressed predominantly in the apical membrane of the thick ascending limb, where it plays a key role in NaCl absorption and dilution of the luminal fluid. NKCC1, the secretory isoform of NKCC, is known to be widely expressed in vertebrate tissues, where it plays a key role in maintaining cell volume homeostasis. In the mouse kidney, NKCC1 is located in the juxtaglomerular afferent arteriole as well as the juxtaglomerular mesangium, where it is thought to participate in tubuloglomerular feedback regulation and maintenance of blood pressure, and was found highly expressed in the basolateral membrane of the terminal IMCD (18). In the rat kidney, in addition to the glomerulus, NKCC1 was found by immunocytochemstry in the basolateral plasma membrane of α-intercalated cells (11), a finding confirmed in this study. Whether the NKCC1 is present in the cells of the IMCD of rat remained a matter of uncertainty. Using IMCD cell suspensions from Wistar rats, Grupp et al. (13) measured an ion dependence and inhibitor sensitivity of lactate production which is consistent with the presence of a Na+-K+-2Cl− cotransporter in IMCD cells. In cultured IMCD cells isolated from Wistar rats, Anzai et al. (2) also demonstrated the expression of NKCC1 mRNA and its regulation by hypertonicity. Ikebe et al. (17) also detected NKCC1 mRNA within microdissected IMCD segments and NKCC1 proteins within the rat inner medulla, although they could not conclude whether the NKCC1 protein detected from immunoblotting was due to the combined tissues of the base and the tip of inner medulla or due to the presence of NKCC1 in interstitial cells alone. Nevertheless, immunofluorescence studies done thus far in rat have localized NKCC1 to α-intercalated cells of the CCD, outer medulla, and the base region of the inner medulla, but not within the principal cells of the IMCD (11). In the present study using a high-quality NKCC1 antibody directed against the NH2-terminal tail (supplied by Dr. R. James Turner), we are able to provide clear evidence of basolateral membrane localization of NKCC1 in IMCD cells of the rat as in the mouse (18). NKCC1 expression in the rat IMCD was confirmed by RT-PCR.
Involvement of cytoskeletal rearrangement.
It is generally accepted that the cytoskeleton is an important determinant of cell shape. Given the gel-like nature of the cytosol, some change in the state of the cytoskeleton may be necessary for any cell shape change including that induced by AVP. The fact that AVP induces a small increase in cell height even in the absence of bath Na+ or K+ (Fig. 3B) suggests the existence of an NKCC1-independent process in the AVP-induced cell height increase. Based on our previous findings showing that vasopressin induces phosphorylation of myosin regulatory light chain (MLC2) and concomitantly causes a rearrangement of actin microfilaments in native IMCD cells (5), as well as the present results showing that the myosin II inhibitor blebbistatin attenuates AVP-induced cell height increases (Fig. 9), we propose that AVP-induced cytoskeletal rearrangement participates in cell volume changes as well. It is worth noting that perfused IMCD tubules pretreated with blebbistatin do not show the same type of protrusion of the center of the apical membrane into the lumen (bulging effect) in response to AVP as seen without blebbistatin. This qualitative difference also supports the view that the actin cytoskeleton plays an integral role in the AVP-induced cell height increase as well as in cell shape maintenance. A recent study in primary cultures of rat IMCD cells also provides evidence that blebbistatin blocks the ability of AVP to decrease the resistance of the apical plasma membrane to deformation, consistent with a role for myosin II in determination of the viscoelastic state of primary cultured IMCD cells (21).
Several investigations previously suggested that cytoskeletal rearrangement could in some manner activate NKCC1. In most cells, cell shrinkage is associated with reinforcement of the cortical cytoskeleton (7). Hoffmann et al. (15) suggested that cell shrinkage causes NKCC1 to enter an entirely activated state as a result of the formation of a cortical F-actin/myosin II network to which the kinase(s) that are involved in shrinkage-induced NKCC1 activation may translocate. As F-actin assembly increases, it is possible that a variety of proteins act as a scaffold to the actin network, thereby triggering the activation of the signaling cascade. Cytoskeletal rearrangement therefore may play a permissive role in the activation of NKCC1.
Relevance to vasopressin effects in other collecting duct segments.
The earliest studies on vasopressin effects on cell volume and morphology were accomplished in the CCD (10). Here, we studied IMCD cells. A relevant question is whether the mechanisms of vasopressin-induced cell height increase are likely to be the same in the CCD. It is important to recognize that the conditions for study of CCDs have generally differed from those used in this study. As fluid entering the cortical parts of the collecting duct system from distal convoluted tubules is normally hypotonic to the plasma, the transepithelial osmolality gradient across perfused CCDs has been established by switching the perfusate from an isotonic to a hypotonic solution (perfusate/bath: 150/290 mosmol/kgH2O), leaving the peritubular bath solution unchanged. In contrast, studies of IMCDs including those in this paper have normally employed a transepithelial osmolality gradient that is established by switching the peritubular bath solution from an isotonic to a hypertonic solution (perfusate/bath: 290/490 mosmol/kgH2O) since the interstitium of the inner medulla is generally very hypertonic. For this reason, we believe that the conclusions from these studies regarding mechanisms in the IMCD do not necessarily apply to the CCD. In the CCD, NKCC1 is expressed predominantly in the intercalated cells (11) and it could be argued that NKCC1 is unlikely to play a role in CCD principal cells. However, we cannot rule out a low level of NKCC1 expression in principal cells of the CCD, since a physiological level of NKCC1 may not be detectable by immunocytochemistry. Thus, the applicability of our conclusions in rat and mouse IMCD to the CCD and other parts of the collecting duct must await direct studies in those segments.
Conclusion.
We conclude that under conditions in which the peritubular osmolality is increased with NaCl, AVP increases IMCD cell height both by solute uptake via the basolateral membrane NKCC1 transporter and by AVP-induced cytoskeletal rearrangement via myosin II activation.
GRANTS
The work described in the paper was supported by the intramural budget of the NHLBI (Project ZO1-HL-001285) and National Institutes of Health grant (National Institute of Diabetes and Digestive and Kidney Diseases PO1-061521 Project 2).
Acknowledgments
The authors thank Drs. M. Burg and A. Weinstein for the very helpful discussions during the course of this study, Dr. G. Shull for providing NKCC1 knockout mice used in the present study, Dr. J. Turner for providing NKCC1 antibodies, and National Heart, Lung, and Blood Institute (NHLBI) Light Microscopic Facility manager Dr. C. Combs for excellent help regarding fluorescence immunocytochemistry.
The costs of publication of this article were defrayed in part by the payment of page charges. The article must therefore be hereby marked “advertisement” in accordance with 18 U.S.C. Section 1734 solely to indicate this fact.
Footnotes
We use the phrase “cell swelling” in this paper as a concise term to refer to the general process of shape change as described in the first paragraph of the paper, which we quantify via cell height measurements, and not to indicate a specific mechanism of shape change.
REFERENCES
- 1.Al Zahid G, Schafer JA, Troutman SL, Andreoli TE. Effect of antidiuretic hormone on water and solute permeation, and the activation energies for these processes, in mammalian cortical collecting tubules. J Membr Biol 31: 103–129, 1977. [DOI] [PubMed] [Google Scholar]
- 2.Anzai N, Izumida I, Kobayashi Y, Kawahara K. Roles of vasopressin and hypertonicity in basolateral Na/K/2Cl cotransporter expression in rat kidney inner medullary collecting duct cells. Jpn J Physiol 49: 201–206, 1999. [DOI] [PubMed] [Google Scholar]
- 3.Burg MB Perfusion of isolated renal tubules. Yale J Biol Med 45: 321–326, 1972. [PMC free article] [PubMed] [Google Scholar]
- 4.Cai S, Pestic-Dragovich L, O'Donnell ME, Wang N, Ingber D, Elson E, de Lanerolle P. Regulation of cytoskeletal mechanics and cell growth by myosin light chain phosphorylation. Am J Physiol Cell Physiol 275: C1349–C1356, 1998. [DOI] [PubMed] [Google Scholar]
- 5.Chou CL, Christensen BM, Frische S, Vorum H, Desai RA, Hoffert JD, de LP, Nielsen S, Knepper MA. Non-muscle myosin II and myosin light chain kinase are downstream targets for vasopressin signaling in the renal collecting duct. J Biol Chem 279: 49026–49035, 2004. [DOI] [PubMed] [Google Scholar]
- 6.Chou CL, Rapko SI, Knepper MA. Phosphoinositide signaling in rat inner medullary collecting duct. Am J Physiol Renal Physiol 274: F564–F572, 1998. [DOI] [PubMed] [Google Scholar]
- 7.Di CC, Nie Z, Szaszi K, Lewis A, Uruno T, Zhan X, Rotstein OD, Mak A, Kapus A. Osmotic stress-induced remodeling of the cortical cytoskeleton. Am J Physiol Cell Physiol 283: C850–C865, 2002. [DOI] [PubMed] [Google Scholar]
- 8.Evans RL, Park K, Turner RJ, Watson GE, Nguyen HV, Dennett MR, Hand AR, Flagella M, Shull GE, Melvin JE. Severe impairment of salivation in Na+/K+/2Cl− cotransporter (NKCC1)-deficient mice. J Biol Chem 275: 26720–26726, 2000. [DOI] [PubMed] [Google Scholar]
- 9.Flagella M, Clarke LL, Miller ML, Erway LC, Giannella RA, Andringa A, Gawenis LR, Kramer J, Duffy JJ, Doetschman T, Lorenz JN, Yamoah EN, Cardell EL, Shull GE. Mice lacking the basolateral Na-K-2Cl cotransporter have impaired epithelial chloride secretion and are profoundly deaf. J Biol Chem 274: 26946–26955, 1999. [DOI] [PubMed] [Google Scholar]
- 10.Ganote CE, Grantham JJ, Moses HL, Burg MB. Ultrastructural studies of vasopressin effect on isolated perfused renal collecting tubules of the rabbit. J Cell Biol 36: 355–367, 1968. [DOI] [PMC free article] [PubMed] [Google Scholar]
- 11.Ginns SM, Knepper MA, Ecelbarger CA, Terris J, He X, Coleman RA, Wade JB. Immunolocalization of the secretory isoform of Na-K-Cl contransporter in rat renal intercalated cells. J Am Soc Nephrol 7: 2533–2542, 1996. [DOI] [PubMed] [Google Scholar]
- 12.Grunewald RW, Kinne RK. Intracellular sorbitol content in isolated rat inner medullary collecting duct cells: regulation by extracellular osmolality. Pflügers Arch 414: 178–184, 1989. [DOI] [PubMed] [Google Scholar]
- 13.Grupp C, Pavenstadt-Grupp I, Grunewald RW, Bevan C, Stokes JB III, Kinne RK. A Na-K-Cl cotransporter in isolated rat papillary collecting duct cells. Kidney Int 36: 201–209, 1989. [DOI] [PubMed] [Google Scholar]
- 14.Hoffert JD, Chou CL, Fenton RA, Knepper MA. Calmodulin is required for vasopressin-stimulated increase in cyclic AMP production in inner medullary collecting duct. J Biol Chem 280: 13624–13630, 2005. [DOI] [PMC free article] [PubMed] [Google Scholar]
- 15.Hoffmann EK, Schettino T, Marshall WS. The role of volume-sensitive ion transport systems in regulation of epithelial transport. Comp Biochem Physiol A 148: 29–43, 2007. [DOI] [PubMed] [Google Scholar]
- 16.Hoffmann EK, Simonsen LO. Membrane mechanisms in volume and pH regulation in vertebrate cells. Physiol Rev 69: 315–382, 1989. [DOI] [PubMed] [Google Scholar]
- 17.Ikebe M, Nonoguchi H, Nakayama Y, Tashima Y, Tomita K. Upregulation of the secretory-type Na+/K+/2Cl−-cotransporter in the kidney by metabolic acidosis and dehydration in rats. J Am Soc Nephrol 12: 423–430, 2001. [DOI] [PubMed] [Google Scholar]
- 18.Kaplan MR, Plotkin MD, Brown D, Hebert SC, Delpire E. Expression of the mouse Na-K-2Cl cotransporter, mBSC2, in the terminal inner medullary collecting duct, the glomerular and extraglomerular mesangium, and the glomerular afferent arteriole. J Clin Invest 98: 723–730, 1996. [DOI] [PMC free article] [PubMed] [Google Scholar]
- 19.Kurihara K, Moore-Hoon ML, Saitoh M, Turner RJ. Characterization of a phosphorylation event resulting in upregulation of the salivary Na+-K+-2Cl− cotransporter. Am J Physiol Cell Physiol 277: C1184–C1193, 1999. [DOI] [PubMed] [Google Scholar]
- 20.Nielsen S, Muller J, Knepper MA. Vasopressin- and cAMP-induced changes in ultrastructure of isolated perfused inner medullary collecting ducts. Am J Physiol Renal Fluid Electrolyte Physiol 265: F225–F238, 1993. [DOI] [PubMed] [Google Scholar]
- 21.Riethmuller C, Oberleithner H, Wilhelmi M, Franz J, Schlatter E, Klokkers J, Edemir B. Translocation of aquaporin-containing vesicles to the plasma membrane is facilitated by actomyosin relaxation. Biophys J 94: 671–678, 2008. [DOI] [PMC free article] [PubMed] [Google Scholar]
- 22.Sands JM, Knepper MA, Spring KR. Na-K-Cl cotransport in apical membrane of rabbit renal papillary surface epithelium. Am J Physiol Renal Fluid Electrolyte Physiol 251: F475–F484, 1986. [DOI] [PubMed] [Google Scholar]
- 23.Straight AF, Cheung A, Limouze J, Chen I, Westwood NJ, Sellers JR, Mitchison TJ. Dissecting temporal and spatial control of cytokinesis with a myosin II inhibitor. Science 299: 1743–1747, 2003. [DOI] [PubMed] [Google Scholar]
- 24.Strange K, Spring KR. Cell membrane water permeabiity of rabbit cortical collecting duct. J Membr Biol 96: 27–43, 1987. [DOI] [PubMed] [Google Scholar]
- 25.Strange K, Spring KR. Absence of significant cellular dilution during ADH-stimulated water reabsorption. Science 235: 1068–1070, 1987. [DOI] [PubMed] [Google Scholar]
- 26.Sun A, Hebert SC. Rapid hypertonic cell volume regulation in the perfused inner medullary collecting duct. Kidney Int 36: 831–842, 1989. [DOI] [PubMed] [Google Scholar]
- 27.Wall SM, Fischer MP, Mehta P, Hassell KA, Park SJ. Contribution of the Na+-K+-2Cl− cotransporter NKCC1 to Cl− secretion in rat OMCD. Am J Physiol Renal Physiol 280: F913–F921, 2001. [DOI] [PubMed] [Google Scholar]
- 28.Wall SM, Han JS, Chou CL, Knepper MA. Kinetics of urea and water permeability activation by vasopressin in rat terminal IMCD. Am J Physiol Renal Fluid Electrolyte Physiol 262: F989–F998, 1992. [DOI] [PubMed] [Google Scholar]
- 29.Wall SM, Trinh HN, Woodward KE. Heterogeneity of NH+4 transport in mouse inner medullary collecting duct cells. Am J Physiol Renal Fluid Electrolyte Physiol 269: F536–F544, 1995. [DOI] [PubMed] [Google Scholar]
- 30.Weinstein AM A mathematical model of the inner medullary collecting duct of the rat: pathways for Na and K transport. Am J Physiol Renal Physiol 274: F841–F855, 1998. [DOI] [PubMed] [Google Scholar]
- 31.Woodhall PB, Tisher CC. Response of the distal tubule and cortical collecting duct to vasopressin in the rat. J Clin Invest 52: 3095–3108, 1973. [DOI] [PMC free article] [PubMed] [Google Scholar]
- 32.Yu MJ, Pisitkun T, Wang G, Shen RF, Knepper MA. LC-MS/MS analysis of apical and basolateral plasma membranes of rat renal collecting duct cells. Mol Cell Proteomics 5: 2131–2145, 2006. [DOI] [PMC free article] [PubMed] [Google Scholar]


