

Abstract
Background
Plasma apolipoprotein B (apo B) and VLDL and LDL with apolipoprotein C-III (apo C-III) are independent risk factors for cardiovascular disease (CVD). Dietary intake affects lipoprotein concentration and composition related to those apolipoproteins.
Objective
We studied differences in apo B lipoproteins with and without apo C-III after 3 healthy diets based on the Dietary Approaches to Stop Hypertension Trial diet.
Design
Healthy participants (n = 162) were fed each of 3 healthy diets for 6 wk in a crossover design. Diets differed by emphasis of either carbohydrate (Carb), unsaturated fat (Unsat), or protein (Prot). Blood was collected at baseline and after diets for analysis.
Results
Compared with the Carb diet, the Prot diet reduced plasma apo B and triglycerides in VLDL with apo C-III (16%, P = 0.07; 11%, P = 0.05, respectively) and apo B in LDL with apo C-III (16%, P = 0.04). Compared with the Unsat diet, the Prot diet reduced triglycerides in VLDL with apo C-III (16%, P = 0.02). Compared with baseline (subjects' usual diet was higher in saturated fat), the Prot diet reduced apo B in LDL with apo C-III (11%, P = 0.05), and all 3 diets reduced plasma total apo B (6−10%, P < 0.05) and apo B in the major type of LDL, LDL without apo C-III (8 −10%, P < 0.01). All 3 diets reduced the ratio of apo C-III to apo E in VLDL.
Conclusions
Substituting protein for carbohydrate in the context of a healthy dietary pattern reduced atherogenic apo C-III–containing LDL and its precursor, apo C-III–containing VLDL, resulting in the most favorable profile of apo B lipoproteins. In addition, compared with a typical high-saturated fat diet, healthy diets that emphasize carbohydrate, protein, or unsaturated fat reduce plasma total and LDL apo B and produce a lower more metabolically favorable ratio of apo C-III to apo E.
INTRODUCTION
Plasma LDL-cholesterol and total triglyceride (TG) concentrations are established risk factors for cardiovascular disease (CVD). Clinical trials have shown that apolipoprotein B (apo B)–containing lipoproteins contribute to the development and progression of atherosclerotic lesions (1, 2). Elevated plasma apo B is more strongly associated with vascular disease risk factors such as abdominal obesity, dyslipidemia, hyperinsulinemia, and thrombosis than is LDL cholesterol (3), and recent evidence suggests it to be a superior predictor of CVD risk than LDL cholesterol (4, 5) or non-HDL cholesterol (6–8).
Apolipoprotein C-III (apo C-III) can be present on both apo B–containing or apolipoprotein A-I (apo A-I)–containing (ie, HDL) lipoproteins but is not integral to the basic lipoprotein particle structure; thus, lipoproteins exist both with and without apo C-III. Apo B–containing lipoproteins with apo C-III are enriched in TGs and cholesterol and have slow clearance from plasma. Concentration of apo C-III in VLDL and LDL is highly and independently predictive of coronary heart disease, more so than TGs alone (9). Above all, LDL particles with apo C-III, a remnant particle produced by partial lipolysis in plasma of VLDL with apo C-III (10), is the lipoprotein particle type most predictive of CVD in type 2 diabetes (11). Apo C-III inhibits direct clearance of VLDL particles from plasma, resulting in the formation of LDL. New research strengthens the association between CVD and apo C-III by showing that apo C-III increases the adhesion of human monocytes to endothelial cells and activates proinflammatory molecules such as nuclear transcription factor κB in these cells (12–14)
The strong association between blood lipoproteins and CVD has fueled the investigation of dietary effects on lipoproteins as a pathway to CVD. Variations in macronutrient intake affect lipoprotein risk factors (15–21). Replacement of saturated fat with carbohydrate, unsaturated fat, or protein reduces LDL cholesterol, with unsaturated fat and protein having slightly more of an effect than carbohydrate (21). Carbohydrate compared with unsaturated fat or protein increases TGs (21, 22). However, knowledge is sparse on the effects of dietary macronutrients on atherogenic lipoprotein subfractions that are recently emerging as important risk factors for CVD.
In this setting we examined the effect of 3 healthy diets modeled after the Dietary Approaches to Stop Hypertension Trial (DASH) diet on plasma lipids and lipoproteins. The original carbohydrate-rich DASH diet lowers LDL cholesterol (23) and is considered the benchmark for US dietary recommendations. The 3 diets studied in the Optimal Macronutrient Intake Trial to Prevent Heart Disease (OmniHeart) differ from each other by their emphasis on either carbohydrate (Carb diet; modeled after the original DASH diet), unsaturated fat (Unsat diet), or protein (Prot diet). Because carbohydrate increases plasma TGs, we hypothesize that partial replacement of carbohydrate with either protein or unsaturated fat will reduce TG-rich lipoproteins typified by a high content of apo C-III.
SUBJECTS AND METHODS
The rationale and design of the OmniHeart trial as well as the main blood pressure and lipid results (21) were published previously. Briefly, the OmniHeart trial is an investigator-initiated study sponsored by the National Heart, Lung, and Blood Institute that used a randomized, 3-period crossover design to compare the effects of macronutrients on blood pressure and plasma lipids. Study diets were modeled on the successful DASH diet and emphasized either carbohydrate (Carb diet), unsaturated fats (Unsat diet), or nonmeat protein (Prot diet). The DASH diet was chosen because it is effective at reducing diastolic and systolic blood pressures. DASH was found to lower LDL cholesterol, but it also lowered HDL cholesterol and increased TGs, as many carbohydrate-rich diets were shown to do. In this study, we examine the effect of replacing some of the carbohydrate with unsaturated fat or protein. A detailed description of these 3 diets was published previously (24) and is summarized in Table 1.
TABLE 1.
Macronutrient composition of usual and assigned diets1
| OmniHeart diets |
||||
|---|---|---|---|---|
| Baseline usual diet2 | CARB | PROT | UNSAT | |
| Carbohydrate (% of energy) | 50 ± 93 | 58 | 48 | 48 |
| Fat (% of energy) | 31 ± 6 | 27 | 27 | 37 |
| Saturated | 11 ± 3 | 6 | 6 | 6 |
| Monounsaturated | 13 ± 3 | 13 | 13 | 21 |
| Polyunsaturated | 7 ± 2 | 8 | 8 | 10 |
| Protein (% of energy) | 17 ± 4 | 15 | 25 | 15 |
| Meat | 12 ± 4 | 5.5 | 9 | 5.5 |
| Plant and dairy | 5 ± 2 | 9.5 | 16 | 9.5 |
CARB, study diet that emphasized carbohydrate; PROT, study diet that emphasized nonmeat protein; UNSAT, study diet that emphasized unsaturated fat.
Assessed by Willett food-frequency questionnaire (n = 160).
x̄ ± SD (all such values).
Participant recruitment
Trial participants lived in the greater Boston, MA, and greater Baltimore, MD, areas and were adult men and women aged ≥30 y with systolic blood pressure 120−159 mm Hg, diastolic blood pressure < 100 mm Hg, fasting LDL cholesterol < 220 mg/dL, and TGs < 750 mg/dL. Other exclusion criteria were described previously (21). By design, we aimed to recruit 50% African Americans and 50% women. Eligibility was determined during screening visits, at which time a blood sample was taken for baseline measurement. The blood samples were immediately centrifuged to collect plasma, which was then divided into aliquots and stored at −80 °C pending analysis. Eligible participants then completed a 6-d run-in period during which time they were given the meals that were to be provided during the 3 diet periods. Subjects who failed to adhere to the protocol during the run-in period were excluded.
Controlled feeding
Each participant was randomly assigned 1 of 6 sequences of the 3 diets (Carb, Unsat, Prot). Each diet consisted of commonly available foods. The initial calorie content was determined for each participant, based on body size, sex, and physical activity level. Body weight was monitored daily, and calorie content of the diets was adjusted to maintain initial body weight. All meals, snacks, and beverages, except for discretionary calorie-free beverages, were provided to the participants. In addition, participants were requested to maintain their usual intake of alcoholic beverages, not to exceed 2 drinks/d. Participants were instructed to eat only the food provided and to maintain their usual levels of physical activity. Adherence was monitored through daily diet diaries and at their weekday visits to the study center. At the end of the fourth and sixth weeks of each diet period, blood was drawn, centrifuged, divided into aliquots, and stored at −80 °C pending laboratory analysis. Participants then ate their usual free-living diet for a minimum of 2 wk before beginning the next diet period. Controlled feeding took place from April 2003 to June 2005.
Laboratory measurements
All 162 participants who successfully completed ≥2 of the 3 diet periods were included in the laboratory analysis. Each participant provided 4 samples for analysis, one at baseline and one after each of the three 6-wk diet periods. Blood samples were collected in tubes containing EDTA. The study was conducted from April 2003 to June 2005. Laboratory analysis began March 2004 and was completed August 2005. Samples were submitted to the laboratory in batches, and the batches were analyzed in the order received. Therefore, the longest possible period of storage was 12 mo, with most samples stored ≤10 mo. The 4 samples were analyzed in the same batch in random order to reduce analytic variation. Analysis batches consisted of 5 or 9 participants, depending on the week, and batches were completed within 5 d. All laboratory staff members were blinded to the diet sequences of the participants.
Immunoaffinity chromatography
Samples were removed from cryogenic storage and thawed in the dark at room temperature for 30 min. Samples were filtered, and 700 μL filtered plasma was loaded into 20 mL Econo-Pac columns (Bio-Rad Laboratories, Hercules, CA) packed with anti–apo C-III resin (polyclonal goat anti–human apo C-III antibody bound to Sepharose 4B Resin; Academy Biomedical Company Inc, Houston, TX). Samples and resin were incubated for 16 h at 4 °C with mixing. The unbound fraction was eluted from the column by gravity followed by washes with phosphate-buffered saline. The bound fraction was then eluted from the columns with 3 mol/L sodium thiocyanate in phosphate-buffered saline and was immediately desalted with the use of PD-10 columns (GE Healthcare, Little Chalfont, United Kingdom).
The immunoaffinity columns consisted of 2.5 mL anti–apo C-III resin prepared with the use of polyclonal goat anti–human apo C-III antibody bound to Sepharose 4B Resin at a minimum concentration of 5 mg antibody/mL resin. The highest concentration of plasma apo C-III found in this study was ≈61 mg/dL (0.61 mg/mL). At a load volume of 0.7 mL, this is a maximum load of 0.4 mg, which is below the minimum theoretical capacity of 0.6 mg apo C-III based on column specifications. All columns were tested to ensure efficiency of >95% before the start of laboratory analysis and midway through the analysis period by application of a quality control plasma sample to each column and measurement of apo C-III concentration of both the retained and unretained fractions. In addition, a separate quality control sample was included in each sample batch that was randomly assigned to a different column each week. No column failures were found during this study.
Ultracentrifugation
The bound and unbound fractions were ultracentrifuged to separate particles by density. VLDL was isolated by overlaying 700 μL of sample with 300 μL of potassium bromide [with density (d) = 1.006 g/mL] aqueous solution (Sigma-Aldrich, St. Louis, MO) and spinning for 16 h at 15 °C and 25 000 rpm in the outer-most row of a Beckman 25-Ti rotor with a Beckman L8−70 M ultracentrifuge (Beckman Coulter, Inc, Fullerton, CA). The top 200 ± 10 μL from each tube was collected by careful aspiration and stored at 4 °C briefly, pending same-day analysis of lipids and apolipoproteins while the next ultracentrifugation step for LDL was prepared. LDL was isolated by overlaying the plasma remaining after VLDL aspiration with 34% potassium bromide solution to produce a final density of 1.063 g/mL and spinning for 24 h under the same conditions as for VLDL isolation. The top 300 ± 10 μL from each was collected by aspiration. Three density fractions of plasma were thus isolated: <1.006 g/mL (VLDL), 1.006 g/mL to <1.063 g/mL (LDL), and > 1.063 g/mL (very dense LDL, HDL, plasma proteins). The products of the immunoaffinity chromatography followed by density fractionation by ultracentrifugation were VLDL without apo C-III, VLDL with apo C-III, LDL without apo C-III, LDL with apo C-III, d > 1.063 g/mL lipoproteins without apo C-III, and d > 1.063 g/mL lipoproteins with apo C-III.
Determination of lipids and apolipoproteins
Sandwich enzyme-linked immunoabsorbent assay (ELISA) procedures with the use of affinity-purified antibodies (Academy Biomedical Company Inc) were performed to determine the concentrations of apo B, apo C-III, and apolipoprotein E (apo E) in whole plasma and the lipoprotein fractions. TGs and cholesterol were determined enzymatically (Thermo Scientific, Waltham, MA). Liquid transfer for 96-well plate loading and ELISA dilutions were handled robotically with a Multiprobe II (Perkin-Elmer, Waltham, MA) to minimize pipetting error. Both ELISA and lipid plates were read with a BioTek ELx808iu 96-well plate reader controlled by KCJUNIOR software (BioTek, Winooski, VT). All assays were completed in triplicate, and any sample with an intraassay CV > 15% was repeated. Final data were exported to Microsoft EXCEL (Microsoft, Reman, WA) for analysis and database management.
Ethics
The study protocol was approved by the Institutional Review Boards at all affiliated institutions (Johns Hopkins University, Brigham & Women's Hospital, and the Harvard School of Public Health).
Statistics
The primary outcome was apo B concentration in whole plasma and in the lipoprotein subfractions. Cholesterol, TG, apo C-III, and apo E concentrations were examined as secondary outcomes. The main comparisons in this study were made among the Carb, Unsat, and Prot diets, in particular the Prot-Carb diets and the Unsat-Carb diets; the Unsat-Prot diet was of secondary interest and was mathematically contained in the other 2 differences. Paired t tests of the between-diet differences were used to assess the differential effects of the diets. Secondarily, we examined the change from baseline elicited by each diet with paired t tests of the difference between baseline and postdiet samples. Analyses were performed with the use of SAS version 9.1 (SAS Institute Inc, Cary, NC). The t tests were all 2-sided, and statistical significance was defined as P ≤ 0.05. We did not adjust P values for multiple comparisons because there is no consensus for adjustment when many of the outcome variables (lipoprotein subtypes) examined are highly interrelated with the others. Our analysis produced patterns of significance that corroborate one another, which reduces the risk of reporting significance of false positives because of the sheer number of tests performed. Furthermore, the “proc mixed” procedure, which performs a global test reducing the risk of type I error, was performed to confirm the findings of the paired t tests. For a study such as this with many subsamples per participant, there are randomly occurring missing values, stemming from limitations in laboratory technology, eg, detection limits, lack of sufficient sample, or out-of-range value. Imputation of these missing data points must be handled differently for each different reason for the missingness. Choosing a single imputation strategy for all missing data introduces noise. Therefore, for this analysis no missing data were imputed. Instead, the t tests for each outcome are performed with the use of subsets of the data that exclude any subjects' missing data for that particular outcome. Although this reduces power compared with an analysis of all participants with imputation, it avoids regression to the null because of background noise.
RESULTS
Participants
A total of 191 participants successfully completed the run-in period and were randomly assigned to 1 of the 6 diet sequences. Of them, 162 finished at least 2 of the 3 diet periods and were eligible for inclusion in the analysis. Drop-out occurrence was distributed evenly across the 3 diets with no one diet proving more difficult to adhere to than the others. Baseline characteristics of participants assigned to the 6 diet sequences did not differ. Overall, the population was 55% African American and 44% women, with 74% of women being postmenopausal. Mean (±SD) age was 53 ± 10 y and mean body mass index (in kg/m2) was 30.4 ± 6.1. Plasma lipids and lipoproteins appeared consistent for a group of this age and obesity for TGs at 100 ± 67 mg/dL, cholesterol at 206 ± 44 mg/dL, apo B at 84 ± 26 mg/dL, apo C-III at 12.7 ± 7.9 mg/dL, and apo E at 7.37 ± 2.76 mg/dL. Adherence to the feeding protocol was high with participants reporting that on >95% of person-days all study foods were consumed and no nonstudy foods were added. Mean body weight decreased from baseline by 1 kg, and this change occurred equally across all 3 diets.
Primary outcome: apolipoprotein B
Total plasma apo B was not affected differentially by the 3 diets (Table 2). Compared with the Carb diet, the Prot diet reduced VLDL without apo C-III by 17%, trended toward a 16% reduction in VLDL with apo C-III, and reduced LDL with apo C-III by 16% (Table 3; Figure 1). No significant differences were observed in subfraction apo B when the Unsat diet was compared with the Carb or Prot diets, although the Unsat diet tended to produce concentrations intermediate between the Carb and Prot diets. Compared with baseline, all 3 diets reduced plasma total apo B by 6−10% (P < 0.05) (Table 2). The reduction in total apo B was mostly due to a reduction in LDL without apo C-III (8−10%, P < 0.01) (Table 4). Compared with baseline, the Prot diet reduced very dense LDL (d > 1.063 g/mL) without apo C-III by 14% and total LDL (including the very dense LDL) with apo C-III by 12%. The Prot diet did not change the concentration of VLDL with apo C-III compared with baseline, whereas it was significantly elevated with the Carb and Unsat diets (34% and 25%, respectively).
TABLE 2.
Baseline concentrations of whole plasma lipids and lipoproteins, changes from baseline by diet, and diet comparisons1
| Change from baseline by diet |
Diet comparisons |
||||||||||||
|---|---|---|---|---|---|---|---|---|---|---|---|---|---|
| Baseline Value | CARB |
PROT |
UNSAT |
UNSAT to CARB |
PROT to CARB |
UNSAT to PROT |
|||||||
| Value | P2 | Value | P2 | Value | P2 | Value | P2 | Value | P2 | Value | P2 | ||
| mg/dL | mg/dL | mg/dL | mg/dL | mg/dL | mg/dL | ||||||||
| Cholesterol (mg/dL) (n = 111) | 213 ± 463 | −17 ± 29 | < 0.01 | −25 ± 30 | < 0.01 | −22 ± 30 | < 0.01 | −4.6 ± 26 | 0.06 | −7.7 ± 24 | < 0.01 | 3.2 ± 23 | 0.1 |
| Triacylglycerols (mg/dL) (n = 107) | 106 ± 74 | −5.5 ± 50 | 0.3 | −15 ± 51 | < 0.01 | −7.9 ± 46 | 0.08 | −2.4 ± 45 | 0.6 | −9.5 ± 42 | 0.02 | 7.1 ± 36 | 0.05 |
| Apo B (mg/dL) (n = 88) | 83 ± 28 | −4.9 ± 23 | 0.05 | −8.2 ± 22 | < 0.01 | −6.1 ± 21 | < 0.01 | −1.2 ± 21 | 0.6 | −3.3 ± 21 | 0.1 | 2.1 ± 17 | 0.3 |
| Apo C-III (mg/dL) (n = 115) | 13.8 ± 8.2 | −0.67 ± 7.2 | 0.3 | −1.3 ± 5.3 | 0.01 | −1.4 ± 6.7 | 0.03 | −0.71 ± 5.8 | 0.2 | −0.59 ± 5.6 | 0.3 | −0.12 ± 4.5 | 0.8 |
| Apo E (mg/dL) (n = 140) | 7.4 ± 2.8 | −0.62 ± 1.9 | < 0.01 | −0.86 ± 2.3 | < 0.01 | −0.88 ± 2.2 | < 0.01 | −0.26 ± 1.9 | 0.1 | −0.23 ± 1.9 | 0.2 | −0.02 ± 1.3 | 0.8 |
CARB, study diet that emphasized carbohydrate; PROT, study diet that emphasized nonmeat protein; UNSAT, study diet that emphasized unsaturated fat; apo B, apolipoprotein B; apo C-III, apolipoprotein C-III, apo E, apolipoprotein E.
Determined by paired Student's t test with significance defined as P ≤ 0.05.
x̄ + SD (all such values).
TABLE 3.
Differences between diets in plasma lipoprotein subfractions1
| UNSAT to CARB |
PROT to CARB |
UNSAT to PROT |
||||
|---|---|---|---|---|---|---|
| Value | P2 | Value | P2 | Value | P2 | |
| mg/dL | mg/dL | mg/dL | ||||
| Lipoproteins with apo C-III | ||||||
| VLDL | ||||||
| Cholesterol (n = 111) | 0.06 ± 5.43 | 0.9 | −0.16 ± 4.6 | 0.7 | 0.21 ± 4.0 | 0.6 |
| Triacylglycerols (n = 107) | 0.68 ± 15 | 0.6 | −2.0 ± 12 | 0.05 | 2.7 ± 13 | 0.02 |
| Apo B (n = 88) | −0.09 ± 0.98 | 0.4 | −0.20 ± 1.0 | 0.07 | 0.11 ± 0.86 | 0.2 |
| Apo C-III (n = 118) | −0.11 ± 0.76 | 0.1 | −0.17 ± 0.8 | 0.03 | 0.06 ± 0.84 | 0.5 |
| Apo E (n = 140) | −0.02 ± 0.33 | 0.5 | −0.03 ± 0.30 | 0.2 | 0.01 ± 0.37 | 0.7 |
| LDL | ||||||
| Cholesterol (n = 111) | −0.78 ± 5.7 | 0.2 | −0.89 ± 6.5 | 0.2 | 0.11 ± 5.0 | 0.8 |
| Triacylglycerols (n = 107) | −0.32 ± 5.1 | 0.5 | −0.61 ± 4.9 | 0.2 | 0.29 ± 4.1 | 0.4 |
| Apo B4 (n = 88) | −0.55 ± 5.0 | 0.3 | 1.2 ± 5.6 | 0.04 | 0.69 ± 3.8 | 0.1 |
| Apo C-III (n = 118) | −0.1 ± 0.69 | 0.1 | −0.11 ± 0.65 | 0.07 | 0.01 ± 0.69 | 0.9 |
| Apo E (n = 140) | −0.002 ± 0.18 | 0.9 | 0.002 ± 0.20 | 0.9 | −0.004 ± 0.19 | 0.8 |
| Very dense LDL (d > 1.063 g/mL) | ||||||
| Apo B (n = 88) | −0.06 ± 0.7 | 0.5 | −0.12 ± 0.8 | 0.2 | 0.06 ± 0.4 | 0.2 |
| Lipoproteins without apo C-III | ||||||
| VLDL | ||||||
| Cholesterol (n = 111) | −0.40 ± 8.1 | 0.6 | −1.4 ± 9.4 | 0.1 | 0.96 ± 7.2 | 0.2 |
| Triacylglycerols (n = 107) | −2.2 ± 26 | 0.3 | −5.7 ± 32 | 0.05 | 3.4 ± 23 | 0.1 |
| Apo B (n = 88) | −0.30 ± 2.1 | 0.2 | −0.49 ± 2.2 | 0.03 | 0.2 ± 1.6 | 0.3 |
| Apo E (n = 140) | −0.02 ± 0.17 | 0.1 | −0.01 ± 0.15 | 0.6 | −0.02 ± 0.16 | 0.2 |
| LDL | ||||||
| Cholesterol (n = 111) | −3.0 ± 20 | 0.1 | −5.2 ± 17 | < 0.01 | 2.2 ± 18 | 0.2 |
| Triacylglycerols (n = 107) | −0.56 ± 14 | 0.7 | −0.73 ± 9.4 | 0.4 | 0.17 ± 11 | 0.9 |
| Apo B4 (n = 88) | 0.26 ± 17 | 0.9 | −1.4 ± 18 | 0.5 | 1.1 ± 15 | 0.5 |
| Apo E (n = 140) | −0.02 ± 0.18 | 0.2 | −0.01 ± 0.15 | 0.3 | −0.01 ± 0.16 | 0.5 |
| Very dense LDL (d > 1.063 g/mL) | ||||||
| Apo B (n = 88) | −0.63 ± 4.0 | 0.1 | −0.85 ± 4.3 | 0.07 | 0.22 ± 3.3 | 0.5 |
UNSAT, study diet that emphasized unsaturated fat; CARB, study diet that emphasized carbohydrate; PROT, study diet that emphasized nonmeat protein; apo B, apolipoprotein B, apo C-III, apolipoprotein C-III, apo E, apolipoprotein E; d, density. Baseline values are shown in Table 4.
Determined by paired Student's t test with significance defined as P ≤ 0.05.
x̄ ± SD (all such values).
Includes apo B found at d > 1.063 g/mL.
FIGURE 1.
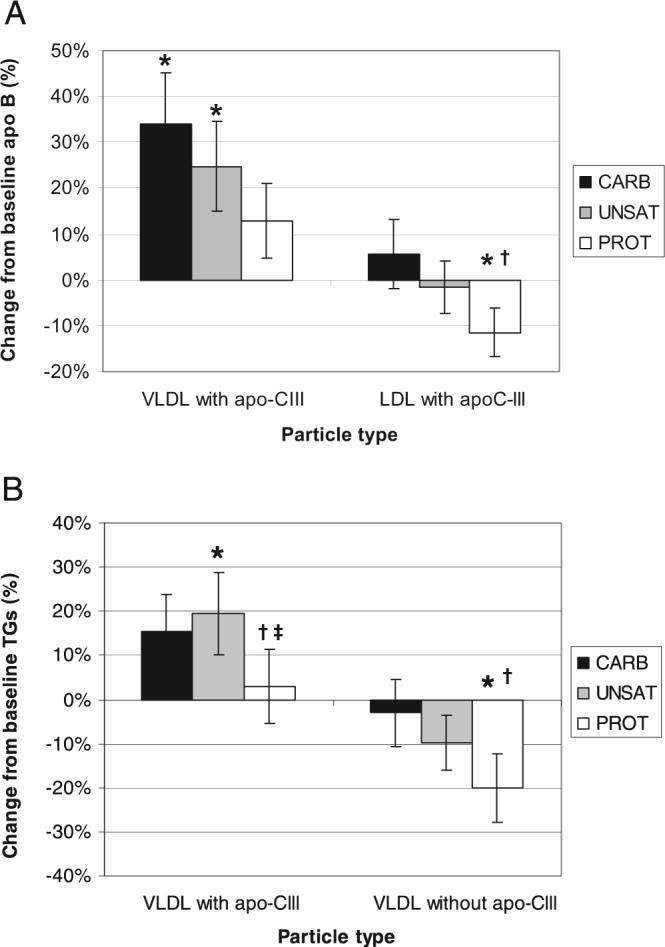
Dietary effects on VLDL and LDL with or without apolipoprotein C-III (apo C-III). Percentage of change (mean ± SEM) in apolipoprotein B (apo B; n = 88) in VLDL and LDL with apo C-III and in triglycerides (TGs) (n = 107) in VLDL with and without apo C-III. *Significantly different from baseline measurements, P < 0.05 (paired Student's t test). †Significantly different from the study diet that emphasized carbohydrate (CARB). ‡Significantly different from the study diet that emphasized unsaturated fat (UNSAT). PROT indicates the study diet that emphasized nonmeat protein.
TABLE 4.
Baseline concentrations of plasma lipoprotein subfractions and changes from baseline by diet1
| Change from baseline by diet |
|||||||
|---|---|---|---|---|---|---|---|
| CARB |
PROT |
UNSAT |
|||||
| Baseline | Value | P2 | Value | P2 | Value | P2 | |
| mg/dL | mg/dL | mg/dL | mg/dL | ||||
| Lipoproteins with apo C-III | |||||||
| VLDL | |||||||
| Cholesterol (n = 111) | 4.4 ± 4.23 | 0.84 ± 4.6 | 0.06 | 0.68 ± 3.7 | 0.06 | 0.89 ± 4.3 | 0.03 |
| Triacylglycerols (n = 107) | 17 ± 16 | 2.5 ± 16 | 0.08 | 0.50 ± 15 | 0.7 | 3.2 ± 17 | 0.04 |
| Apo B (n = 88) | 0.94 ± 0.87 | 0.32 ± 1.09 | < 0.01 | 0.12 ± 0.79 | 0.2 | 0.23 ± 0.96 | 0.03 |
| Apo C-III (n = 118) | 1.3 ± 1.1 | 0.31 ± 0.90 | < 0.01 | 0.14 ± 0.87 | 0.1 | 0.20 ± 0.85 | 0.02 |
| Apo E (n = 140) | 0.31 ± 0.27 | 0.13 ± 0.35 | < 0.01 | 0.10 ± 0.39 | < 0.01 | 0.11 ± 0.36 | < 0.01 |
| LDL | |||||||
| Cholesterol (n = 111) | 12 ± 10 | −0.53 ± 5.9 | 0.4 | −1.4 ± 6.5 | 0.02 | −1.3 ± 6.2 | 0.03 |
| Triacylglycerols (n = 107) | 10 ± 7.6 | −0.45 ± 6.7 | 0.5 | −1.06 ± 6.1 | 0.05 | −0.77 ± 5.5 | 0.1 |
| Apo B4 (n = 88) | 7.7 ± 6.3 | 0.36 ± 6.1 | 0.6 | −0.88 ± 4.3 | 0.06 | −0.19 ± 4.4 | 0.7 |
| Apo C-III (n = 118) | 1.7 ± 1.1 | 0.06 ± 0.63 | 0.4 | −0.06 ± 0.61 | 0.3 | −0.05 ± 0.73 | 0.5 |
| Apo E (n = 140) | 0.39 ± 0.29 | −0.001 ± 0.18 | 0.9 | 0.003 ± 0.18 | 0.9 | 0.001 ± 0.16 | 0.9 |
| Very dense LDL (d > 1.063 g/mL) | |||||||
| Apo B (n = 88) | 0.98 ± 0.89 | −0.02 ± 0.99 | 0.9 | −0.13 ± 0.78 | 0.1 | −0.07 ± 0.67 | 0.3 |
| Lipoproteins without apo C-III | |||||||
| VLDL | |||||||
| Cholesterol (n = 111) | 11 ± 9 | −0.62 ± 8.2 | 0.4 | −2.0 ± 8.9 | 0.02 | −1.0 ± 8.3 | 0.2 |
| Triacylglycerols (n = 107) | 33 ± 41 | −1.0 ± 29 | 0.7 | −6.7 ± 29 | 0.01 | −3.3 ± 24 | 0.1 |
| Apo B (n = 88) | 2.7 ± 2.2 | 0.20 ± 2.2 | 0.4 | −0.30 ± 1.6 | 0.8 | −0.10 ± 1.5 | 0.5 |
| Apo E (n = 140) | 0.21 ± 0.22 | 0.006 ± 0.22 | 0.8 | 0.000 ± 0.20 | 0.9 | −0.02 ± 0.15 | 0.2 |
| LDL | |||||||
| Cholesterol (n = 111) | 119 ± 36 | −11 ± 22 | < 0.01 | −16 ± 23 | < 0.01 | −14 ± 25 | < 0.01 |
| Triacylglycerols (n = 107) | 29 ± 16 | −4.2 ± 17 | < 0.01 | −5.0 ± 15 | < 0.01 | −4.8 ± 17 | < 0.01 |
| Apo B4 (n = 88) | 71 ± 23 | −5.7 ± 20 | < 0.01 | −7.1 ± 19 | < 0.01 | −6.0 ± 17 | < 0.01 |
| Apo E (n = 140) | 0.40 ± 0.24 | −0.02 ± 0.16 | 0.09 | −0.04 ± 0.16 | < 0.01 | −0.05 ± 0.16 | < 0.01 |
| Very dense LDL (d > 1.063 g/mL) | |||||||
| Apo B (n = 88) | 5.7 ± 5.0 | 0.03 ± 4.5 | 0.9 | −0.82 ± 2.8 | < 0.01 | −0.60 ± 3.9 | −0.2 |
CARB, study diet that emphasized carbohydrate; PROT, study diet that emphasized nonmeat protein; UNSAT, study diet that emphasized unsaturated fat; apo C-III, apolipoprotein C-III; apo B, apolipoprotein B, apo E, apolipoprotein E; d, density.
Determined by paired Student's t test with significance defined as P ≤ 0.05.
x̄ ± SD (all such values).
Includes apo B found at d > 1.063 g/mL.
Secondary outcomes
Cholesterol and TGs
Compared with the Carb diet, the Prot diet reduced total cholesterol by 4% (Table 2) and cholesterol in LDL without apo C-III by 5% (Table 3). The Prot diet reduced total TGs (9%) and TGs in VLDL with (12%) and without (18%) apo C-III compared with the Carb diet (Figure 1). Compared with the Unsat diet, the Prot diet reduced total TGs by 8% and TGs in VLDL with apo C-III by 16%. Compared with baseline, all 3 diets reduced plasma cholesterol by 8−12% (Table 2). The Prot diet reduced total plasma TGs (14%), and the Unsat diet trended toward reduction of total plasma TGs by 7%, although it was of borderline significance. All 3 diets reduced cholesterol (9−14%) and TGs (14−17%) in LDL without apo C-III (Table 4). Only the Prot diet reduced cholesterol and TG concentrations of VLDL without apo C-III (18% and 20%, respectively). The Unsat diet increased both cholesterol and TGs by 20% in VLDL with apo C-III, and a borderline significant trend was observed toward an increase of cholesterol in VLDL with apo C-III by the Carb (19%) and Prot (15%) diets. TG concentration in LDL with apo C-III was reduced 10% by the Prot diet, and cholesterol concentration was reduced 10−11% by both the Unsat and Prot diets. Lipoprotein lipid composition as determined by molecular ratios of cholesterol and TGs to apo B did not significantly change from baseline or among the diets.
Apolipoproteins C-III and E
Compared with the Carb diet, the Prot diet reduced the concentration of apo C-III in VLDL by 10% (Table 3). Compared with baseline, the Prot and Unsat diets reduced total plasma apo C-III (9−10%) (Table 2). All 3 diets increased apo C-III in VLDL (13−25%). All 3 diets decreased total plasma apo E (8−12%) but increased apo E in VLDL with apo C-III (32−43%) compared with baseline. The Prot and Unsat diets reduced apo E in LDL without apo C-III (9% and 11%, respectively) compared with baseline. Analysis of molecular ratios shows that compared with baseline all 3 diets increased the number of molecules of apo C-III contained in each VLDL particle less than they increased the number of molecules of apo E (Table 4, Figure 2), reducing the ratio of apo C-III to apo E. This compositional change in the particles did not differ among the diets.
FIGURE 2.
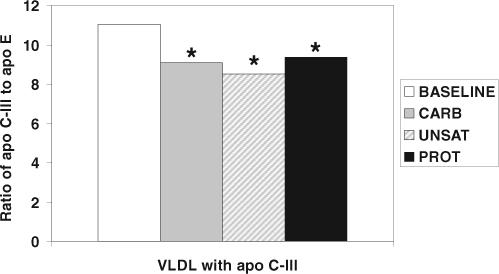
Dietary effects on the ratio of apolipoprotein C-III (apo C-III) to apolipoprotein E (apo E) in apo C-III–containing VLDL. All diets decrease the ratio of apo C-III to apo E in VLDL compared with baseline. *Significantly different from baseline measurements, P < 0.05 (paired Student's t test; n = 147). CARB indicates the study diet that emphasized carbohydrate; UNSAT, the study diet that emphasized unsaturated fats; PROT, the study diet that emphasized nonmeat protein.
DISCUSSION
The reduction by the Prot diet compared with the Carb diet of apo B in VLDL with apo C-III, apo C-III concentration in VLDL, TGs in VLDL with apo C-III, and overall plasma TGs supports our hypothesis that replacement of carbohydrate will reduce atherogenic TG-rich lipoproteins typified by the content of apo C-III. The Unsat diet compared with the Carb diet trended toward similar reductions, but they were not as large and were not statistically significant. It was hypothesized that changes in blood lipids and lipoproteins caused by substitution of carbohydrate by unsaturated fat are actually due to carbohydrate reduction and that protein has an independent effect on plasma lipids which is additive to the effect of carbohydrate reduction (19, 25). This may explain the qualitatively similar but quantitatively different effects that the Prot and Unsat diets elicited compared with the Carb diet.
Plasma total apo B is a risk factor for CVD, superior to cholesterol concentration (6–8). The Cholesterol and Recurrent Events trial showed that apo B concentration of VLDL is a significant predictor of recurrent coronary events (9) and that apo B concentration of LDL with apo C-III strongly predicts coronary events in diabetic patients independently of other lipids (11). The Prot diet resulted in a more favorable apo B profile than did the Carb diet through the reduction of apo B in VLDL with and without apo C-III and in LDL with apo C-III. In addition, results from several studies indicate that apo C-III concentration is a risk factor for CVD (9, 11, 26, 27). Apo C-III concentration was reduced in VLDL by the Prot diet compared with the Carb diet, indicating that the Prot diet produces a less atherogenic overall lipoprotein profile than does the Carb diet. Plasma TGs and apo B are well-established risk factors for CVD (3–8, 28–30). Therefore, the Prot diet compared with the Carb diet results in a more favorable apo B lipoprotein lipid profile in many ways. Generally, the effects of the Unsat diet were in a similar direction to the Prot diet but less strong.
Dietary changes from baseline
Baseline samples were taken from participants after eating their own free-living diets, which were on average higher in saturated fat and cholesterol than the DASH-based OmniHeart diets. Analysis of the overall changes that each diet elicits from baseline approximates the effect that adherence to these diet patterns will have on a general population of free-living persons. Compared with baseline, all 3 diets lowered whole plasma apo B, primarily through the reduction ofapoBinLDLwithoutapoC-III,themajorapoBparticletype,and the Prot diet reduced LDL particles with apo C-III. Diet studies have found that high-carbohydrate diets increase the concentration of small, dense LDL (31). In our study the Carb diet increased the most-dense LDL compared with baseline, but the change was not significant. However, the Prot diet reduced small, dense (d < 1.063 g/mL) LDL compared with baseline. The Prot diet also did not significantly increase apo B in VLDL as the Carb and Unsat diets did. In addition, compared with baseline all 3 diets reduced LDL cholesterol, and the Prot diet reduced plasma TGs. Therefore, all 3 diets elicited changes from baseline that are protective against CVD with the Prot diet resulting in the most favorable apo B and lipid profiles. The 3 diets increased the molecular ratio of apo E to apo C-III in VLDL with apo C-III by 18−30%, indicating apo E enrichment after the 3 study diets. Recently, Zheng et al (10) showed that VLDL and intermediate-density lipoprotein (IDL) with both apo C-III and apo E have higher rates of clearance from plasma than do VLDL and IDL with apo C-III but not apo E, lessening formation of LDL, especially the most atherogenic form with apo C-III. The clearance rate of apo C-III–containing VLDL and IDL is influenced by the ratio of apo C-III to apo E, a lower ratio (or more apo E relative to apo C-III) producing faster clearance. Thus, the 3 DASH-type diets improved the ratio of apo C-III to apo E, a marker for metabolism of VLDL and IDL favorable to reducing CVD risk. Molecular ratios of cholesterol and TGs to apo B did not show significant changes from baseline or differences between the diets, indicating that the diets alter concentrations of lipoprotein subtypes but not their lipid composition.
Strengths
The crossover design of this study allows for a parsimonious analysis with low risk of confounding. The sample size was relatively large, and the participants were demographically heterogeneous, which strengthens the application of the results to the general US population. We oversampled African Americans, who bear a disproportionate burden of CVD. Risk of bias was low because of similarly high rates of adherence to and completeness of follow-up after all 3 of the diets. Changes in lipids and lipoproteins can be attributed to dietary factors because other important factors that might elicit these changes were successfully controlled (ie, weight, exercise, and alcohol consumption patterns). Finally, the recommendations stemming from this study are easily adopted by the general public because the foods that comprise the diets are commonlyavailableandmoderatelypricedthroughouttheUnitedStates (24).
Limitations
The relatively brief duration of each diet period does not allow for assessment of permanence of lipoprotein changes. However, longer-term studies have shown that changes in blood lipids will remain as long as the intervention is continued. For the conventional lipid risk factors, plasma total cholesterol and TGs, HDL cholesterol, and LDL cholesterol, the 4-wk results were similar to the 6-wk results, suggesting that a new baseline was reached. The controlled diet design makes it difficult to gauge the success of long-term adherence to each diet when the diet is chosen by people, essential to continued CVD risk reduction. This study did not address dietary effects on HDL subpopulations. The Unsat diet increased HDL cholesterol compared with the Carb and Prot diets. The Prot diet produced the lowest HDL-cholesterol concentration.
Conclusion
Although all 3 diets resulted in changes from baseline in lipoproteins that should reduce CVD risk, the Prot diet produced the most favorable apo B–containing lipoprotein profile and the lowest plasma total apo B concentration. It also reduced TGs compared with both the Carb and Unsat diets. In fact, the further reduction by the Prot diet compared with the Unsat diet suggests a TG-lowering effect of protein beyond just replacement of carbohydrate. More importantly, the Prot diet was the most effective at reducing atherogenic apo C-III–containing particles, especially the concentration of LDL with apo C-III. We can estimate the effect of this on CVD by fitting the mean concentration of apo B in apo C-III–containing LDL at baseline and after the Prot diet into a relative risk curve from the Cholesterol and Recurrent Events trial (11). The reduction in LDL with apo C-III after the Prot diet corresponds to a 21% reduced risk of recurrent coronary events in persons with diabetes. This projection must be confirmed directly in other populations. Furthermore, this projection does not take into account the possible effects on CVD of the HDL cholesterol–lowering effect of the Prot diet and the HDL-raising effect of the Unsat diet, as found in OmniHeart (21). Nonetheless, the results that the Prot diet elicits the least atherogenic apo B lipoprotein profile combined with the recent report of the superiority of the Prot diet over the Carb diet in reducing blood pressure (21) makes a strong case for choosing protein rather than carbohydrate as a replacement for saturated fat to improve cardiovascular health.
Acknowledgments
The author's responsibilities were as follows—JDF: had full access to all study data and takes responsibility for the integrity of the data and the accuracy of the data analysis; LJA, FMS, VJC, and ERM: study concept and design; JDF, FMS, LJA, VJC, and ERM: acquisition of data; JDF, FMS, VJC, and NL: analyzed and interpreted data; JDF, FMS, and HC: drafted the manuscript; JDF, FMS, HC, LJA, VJC, NL, and ERM: critically revised the manuscript for important intellectual content; JDF, FMS, VJC, NL, and HC: provided statistical analysis; LJA and VJC: obtained funding; JDF, FMS, LJA, VJC, and NL: provided administrative, technical, or material support; JDF, FMS, LJA, VJC, and EFM: supervised the study. None of the authors had a personal or financial conflict of interest.
Footnotes
Supported by grants from the National Institutes of Health (grants HL67098, DK63214, HL68712, and RR02635). Food was generously supplied by The Almond Board, International Tree Nut Council, Olivio Premium Products Inc, and The Peanut Institute.
REFERENCES
- 1.Alaupovic P. Significance of apolipoproteins for structure, function, and classification of plasma lipoproteins. Methods Enzymol. 1996;263:32–60. doi: 10.1016/s0076-6879(96)63004-3. [DOI] [PubMed] [Google Scholar]
- 2.Blankenhorn DH, Nessim SA, Johnson RL, Sanmarco ME, Azen SP, Cashin-Hemphill L. Beneficial effects of combined colestipol-niacin therapy on coronary atherosclerosis and coronary venous bypass grafts. JAMA. 1987;257:3233–40. [PubMed] [Google Scholar]
- 3.Williams K, Sniderman AD, Sattar N, D'Agostino R, Jr, Wagenknecht LE, Haffner SM. Comparison of the associations of apolipoprotein B and low-density lipoprotein cholesterol with other cardiovascular risk factors in the Insulin Resistance Atherosclerosis Study (IRAS). Circulation. 2003;108:2312–6. doi: 10.1161/01.CIR.0000097113.11419.9E. [DOI] [PubMed] [Google Scholar]
- 4.Sniderman AD, Furberg CD, Keech A, et al. Apolipoproteins versus lipids as indices of coronary risk and as targets for statin treatment. Lancet. 2003;361:777–80. doi: 10.1016/s0140-6736(03)12663-3. [DOI] [PubMed] [Google Scholar]
- 5.Sniderman AD, Scantlebury T, Cianflone K. Hypertriglyceridemic hyperapob: the unappreciated atherogenic dyslipoproteinemia in type 2 diabetes mellitus. Ann Intern Med. 2001;135:447–59. doi: 10.7326/0003-4819-135-6-200109180-00014. [DOI] [PubMed] [Google Scholar]
- 6.Pischon T, Girman CJ, Sacks FM, Rifai N, Stampfer MJ, Rimm EB. Non-high-density lipoprotein cholesterol and apolipoprotein B in the prediction of coronary heart disease in men. Circulation. 2005;112:3375–83. doi: 10.1161/CIRCULATIONAHA.104.532499. [DOI] [PubMed] [Google Scholar]
- 7.Lanas F, Avezum A, Bautista LE, et al. Risk factors for acute myocardial infarction in Latin America: the INTERHEART Latin American study. Circulation. 2007;115:1067–74. doi: 10.1161/CIRCULATIONAHA.106.633552. [DOI] [PubMed] [Google Scholar]
- 8.Yusuf S, Hawken S, Ounpuu S, et al. Effect of potentially modifiable risk factors associated with myocardial infarction in 52 countries (the INTERHEART study): case-control study. Lancet. 2004;364:937–52. doi: 10.1016/S0140-6736(04)17018-9. [DOI] [PubMed] [Google Scholar]
- 9.Sacks FM, Alaupovic P, Moye LA, et al. VLDL, apolipoproteins B, CIII, and E, and risk of recurrent coronary events in the Cholesterol and Recurrent Events (CARE) trial. Circulation. 2000;102:1886–92. doi: 10.1161/01.cir.102.16.1886. [DOI] [PubMed] [Google Scholar]
- 10.Zheng C, Khoo C, Ikewaki K, Sacks FM. Rapid turnover of apolipoprotein C-III-containing triglyceride rich lipoproteins contributing to the formation of LDL subfractions. J Lipid Res. 2007;48:1190–203. doi: 10.1194/jlr.P600011-JLR200. [DOI] [PubMed] [Google Scholar]
- 11.Lee SJ, Campos H, Moye LA, Sacks FM. LDL containing apolipoprotein CIII is an independent risk factor for coronary events in diabetic patients. Arterioscler Thromb Vasc Biol. 2003;23:853–8. doi: 10.1161/01.ATV.0000066131.01313.EB. [DOI] [PubMed] [Google Scholar]
- 12.Kawakami A, Aikawa M, Alcaide P, Luscinskas FW, Libby P, Sacks FM. Apolipoprotein CIII induces expression of vascular cell adhesion molecule-1 in vascular endothelial cells and increases adhesion of monocytic cells. Circulation. 2006;114:681–7. doi: 10.1161/CIRCULATIONAHA.106.622514. [DOI] [PubMed] [Google Scholar]
- 13.Kawakami A, Aikawa M, Libby P, Alcaide P, Luscinskas FW, Sacks FM. Apolipoprotein CIII in apolipoprotein B lipoproteins enhances the adhesion of human monocytic cells to endothelial cells. Circulation. 2006;113:691–700. doi: 10.1161/CIRCULATIONAHA.105.591743. [DOI] [PubMed] [Google Scholar]
- 14.Kawakami A, Aikawa M, Nitta N, Yoshida M, Libby P, Sacks FM. Apolipoprotein CIII-induced THP-1 cell adhesion to endothelial cells involves pertussis toxin-sensitive G protein- and protein kinase C alpha-mediated nuclear factor-kappaB activation. Arterioscler Thromb Vasc Biol. 2007;27:219–25. doi: 10.1161/01.ATV.0000249620.68705.0d. [DOI] [PubMed] [Google Scholar]
- 15.Malmros H, Wigand G. The effect on serum-cholesterol of diets containing different fats. Lancet. 1957;273:1–7. doi: 10.1016/s0140-6736(57)90568-8. [DOI] [PubMed] [Google Scholar]
- 16.Becker N, Illingworth DR, Alaupovic P, Connor WE, Sundberg EE. Effects of saturated, monounsaturated, and omega-6 polyunsaturated fatty acids on plasma lipids, lipoproteins, and apoproteins in humans. Am J Clin Nutr. 1983;37:355–60. doi: 10.1093/ajcn/37.3.355. [DOI] [PubMed] [Google Scholar]
- 17.Keys A. Serum cholesterol response to dietary cholesterol. Am J Clin Nutr. 1984;40:351–9. doi: 10.1093/ajcn/40.2.351. [DOI] [PubMed] [Google Scholar]
- 18.Millen BE, Franz MM, Quatromoni PA, et al. Diet and plasma lipids in women. I. Macronutrients and plasma total and low-density lipoprotein cholesterol in women: the Framingham nutrition studies. J Clin Epidemiol. 1996;49:657–63. doi: 10.1016/0895-4356(96)00030-3. [DOI] [PubMed] [Google Scholar]
- 19.Alexander H, Lockwood LP, Harris MA, Melby CL. Risk factors for cardiovascular disease and diabetes in two groups of Hispanic Americans with differing dietary habits. J Am Coll Nutr. 1999;18:127–36. doi: 10.1080/07315724.1999.10718840. [DOI] [PubMed] [Google Scholar]
- 20.Sacks FM, Katan M. Randomized clinical trials on the effects of dietary fat and carbohydrate on plasma lipoproteins and cardiovascular disease. Am J Med. 2002;113(suppl 9B):13S–24S. doi: 10.1016/s0002-9343(01)00987-1. [DOI] [PubMed] [Google Scholar]
- 21.Appel LJ, Sacks FM, Carey VJ, et al. Effects of protein, monounsatu-rated fat, and carbohydrate intake on blood pressure and serum lipids: results of the OmniHeart randomized trial. JAMA. 2005;294:2455–64. doi: 10.1001/jama.294.19.2455. [DOI] [PubMed] [Google Scholar]
- 22.Mensink RP, Zock PL, Kester AD, Katan MB. Effects of dietary fatty acids and carbohydrates on the ratio of serum total to HDL cholesterol and on serum lipids and apolipoproteins: a meta-analysis of 60 controlled trials. Am J Clin Nutr. 2003;77:1146–55. doi: 10.1093/ajcn/77.5.1146. [DOI] [PubMed] [Google Scholar]
- 23.Obarzanek E, Sacks FM, Vollmer WM, et al. Effects on blood lipids of a blood pressure-lowering diet: the Dietary Approaches to Stop Hyper-tension (DASH) Trial. Am J Clin Nutr. 2001;74:80–9. doi: 10.1093/ajcn/74.1.80. [DOI] [PubMed] [Google Scholar]
- 24.Swain JFMP, Hamilton EF, Sacks FM, Appel LJ. Characteristics of the diet patterns tested in the optimal macronutrient intake trial to prevent heart disease (OmniHeart): options for a heart-healthy diet. J Am Diet Assoc. 2008;108:257–65. doi: 10.1016/j.jada.2007.10.040. [DOI] [PMC free article] [PubMed] [Google Scholar]
- 25.Parker B, Noakes M, Luscombe N, Clifton P. Effect of a high-protein, high-monounsaturated fat weight loss diet on glycemic control and lipid levels in type 2 diabetes. Diabetes Care. 2002;25:425–30. doi: 10.2337/diacare.25.3.425. [DOI] [PubMed] [Google Scholar]
- 26.Chivot L, Mainard F, Bigot E, et al. Logistic discriminant analysis of lipids and apolipoproteins in a population of coronary bypass patients and the significance of apolipoproteins C-III and E. Atherosclerosis. 1990;82:205–11. doi: 10.1016/0021-9150(90)90042-h. [DOI] [PubMed] [Google Scholar]
- 27.Luc G, Fievet C, Arveiler D, et al. Apolipoproteins C-III and E in apoB-and non-apoB-containing lipoproteins in two populations at contrasting risk for myocardial infarction: the ECTIM study. Etude Cas Temoins sur 'Infarctus du Myocarde. J Lipid Res. 1996;37:508–17. [PubMed] [Google Scholar]
- 28.Hokanson JE, Austin MA. Plasma triglyceride level is a risk factor for cardiovascular disease independent of high-density lipoprotein cholesterol level: a meta-analysis of population-based prospective studies. J Cardiovasc Risk. 1996;3:213–9. [PubMed] [Google Scholar]
- 29.Stampfer MJ, Krauss RM, Ma J, et al. A prospective study of triglyceride level, low-density lipoprotein particle diameter, and risk of myocardial infarction. JAMA. 1996;276:882–8. [PubMed] [Google Scholar]
- 30.Sarwar N, Danesh J, Eiriksdottir G, et al. Triglycerides and the risk of coronary heart disease: 10,158 incident cases among 262,525 participants in 29 Western prospective studies. Circulation. 2007;115:450–8. doi: 10.1161/CIRCULATIONAHA.106.637793. [DOI] [PubMed] [Google Scholar]
- 31.Dreon DM, Fernstrom HA, Miller B, Krauss RM. Low density lipoprotein subclass patterns and lipoprotein response to a reduced fat diet in men. FASEB J. 1994;8(1):121–6. [PubMed] [Google Scholar]