

Abstract
Folding intermediates have been detected and characterized for many proteins. However, their structures at atomic resolution have only been determined for two small single domain proteins: Rd-apocytochrome b562 and engrailed homeo domain. T4 lysozyme has two easily distinguishable but energetically coupled domains: the N- and C-terminal domains. An early native-state hydrogen exchange experiment identified an intermediate with the C-terminal domain folded and the N-terminal domain unfolded. We have used a native-state hydrogen exchange-directed protein engineering approach to populate this intermediate and demonstrated that it is on the folding pathway and exists after the rate-limiting step. Here, we determined its high-resolution structure and the backbone dynamics by multi-dimensional NMR methods. We also characterized the folding behavior of the intermediate using stopped-flow fluorescence, protein engineering, and native-state hydrogen exchange. Unlike the folding intermediates of the two single-domain proteins, which have many non-native side chain interactions, the structure of the hidden folding intermediate of T4 lysozyme is largely native-like. It folds like many small single domain proteins. These results have implications for understanding the folding mechanism and evolution of multi-domain proteins.
Keywords: Intermediate structure, T4 lysozyme, hydrogen exchange, protein folding, hidden intermediate, protein engineering
INTRODUCTION
Folding intermediates are important components of protein folding pathways and energy landscape. It has been argued that they may be responsible for solving the large-scale conformational search problem 1–3. Thus, it is important to characterize them in great detail. An ultimate understanding of the folding behavior of intermediates requires the determination of their structures and dynamic motions at atomic level. However, it has been very difficult to obtain such high-resolution structures of partially unfolded intermediates since they tend to aggregate or show line broadenings of NMR signals due to dynamic motions at millisecond time scale. Nevertheless, it has been demonstrated that high-resolution structures of folding intermediates can be determined in favorable cases. For example, the structures of the folding intermediates of two small single domain proteins, a redesigned apocytochrome b562 (Rd-apocyt b562) and an engrailed homeo domain (ENHD), have been determined at atomic resolution by multi-dimensional NMR methods 4–7. In the case of Rd-apocyt b562, a four-helix bundle protein, three intermediates have been observed. Two of them are identified by the native-state hydrogen exchange method 8. One has the N-terminal helix unfolded and the other has both the N-terminal and half of the C-terminal helices unfolded. The third intermediate is detected by monitoring the chemical shift changes of amide protons and nitrogens as a function of urea concentrations, which show cooperative transition before the global unfolding 5. The two intermediates identified in the native-state hydrogen exchange experiment are populated by mutations in the unfolded region of the intermediates, which destabilize the native state without perturbing the folded region of the intermediates. The third intermediate is populated in the presence of 2.8 M urea. In the case of ENHD, the intermediate is identified in the kinetic folding and amide hydrogen exchange experiments 9. It is also populated by a mutation in the unfolded region of the intermediate 7.
T4 lysozyme is one of the proteins whose structures and folding have been studied extensively 10–14. It has been suggested that the folding pathway of T4 lysozyme may have a stable submillisecond intermediate and an intermediate that exists on the native side of the rate-limiting transition state 15. In the accompanying paper, we have proposed a revised folding pathway, which includes an on-pathway hidden intermediate that exists after the rate-limiting transition state in the absence of a stable submillisecond intermediate (Kato et al., submitted). To determine the structure of this hidden intermediate, we applied the same native-state hydrogen exchange-directed protein engineering approach to populate the intermediate. This intermediate mimic is highly soluble and allows the determination of its structure and backbone dynamics by multidimensional NMR methods. We also examined the folding of the intermediate using stopped-flow fluorescence, native-state hydrogen exchange, and protein engineering. The structure and folding behavior of this hidden intermediate is similar to those of small single domain proteins.
RESULTS AND DISCUSSION
Population of the Hidden Intermediate of T4 Lysozyme
In the earlier native-state hydrogen exchange experiment, a partially unfolded intermediate with the C-terminal domain folded and the N-terminal domain unfolded has been identified for T4 lysozyme (see Fig. 1) 15. We have demonstrated by protein engineering and kinetic tests that the intermediate is an on-pathway hidden intermediate that exists after the rate-limiting transition state (Kato et al. Accompanying paper). Although the intermediate exists in solution under native conditions, it is not directly observable due to its miniscule population. To determine its structure, we used the native-state hydrogen exchange-directed protein engineering method 16 to populate the intermediate, in which glycine mutations are introduced in the unfolded region of the intermediate to selectively destabilize the native state without affecting the folded region of the intermediate. Such mutations make the intermediate the dominant species in solution and allow the direct studies by NMR methods. In this case, five large hydrophobic residues (I17, I27, L33, L46, I58) in the hydrophobic core of the N-terminal domain were substituted with glycines (see Fig. 1). It should be noted that both the earlier and current folding studies on T4 lysozyme were based on a pseudo wild-type (WT*) with Cys65 and Cys97 mutated to Thr and Ala, respectively. This 5G-mutant was highly soluble. The 1H-15N HSQC spectrum of the 5G-mutant had two kinds of peaks; well-dispersed weak peaks and strong peaks clustered in the narrow region of 8.0 ± 0.5 ppm, a typical range for unfolded polypeptide chain. Chemical shift assignment of these peaks by multi-dimensional NMR methods revealed that the former peaks were from the C-terminal domain and the latter were from the N-terminal domain. The Cα chemical shifts of the residues in the C-terminal domain in the 5G-mutant showed little change when compared with those of WT*, whereas those in the N-terminal domain were very different (Fig. 2).
Fig. 1.
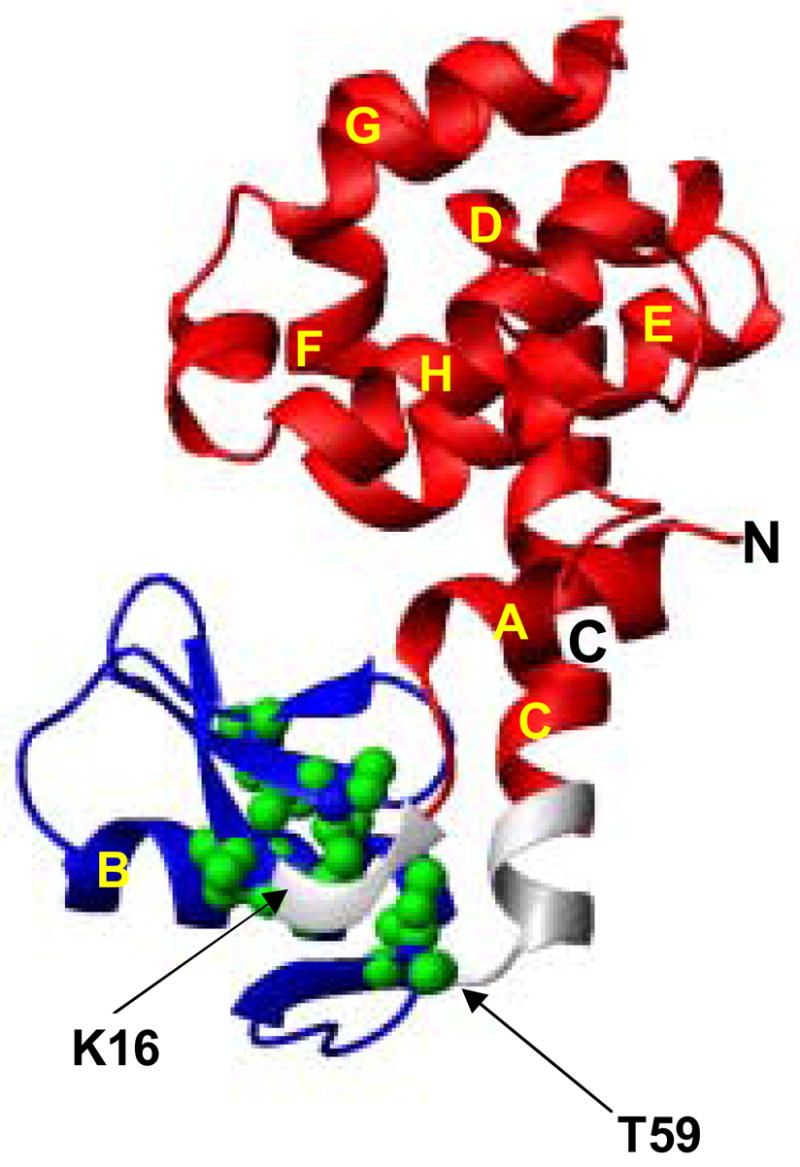
The structure of WT* of T4 lysozyme. Five residues (I17, I27, L33, L46 and I58) that were mutated to Gly in the 5G-mutant are shown in CPK models. The N-terminal domain (Met1-Leu14 and L66-L164) and the region (Ile17-Ile58) in the N-terminal domain are shown in red and blue, respectively. The location of the 5-glycine linker is depicted by the arrows. The figure was drawn with MOLMOL34. The helices are labeled in the order from the N-terminus to the C-terminus with A to H.
Fig. 2.

Chemical shift differences between 5G-mutant and T4_IM (back) and between WT* and T4_IM (red). Δppm was calculated from ((ΔδHN)2 + (ΔδN/8)2)1/2 where ΔδHN and ΔδN are chemical shift differences of backbone amide 1H and 15N, respectively.
Although the quality of the spectra of the 5G-mutant is very good, the existence of many strong peaks from unfolded residues makes the identification of the NOEs among weak peaks for structure determination difficult. To avoid this problem, we substituted the unfolded N-terminal domain from residues 17 to 58 with 5 glycines, which serve as a flexible linker (see Fig. 1). We named this new intermediate mimic as T4_IM. The NMR spectrum of T4_IM significantly reduced the number of peaks with strong intensities. The chemical shifts of the amide protons and nitrogens of the 5G-mutant and the T4_IM are nearly identical except those neighbor residues of the deletion site (see Fig. 2), indicating that the structure of the folded region of the intermediate was not affected by the short linker.
Structure and Backbone Dynamics of the Hidden Intermediate
The three-dimensional structure of the T4_IM was determined by heteronuclear NMR methods (see Methods). Fig. 3(a) shows the Cα traces of 15 calculated structures that satisfy all restraints obtained by the NMR methods. The number of restraints and parameters describing the quality of the structure were summarized in Table 1. In general, the structure of the folded region of T4_IM is very similar to the corresponding region of the WT*. Although we observed a few non-native side-chain conformations in some of the calculated structures (see Fig. 3(b)), no specific NOEs could be found to support the existence of such conformations, suggesting that these non-native side-chain conformations result from the lack of sufficient constraints to define the structure.
Fig. 3.
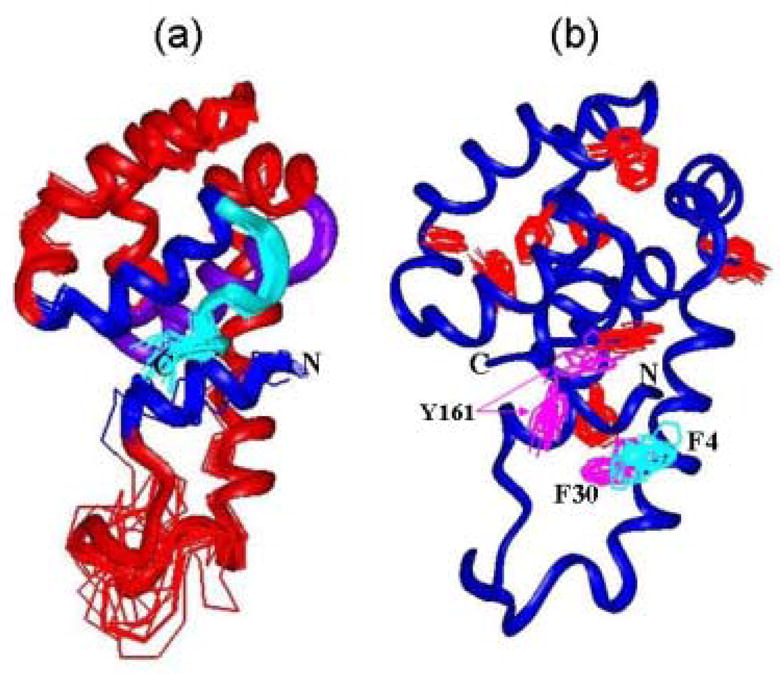
NMR structures of the T4_IM determined by NMR. a 15 structures were superimposed on their Cα traces. The color and ribbon were used to help to view the structures. b Illustration of the side chains with aromatic side chains. The side chains that are not well-defined are labeled with residue names.
Table 1.
Statistics of T4_IM structures.
| RMSD | <dgsa> | Ave |
|---|---|---|
| Bonds (Å) | 0.00797 ± 0.0001 | 0.00797 |
| Angles (deg) | 0.890 ± 0.044 | 0.890 |
| Impropers (deg) | 0.648 ± 0.032 | 0.648 |
| NOE(all) | 0.0782 ± 0.004 | 0.078 |
| Dihedral (deg) | 0.216 ± 0.01 | 0.218 |
| All residues | Helical region | |
| Backbone atoms (Å) | 1.15 | 0.49 |
| All heavy atoms (Å) | 1.43 | 1.02 |
| Intra residues NOE | 575 | |
| Sequential NOE (|i−j| = 1) | 582 | |
| Medium-range NOE (|i−j| ≤4) | 580 | |
| Long range NOE (|i−j| ≥5) | 122 | |
| H-bonds | 100 | |
| Dihedral angles | 304 |
The native-like feature of the T4_IM is very different from those of Rd-apocyt b562 and ENHD. For example, there are many non-native side-chain interactions in the intermediates of Rd-apocyt b562 even though they have native-like backbone topologies. In the case of ENHD, the intermediate is heavily misfolded with both non-native-like secondary and tertiary structures 7. The differences may be due to that fact that the N-terminal and the C-terminal domains involves less interactions when compared with those interactions between the folded and unfolded regions in the intermediates of Rd-apocyt b562 and ENHD.
Nevertheless, there is a common folding behavior among the intermediates of T4_IM and those of the Rd-apocyt b562. They all form after the rate-limiting transition state of folding. In addition, the intermediate of T4_IM and one of the intermediate of Rd-apocyt b562 have been demonstrated to be on the folding pathway 17. In contrast to the intermediates of T4_IM and Rd-apocyt b562, the intermediate of ENHD exists before the rate-limiting transition state. Interestingly, the folding intermediate of IM7 has also been found to have misfolded backbone topology and populate before the rate-limiting transition state 18. These results appear to be consistent with the hypothesis that folding intermediates that formed before the rate-limiting transition state are topologically misfolded and the intermediates that formed after the rate-limiting transition state should have native-like topology 4, 19.
To examine the backbone dynamics of the T4_IM, we carried out amide 15N relaxation measurement. We measured longitudinal relaxation time (T1), transverse relaxation time (T2), and {1H}-15N heteronuclear NOEs of amide nitrogens at 25°C. The T2 values in the well-folded region are ~100 msec, suggesting that the T4_IM is monomeric. The relaxation data was analyzed with an extended model-free approach to obtain an order parameter (S2) and a chemical exchange term (Rex) for each residue (see Fig. 4) 20. The order parameters, a measure for the amplitude of the internal motion on the pico to nanosecond timescale, are around 0.9 for most of the residues except the neighboring residues of the linker region and the C-terminal region, suggesting that T4_IM has a well-folded backbone structure. Significantly low order parameters occurred to residues from Arg14 to Gly21, consistent with an unfolded structure in this linker region. Notably, almost all the residues in A-helix have chemical exchange terms (Fig. 4(b)). This conclusion is further supported by the fact that the peak intensities of all the residues in A-helix are somewhat lower than those of other residues. In addition, five residues (R95, A98 and L99, I100 and M102) in the E-helix, which form the central core and contact with A-helix, also have conformational exchange term. Considering the fact that the A-helix is located between rapidly fluctuating linker region and the hydrophobic core of the C-terminal domain, it is not too surprising that such structural fluctuations occurred on a slower timescale and affected the relaxation behavior of proximal E-helix (see Fig. 4(c)).
Fig. 4.
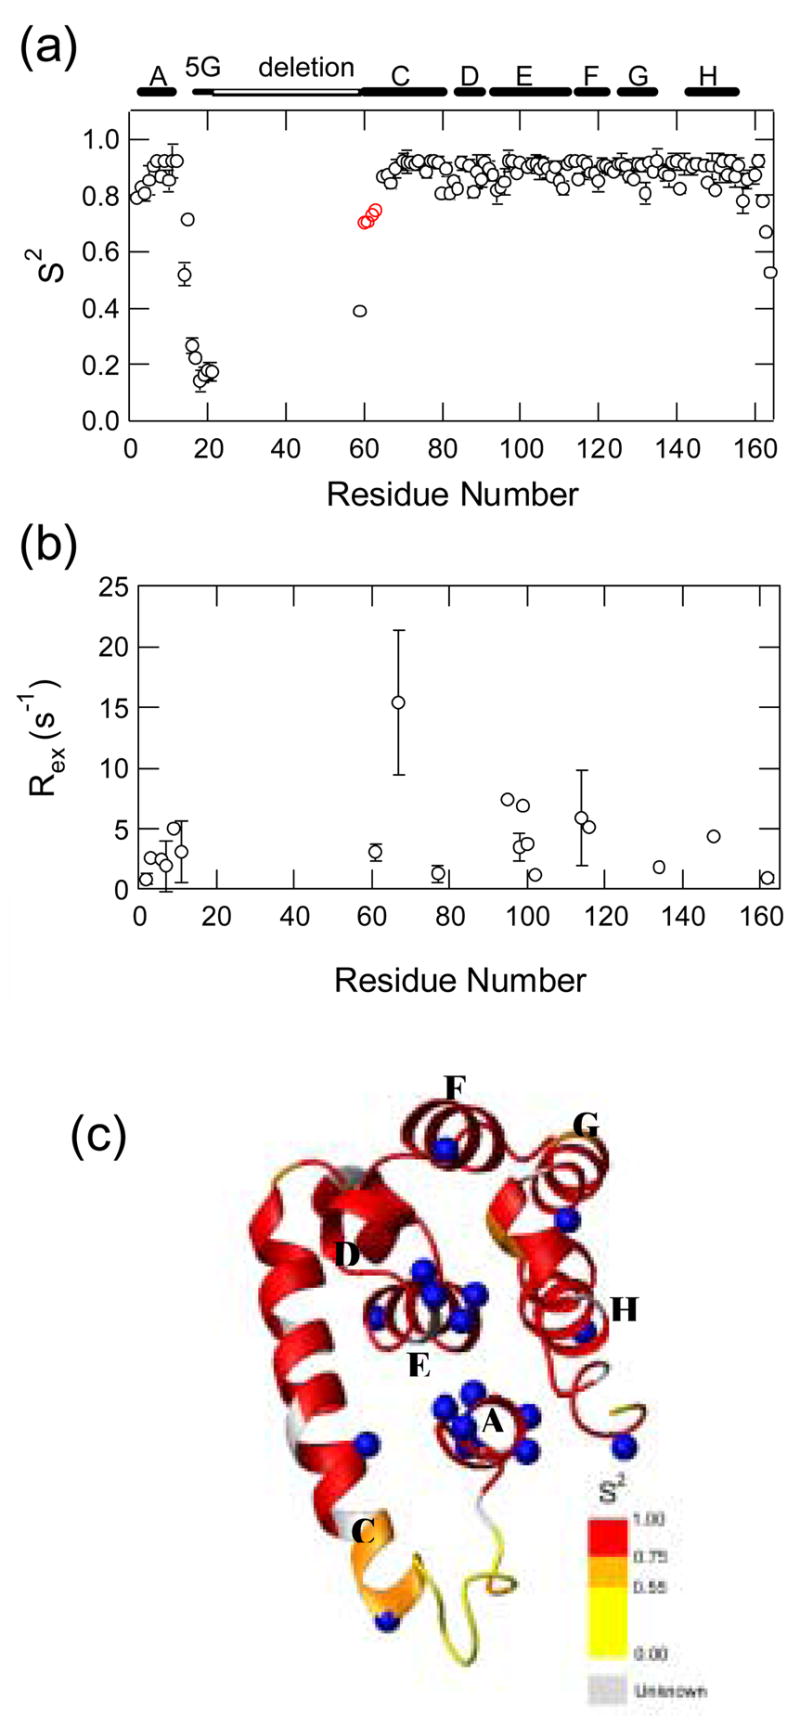
Backbone dynamics of T4_IM..(a) Order parameters. (b) The chemical exchange term. The location of helices, 5-glycine linker, and the deleted region (Ile17-Ile58) are indicated at the top of the figure. Four residues (K60-A63) at the N-terminal end of the C-helix are shown in red. (c) Order parameters mapped onto the 3D structure of T4_IM. The residues with chemical exchange terms are shown by CPK models (blue).
T4 lysozyme uses a long helix (helix C) to couple the two domains. The C-helix is largely folded except for the four residues (K60 to A63) at its N-terminus in the T4_IM. The order parameters of the residues from K60 to A63 are much lower than others in C-helix (Fig. 4(a)). This result is consistent with the previous native-state hydrogen exchange and a protein engineering studies. For example, a dispersion of ΔGHXs of amide protons in C- helix is observed in the earlier native-state hydrogen exchange experiment, which could be caused by the fray of C-helix as denaturant concentration increases 15. In the earlier protein engineering study21, the coupling of the N- and C-terminal domains was studied. The C-terminal domain is set from residue 13 to residue 75 based on a computer program CONTACTS, which evaluates the atomic coordinates and identifies all potential van der Waals and hydrogen bonding interactions between any two defined sets of residues. It is found that the C-terminal domain (a start methionine followed by residues 75–164, a Ser(Gly)4Ala linker, and residues 1–12) can only fold into a marginally stable structure. This is consistent with our protein engineering results that the nine residues from Leu66 to Ala74 are important for the stability of the C-terminal domain. The occurrence of a break at E64 was somewhat unexpected since E64 is located at the middle of the C-helix. Nevertheless, the structure of the T4_IM confirmed this unusual behavior. Interestingly, a break in the middle of the C-terminal helix in a partially unfolded intermediate has also been observed for Rd-apocyt b562 in a native-state hydrogen exchange experiment 6, 8. These results highlight the success of using native-state hydrogen exchange results to identify the structures of partially unfolded intermediates that otherwise exist too rarely to be detected.
Native-State Hydrogen Exchange
The early native-state hydrogen exchange experiment on WT* successfully identified the hidden intermediate with the N-terminal domain unfolded 15. However, the exchange rates of many amide protons in the C-terminal domain at low concentrations of denaturant are not measured since they exchange very slowly. Therefore, it remains unclear whether the C-terminal domain can be further divided into smaller partially unfolded intermediates. To investigate this issue, we have performed the native-state hydrogen exchange experiment on the T4_IM mutant.
Exchangeable amide protons (NH) that are involved in hydrogen-bonded structure can exchange with solvent hydrogens only when they are transiently exposed to open reactions as indicated in Eq. (1) 22:
| (1) |
Under EX2 condition where closing rate constant is much larger than the intrinsic exchange rate constant (kint), the exchange rate constant (kex) of any hydrogen is given by
| (2) |
where Kop is the equilibrium constant between open and closed forms. This leads to free energy for the dominant opening reaction:
| (3) |
where R is the gas constant and T is the temperature in Kelvin. ΔGHX for each amide proton is determined by a combination of two different mechanisms; global/subglobal unfolding and local fluctuations. While the former can be promoted by adding denaturant, the latter is independent of the denaturant concentration. Thus, by examining the hydrogen exchange rates as a function of denaturant concentrations, the global/subglobal unfolding events can be identified 23.
The native-state hydrogen exchange experiment on the T4_IM was performed at pD 5.0 and 30°C. Under this condition, EX2 condition holds because folding rate constant (> 5 sec−1) is much larger than the intrinsic exchange rate constants for all amide protons (< 0.2 sec−1). The exchange of 66 of the 127 backbone amide protons in T4_IM was monitored as a function of denaturant concentration. Fig. 5 shows that the ΔGHXs of representative amide protons plotted against denaturant concentrations. Most residues in the E-helix have the largest ΔGHXs that show linear dependence on GdmCl concentration (Fig. 5(a)), suggesting that they exchange through global unfolding. We fitted the ΔGHXs of Ala97 in the region from 0.3 M to 0.8 M GdmCl to a linear equation:
| (4) |
where ΔGNUD2O represents the global unfolding free energy extrapolated to 0 M denaturant and mNU represents the denaturant dependence of the unfolding free energy (dotted line in Fig. 5). It yielded a slope (mNU) of 4.9 kcal mol−1 and ΔGuD2O of 9.3 kcal mol−1.
Fig. 5.

Native-state hydrogen exchange results of T4_IM at pD 5.0 and 30 °C. (a) Amide protons in the E-helix. (b) Amide protons in the A-helix and the C-helix. (c) Amide protons in the D-helix and the F-helix. (d) Amide protons in the G-helix and the H-helix. The fitting of the exchange profiles of Ala97 in the E-helix by eq. (4) at GdmCl concentrations larger than 0.3 is shown for comparison (dotted red line).
In native-state hydrogen exchange experiments, a partially unfolded state is usually revealed by the existence of an amide proton that has a non-zero m-value that is smaller than the global unfolding m-value 23. No such amide protons were identified. The ΔGHXs of all other amide protons that do not exchange through global unfolding are independent of GdmCl concentrations (Fig. 5(a)–(d)). Only at sufficiently high concentrations of denaturant did they merge together with those in the E-helix and define global unfolding process. These results suggest that no partially unfolded intermediates are detectable by the native-state hydrogen exchange method.
Φ-value Analysis
To examine the folding of T4_IM, kinetic folding/unfolding experiments were performed by using stopped-flow fluorescence. As in the case of WT*, the kinetic trace has two kinetic phases; the fast phase is the major component 80%. The slow phase 20% is attributed to the process of the isomerizaton of prolines. Fig. 6(a) shows the logarithms of folding/unfolding rate constants of the fast phase of T4_IM against denaturant concentrations (chevron plots). To explore the interactions in the rate-limiting transition state, we used protein engineering method 24 to determine the Φ-values 25 at twenty positions that are occupied by hydrophobic residues. Here, Φ-value is the ratio of the change in the stability of the transition state over the change in stability of the native state caused by a mutation (Φ = ΔΔG†TS-U/ΔΔGN-U). Φ ≈ 0 suggests that the mutated residue is unfolded in the transition state, whereas non-zero Φ values suggest that the residue forms interactions with other residues in the rate-limiting transition state. We use Ala to substitute the large hydrophobic side chains and Gly to substitute Ala to avoid creating new interactions in the transition state. All mutants destabilized the T4_IM except L66A and V131A, which slightly stabilize the native state. Figure 6(a)–(g) illustrate the chevron plots for the mutants. To obtain the global unfolding free energy for each mutant, we fitted the region near the bottom of the chevron plot to the following equation:
| (5) |
where and are the folding and unfolding rate constants in the absence of denaturant; and mf and mu are the parameters describing the slope of folding and unfolding limbs of chevron plot. We chose to calculate the Φ values at 1 M urea since most of the folding rates of mutants were measured directly at 1 M urea. In addition, the folding rate of the T4_IM at 1 M urea is well within the curved region of the chevron plot. ΔΔG†TS-U values were calculated from the folding rates that were measured directly (see methods). The ΔΔGN-U at 1 M urea was derived from linear regions of the chevron plots by assuming that folding/unfolding is apparently two-state (see Methods). The obtained parameters are listed in Table 2.
Fig. 6.
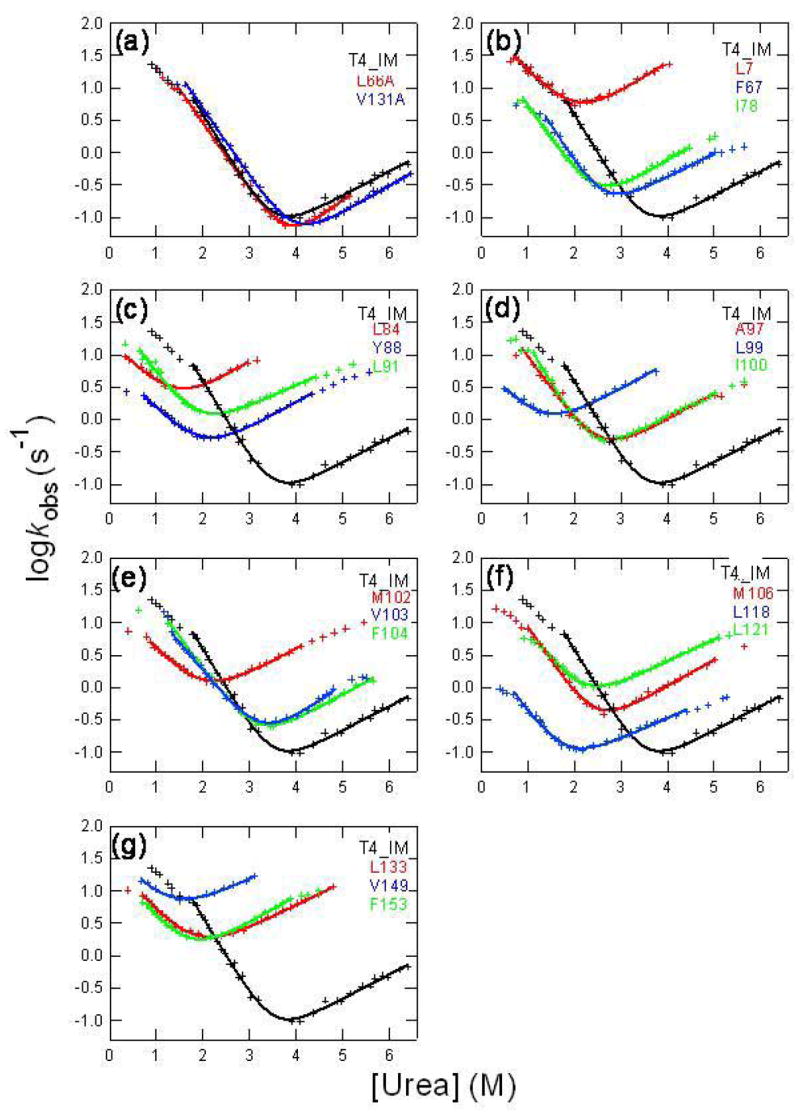
Chevron plots of T4_IM and its mutants. The lines were the best fits of eq. (5) to the linear regions of the chevron plots.
Table 2.
Thermodynamic and kinetic parameters for the folding of T4_IM and various mutants of T4_IM at pH 6.0 and 25°C
| Proteins | mf | mu | kf | Ku | ΔΔ G‡TS-U | ΔΔGN-U | ΦF |
|---|---|---|---|---|---|---|---|
| (M−1) | (sec−1) | (kcal/mol) | |||||
| T4_IM | 2.75 | 0.86 | 60.5 (19.9) | 0.007 | |||
| L7A | 1.72 | 1.06 | 18.3 (16.9) | 1.050 | 0.10 | 3.68 | 0.03 |
| L66A | 2.40 | 1.26 | 31.5 (19.7) | 0.001 | 0.01 | −0.77 | ND |
| F67A | 2.66 | 0.84 | 10.1 (4.03) | 0.034 | 0.95 | 2.03 | 0.47 |
| I78A | 2.35 | 0.99 | 5.38 (5.09) | 0.040 | 0.81 | 2.46 | 0.33 |
| L84A | 1.62 | 1.03 | 3.09 (4.07) | 1.020 | 0.94 | 4.71 | 0.20 |
| Y88A | 1.72 | 0.92 | 1.43 (1.53) | 0.120 | 1.52 | 3.90 | 0.39 |
| L91A | 2.26 | 0.73 | 5.12 (5.73) | 0.375 | 0.74 | 3.81 | 0.19 |
| A97G | 2.29 | 0.91 | 9.47 (6.94) | 0.067 | 0.62 | 2.43 | 0.26 |
| L99A | 1.78 | 0.90 | 1.16 (1.59) | 0.493 | 1.50 | 4.81 | 0.31 |
| I100A | 2.79 | 0.84 | 14.7 (11.6) | 0.088 | 0.32 | 2.34 | 0.14 |
| M102A | 1.76 | 0.89 | 3.88 (4.14) | 0.278 | 0.93 | 3.81 | 0.24 |
| V103A | 2.00 | 1.15 | 13.4 (14.6) | 0.011 | 0.18 | 1.16 | 0.16 |
| F104A | 2.25 | 0.91 | 18.5 (9.93) | 0.021 | 0.41 | 1.35 | 0.30 |
| M106A | 2.46 | 0.93 | 8.78 (8.04) | 0.065 | 0.54 | 2.46 | 0.22 |
| L118A | 2.30 | 0.74 | 0.42 (0.41) | 0.037 | 2.30 | 3.93 | 0.23 |
| V131A | 2.42 | 0.95 | 54.0 (ND) | 0.003 | 0.46 | −0.51 | ND |
| L133A | 1.80 | 0.81 | 4.81 (5.08) | 0.540 | 0.81 | 4.07 | 0.20 |
| V149A | 1.78 | 0.78 | 7.11 (10.8) | 3.270 | 0.36 | 4.91 | 0.07 |
| F153A | 1.99 | 0.93 | 3.79 (4.35) | 0.515 | 0.90 | 4.18 | 0.22 |
The values of kf, ku, mf, and mu were obtained by fitting the linear regions of chevron plots to Eq. (5). The listed values of kf, ku, ΔΔG‡TS-U, ΔΔGN-U, and ΦF are at 1 M urea. The numbers in the parentheses are the directly measured values at 1 M urea, or estimated from those values close to at 1 M urea. These values are used to calculate ΔΔG‡TS-U.
Fig. 7(a) illustrates the Φ-values against the residue numbers. Fig. 7(b) mapped the Φ-values onto the 3D structure of T4_IM. All of the Φ–values are smaller than 0.6. Only six residues F67, I78, Y88, L99, F104, and L118 have Φ–values larger than 0.3. They are located in the C, D, E, F helices, the middle of the polypeptide chain. The other three helices A, G, H have smaller Φ–values are at the two termini of the polypeptide chain. In terms of three-dimensional structure, C, D, E, and F are in one region of the structure. A, G, and H are in the other region of the structure. Therefore, it seems that the transition state mainly involves the formation of the region covering C, D, E, and F helices.
Fig. 7.
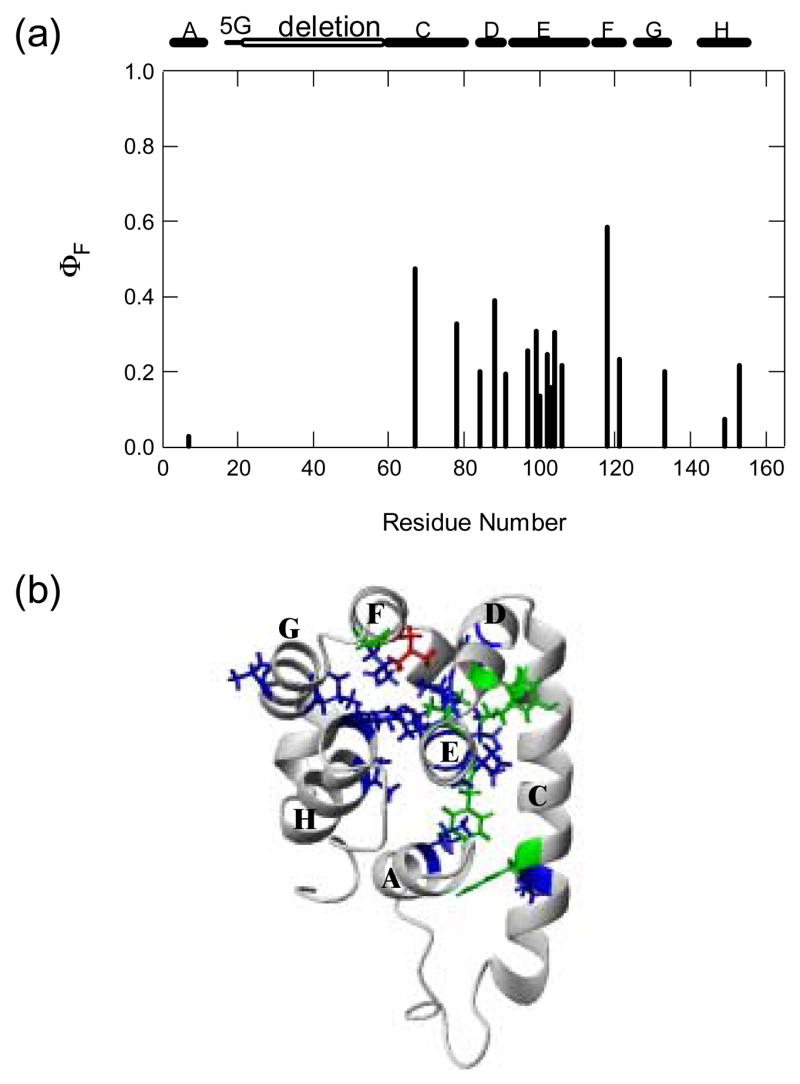
The rate-limiting transition state characterized by Φ-values at 1 M urea. (a) Φ values plotted against residue numbers. The location of the helices, glycine linker and deleted regions is shown on the top of the figure. (b) Φ-values are mapped onto the 3D structure of T4_IM. The mutated residues are shown by sticks: red (Φ > 0.5), green (0.3 < Φ < 0.5) and blue (Φ < 0.3). The figure was drawn with MOLMOL.
It should be noted there can be significant ambiguities in the interpretation of non zero Φ values. For example, a fractional value of Φ can be interpreted in two different ways: a partial formation of side chain interactions in the rate-limiting transition state with well-defined structure or parallel pathways with a mixture of multiple partially unfolded conformations. In addition, very small Φ values could arise from the free energy change in the unfolded state. For example, Ala is more favorable for the formation of helical structures than other large hydrophobic side chains. Therefore the substitution of a large hydrophobic residue by Ala may stabilize the unfolded state if a residual α-helical structure exists at the mutation site in the unfolded state.
Implications for the Evolution and Design of Multi-Domain Proteins
It has been suggested that a multi-domain protein may be evolved by fusing single domains or foldons through exon shuffling 26–28. The structure and folding behavior of T4 lysozyme appear to be consistent with this hypothesis. T4 lysozyme is a typical two-domain protein. The active site of the enzyme is at the interface between the two domains. The C-terminal domain can fold independently and has a well-defined structure. Its folding behavior is very similar to those of small single-domain proteins. The autonomous folding behavior of the C-terminal domain suggests it may be evolved from a single domain protein. In contrast, an isolated N-terminal domain cannot fold stably by itself 21, suggesting that it may be evolved from a segment or an unfolded region of another protein, which is stabilized upon fusion with the C-terminal domain. Interestingly, a similar case has also been observed in an earlier study on the PDZ-3 domain construct (1BE9). This construct has a well-defined structure that contains the PDZ-3 domain and a small extra domain due to a cloning artifact. It folds through a hidden intermediate with this PDZ-3 domain folded and the extra segment unfolded 29. These results suggest that a two-domain protein may be easily evolved from a folded single domain protein with the addition of an extra segment, providing a useful clue for the evolution and design of multi-domain proteins.
CONCLSUION
The structure of the hidden on-pathway intermediate of T4 lysozyme was solved by heteronuclear multi-dimensional NMR methods. Both the secondary and tertiary structures of the intermediate are native-like. Extensive studies of this hidden intermediate by stopped-flow fluorescence, native-state hydrogen exchange, and protein engineering revealed that it behaves very much like those of small single domain proteins. These results have important implications for understanding the folding mechanism and evolution of multi-domain proteins.
MATERIALS AND METHODS
Protein Samples
All mutants were made by QuickChange kit (Strategene). Protein expression and purification were carried out as previously described (Katou et al., accompanying paper). 15N and 15N/13C labeled proteins were expressed in M9 media with 15NH4Cl and 13C-D-Glucose as the sole nitrogen and carbon sources. Urea and GdmCl were ultrapure grade (Sigma). Their concentrations were determined by refractive indexes.
NMR Measurements and Structure Calculation
NMR spectra were collected on a Bruker DRX 500 MHz spectrometer. They were processed with nmrPipe 30 and analyzed with Sparky (http://www.cgl.ucsf.edu/home/sparky/). Assignments of 1H, 13C and 15N resonances were obtained from standard multidimensional NMR methods. Inter-proton distances were derived from 2D-NOESY, 3D 1H-15N NOESY-HSQC and 1H-13C NOESY-HSQC. An HNHA experiment was used to determine 3JαN coupling constants for Φ angles. Structure calculation was carried out with NIH-XPLOR. An extended polypeptide chain with reasonable geometry was used as the initial template. We then randomized the Φ and ψ angles before each cycle of simulated annealing protocol (SA). Each SA structure was optimized by restrained refinement. These structures were further checked by PROCHECK-NMR 31.
15N Relaxation Measurement and Data Analysis
15N backbone dynamics measurement was performed at 25°C and pH 5.0. The pulse sequences of Ferrow et al.32 was used. Steady-state {1H}-15N NOE values were determined by recording the spectra in the presence and absence of 1H saturation period (3s). NOE was calculated from the intensities of cross peaks by NOE = INOE/INONOE. The R1(=1/T1), R2 (=1/T2), and NOE values were analyzed by the extended model-free approach using the program Tensor2 33. Anisotropic model was selected to describe overall tumbling of molecule.
Native-state Hydrogen Exchange Experiments
The native-state hydrogen exchange experiment was initiated by loading 0.5-ml protein sample in H2O at pH 5.0 (50 mM D4-NaAc) to a spin column (Sephadex 25, bed volume 3 ml) that was pre-equilibrated with D2O at pD 5.0 (50 mM D4-NaAc) containing various concentrations of deuterated GdmCl for buffer exchange. The column was spun for 1 min at 4000 rpm using a benchtop centrifuge. The eluted protein sample was immediately transferred into a NMR tube. A series of 1H-15N HSQC spectra at 30°C were collected. Each spectrum took 18 minutes. The concentrations of protein samples were about 1 mM. The peak intensities as a function of time were fitted to a single exponential decay to obtain the exchange rate.
Stopped-Flow Measurements
Stopped-flow measurements were performed with a Biologic QFM-4 (Grenoble, France; dead time ≈ 1 ms) at 25°C. Kinetic rate constants were measured by monitoring the change of fluorescence signal. The excitation wavelength was 280 nm and the emission was collected using a filter that cuts off the signal below 320 nm. Refolding was initiated by diluting the denatured proteins in high concentrations of urea with refolding buffer (50mM MES-NaOH, pH 6.0). Unfolding was carried out by mixing the protein solution in buffer (50mM MES-NaOH, pH 6.0) with high concentrations of urea solutions. The folding traces were fitted with two exponentials. The folding rate constant of the fast phase was used to calculate the Φ Values. The unfolding kinetics was fitted with a single exponential.
Analysis of Chevron Curves and Calculation of Φ Values
The linear region of the chevron plot of each mutant was fitted to eq. (5) by assuming folding is apparently two-state in this region. The obtained parameters kf and ku at 1 M urea were used to calculate global unfolding free energy differences between the T4_IM and its mutants by:
| (6) |
| (7) |
| (8) |
The ΔΔG‡TS-U value at 1 M urea for each mutant was calculated by Eq. (9)
| (9) |
Here kf is the value directly measured from the experiment. The Φ-value for each mutation at 1 M urea was calculated by
| (10) |
Acknowledgments
H.K. was supported by the Japan Society for Promotion of Science (JSPS) Research Fellowships for Young Scientists. This research was supported by the intramural research program of the NIH, National Cancer Institute, Canter for Cancer Research.
Footnotes
Publisher's Disclaimer: This is a PDF file of an unedited manuscript that has been accepted for publication. As a service to our customers we are providing this early version of the manuscript. The manuscript will undergo copyediting, typesetting, and review of the resulting proof before it is published in its final citable form. Please note that during the production process errors may be discovered which could affect the content, and all legal disclaimers that apply to the journal pertain.
References
- 1.Levinthal C. Are there pathways for protein folding? J Chim Phys. 1968;65:44–45. [Google Scholar]
- 2.Wetlaufer DB. Nucleation, rapid folding, and globular intrachain regions in proteins. Proc Natl Acad Sci USA. 1973;70:697–701. doi: 10.1073/pnas.70.3.697. [DOI] [PMC free article] [PubMed] [Google Scholar]
- 3.Bai Y. Energy barriers, cooperativity, and hidden intermediates in the folding of small proteins. Biochem Biophys Res Commun. 2006;340:976–983. doi: 10.1016/j.bbrc.2005.12.093. [DOI] [PubMed] [Google Scholar]
- 4.Feng H, Takei J, Lipsitz R, Tjandra N, Bai Y. Specific non-native hydrophobic interactions in a hidden folding intermediate: implications for protein folding. Biochemistry. 2003;42:12461–12465. doi: 10.1021/bi035561s. [DOI] [PubMed] [Google Scholar]
- 5.Feng H, Vu ND, Bai Y. Detection and structure determination of an equilibrium unfolding intermediate of Rd-apocytochrome b562: native fold with non-native hydrophobic interactions. J Mol Biol. 2004;343:1477–1485. doi: 10.1016/j.jmb.2004.08.099. [DOI] [PubMed] [Google Scholar]
- 6.Feng H, Zhou Z, Bai Y. A protein folding pathway with multiple folding intermediates at atomic resolution. Proc Natl Acad Sci U S A. 2005;102:5026–5031. doi: 10.1073/pnas.0501372102. [DOI] [PMC free article] [PubMed] [Google Scholar]
- 7.Religa TL, Markson JS, Mayor U, Freund SM, Fersht AR. Solution structure of a protein denatured state and folding intermediate. Nature. 2005;437:1053–1056. doi: 10.1038/nature04054. [DOI] [PubMed] [Google Scholar]
- 8.Chu R, Pei W, Takei J, Bai Y. Relationship between the native-state hydrogen exchange and folding pathways of a four-helix bundle protein. Biochemistry. 2002;41:7998–8003. doi: 10.1021/bi025872n. [DOI] [PubMed] [Google Scholar]
- 9.Mayor U, Guydosh NR, Johnson CM, Grossmann JG, Sato S, Jas GS, Freund SM, Alonso DO, Daggett V, Fersht AR. The complete folding pathway of a protein from nanoseconds to microseconds. Nature. 2003;421:863–867. doi: 10.1038/nature01428. [DOI] [PubMed] [Google Scholar]
- 10.Lu J, Dahlquist FW. Detection and characterization of an early folding intermediate of T4 lysozyme using pulsed hydrogen exchange and two-dimensional NMR. Biochemistry. 1992;31:4749–4756. doi: 10.1021/bi00135a002. [DOI] [PubMed] [Google Scholar]
- 11.Matthews BW. Studies on protein stability with T4 lysozyme. Adv Protein Chem. 1995;46:249–278. doi: 10.1016/s0065-3233(08)60337-x. [DOI] [PubMed] [Google Scholar]
- 12.Matthews BW. Structural and genetic analysis of the folding and function of T4 lysozyme. FASEB J. 1996;10:35–41. doi: 10.1096/fasebj.10.1.8566545. [DOI] [PubMed] [Google Scholar]
- 13.Gassner NC, Baase WA, Lindstrom JD, Lu J, Dahlquist FW, Matthews BW. Methionine and alanine substitutions show that the formation of wild-type-like structure in the carboxy-terminal domain of T4 lysozyme is a rate-limiting step in folding. Biochemistry. 1999;38:14451–14460. doi: 10.1021/bi9915519. [DOI] [PubMed] [Google Scholar]
- 14.Sagermann M, Baase WA, Mooers BH, Gay L, Matthews BW. Relocation or duplication of the helix A sequence of T4 lysozyme causes only modest changes in structure but can increase or decrease the rate of folding. Biochemistry. 2004;43:1296–1301. doi: 10.1021/bi035702q. [DOI] [PubMed] [Google Scholar]
- 15.Llinas M, Gillespie B, Dahlquist FW, Marqusee S. The energetics of T4 lysozyme reveal a hierarchy of conformations. Nat Struct Biol. 1999;6:1072–1078. doi: 10.1038/14956. [DOI] [PubMed] [Google Scholar]
- 16.Takei J, Pei W, Vu D, Bai Y. Populating partially unfolded forms by hydrogen exchange-directed protein engineering. Biochemistry. 2002;41:12308–12312. doi: 10.1021/bi026491c. [DOI] [PubMed] [Google Scholar]
- 17.Zhou Z, Huang Y, Bai Y. An on-pathway hidden intermediate and the early rate-limiting transition state of Rd-apocytochrome b562 characterized by protein engineering. J Mol Biol. 2005;352:757–764. doi: 10.1016/j.jmb.2005.07.057. [DOI] [PubMed] [Google Scholar]
- 18.Gsponer J, Hopearuoho H, Whittaker SB, Spence GR, Moore GR, Paci E, Radford SE, Vendruscolo M. Determination of an ensemble of structures representing the intermediate state of the bacterial immunity protein Im7. Proc Natl Acad Sci U S A. 2006;103:99–104. doi: 10.1073/pnas.0508667102. [DOI] [PMC free article] [PubMed] [Google Scholar]
- 19.Sosnick TR, Mayne L, Englander SW. Molecular collapse: the rate-limiting step in two-state cytochrome c folding. Proteins. 1996;24:413–426. doi: 10.1002/(SICI)1097-0134(199604)24:4<413::AID-PROT1>3.0.CO;2-F. [DOI] [PubMed] [Google Scholar]
- 20.Palmer AG., III NMR characterization of the dynamics of biomacromolecules. Chem Rev. 2004;104:3623–3640. doi: 10.1021/cr030413t. [DOI] [PubMed] [Google Scholar]
- 21.Llinas M, Marqusee S. Subdomain interactions as a determinant in the folding and stability of T4 lysozyme. Protein Sci. 1998;7:96–104. doi: 10.1002/pro.5560070110. [DOI] [PMC free article] [PubMed] [Google Scholar]
- 22.Hvidt A, Nielsen SO. Hydrogen exchange in proteins. Adv Protein Chem. 1966;21:287–386. doi: 10.1016/s0065-3233(08)60129-1. [DOI] [PubMed] [Google Scholar]
- 23.Bai Y, Sosnick TR, Mayne L, Englander SW. Protein folding intermediates: native-state hydrogen exchange. Science. 1995;269:192–197. doi: 10.1126/science.7618079. [DOI] [PMC free article] [PubMed] [Google Scholar]
- 24.Matthews CR, Hurle MR. Mutant sequences as probes of protein folding mechanisms. Bioessays. 1987;6:254–257. doi: 10.1002/bies.950060603. [DOI] [PubMed] [Google Scholar]
- 25.Fersht AR, Matouschek A, Serrano L. The folding of an enzyme. I Theory of protein engineering analysis of stability and pathway of protein folding. J Mol Biol. 1992;224:771–782. doi: 10.1016/0022-2836(92)90561-w. [DOI] [PubMed] [Google Scholar]
- 26.Roy SW, Gilbert W. The evolution of spliceosomal introns: patterns, puzzles and progress. Nat Rev Genet. 2006;7:211–221. doi: 10.1038/nrg1807. [DOI] [PubMed] [Google Scholar]
- 27.Riechmann L, Winter G. Novel folded protein domains generated by combinatorial shuffling of polypeptide segments. Proc Natl Acad Sci U S A. 2000;97:10068–10073. doi: 10.1073/pnas.170145497. [DOI] [PMC free article] [PubMed] [Google Scholar]
- 28.Panchenko AR, Luthey-Schulten Z, Cole R, Wolynes PG. The foldon universe: a survey of structural similarity and self-recognition of independently folding units. J Mol Biol. 1997;272:95–105. doi: 10.1006/jmbi.1997.1205. [DOI] [PubMed] [Google Scholar]
- 29.Feng H, Vu ND, Bai Y. Detection of a hidden folding intermediate of the third domain of PDZ. J Mol Biol. 2005;346:345–353. doi: 10.1016/j.jmb.2004.11.040. [DOI] [PubMed] [Google Scholar]
- 30.Delaglio F, Grzesiek S, Vuister GW, Zhu G, Pfeifer J, Bax A. NMRPipe: a multidimensional spectral processing system based on UNIX pipes. J Biomol NMR. 1995;6:277–293. doi: 10.1007/BF00197809. [DOI] [PubMed] [Google Scholar]
- 31.Laskowski RA, Moss DS, Thornton JM. Main-chain bond lengths and bond angles in protein structures. J Mol Biol. 1993;231:1049–1067. doi: 10.1006/jmbi.1993.1351. [DOI] [PubMed] [Google Scholar]
- 32.Farrow NA, Muhandiram R, Singer AU, Pascal SM, Kay CM, Gish G, Shoelson SE, Pawson T, Forman-Kay JD, Kay LE. Backbone dynamics of a free and phosphopeptide-complexed Src homology 2 domain studied by 15N NMR relaxation. Biochemistry. 1994;33:5984–6003. doi: 10.1021/bi00185a040. [DOI] [PubMed] [Google Scholar]
- 33.Dosset P, Hus JC, Blackledge M, Marion D. Efficient analysis of macromolecular rotational diffusion from heteronuclear relaxation data. J Biomol NMR. 2000;16:23–28. doi: 10.1023/a:1008305808620. [DOI] [PubMed] [Google Scholar]
- 34.Koradi R, Billeter M, Wuthrich K. MOLMOL: a program for display and analysis of macromolecular structures. J Mol Graph. 1996;14:51–32. doi: 10.1016/0263-7855(96)00009-4. [DOI] [PubMed] [Google Scholar]