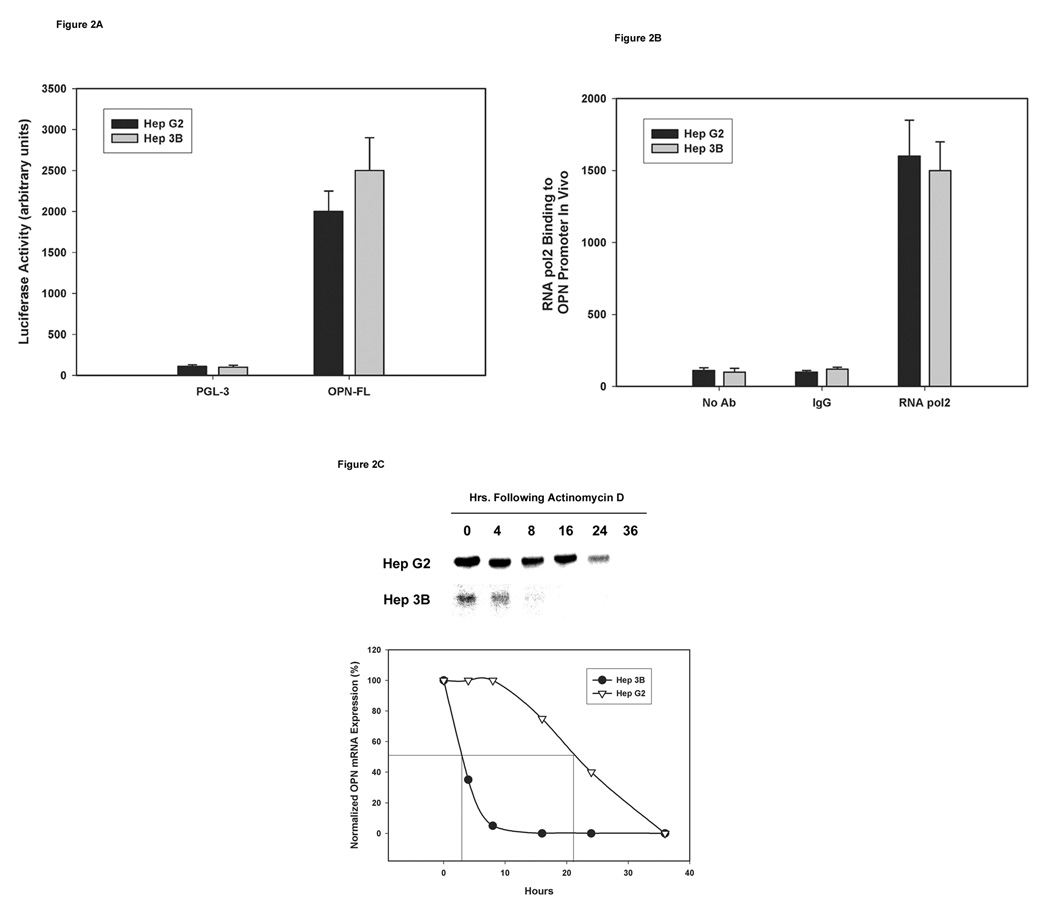
Figure 2. Determination of transcription activity and OPN mRNA half-life in the two HCC cell lines.
(A) HepG2 and Hep3B cells were transfected with firefly luciferase reporter plasmid vector PGL3 or PGL3 plus OPN full-length region along with 50ng/ml SV-40 expressing renilla luciferase for 48 h. Firefly luciferase activity was standardized against Renilla luciferase activity and was expressed as the mean fold luminescence for three independent experiments.
(B) Binding of RNA pol2 to the OPN promoter region was assessed using ChIP assays in HepG2 and Hep3B cells followed by quantification using real-time PCR analysis; data are expressed as mean ± SEM of three independent experiments.
(C) OPN mRNA half-life was determined in the two HCC cell lines in the presence of actinomycin D (20µg/ml) by Northern blot analysis after 0, 4, 8, 16, 24, and 36 h of incubation. Bands on the blots were quantified and presented in a graphical form. Blot is representative of three experiments. Graph combines data from the three experiments.

