

Abstract
Although persistent translation arrest correlates with the selective vulnerability of post-ischemic hippocampal CA1 neurons, the mechanism of persistent translation arrest is not fully understood. Using fluorescent in situ hybridization and immunofluorescence histochemistry, we studied colocalization of polyadenylated mRNAs [poly(A)] with the following mRNA binding factors: eIF4G (translation initiation factor), HuR (ARE-containing mRNA stabilizing protein), poly(A) binding protein (PABP), S6 (small ribosomal subunit marker), TIA-1 (stress granule marker), and TTP (processing body marker). We compared staining in vulnerable CA1 and resistant CA3 from 1 to 48 hr reperfusion, following 10 min global ischemia in the rat. In both CA1 and CA3 neurons, cytoplasmic poly(A) mRNAs redistributed from a homogenous staining pattern seen in controls to granular structures we term mRNA granules. The mRNA granules abated after 16 hr reperfusion in CA3, but persisted in CA1 neurons to 48 hr reperfusion. Protein synthesis inhibition correlated precisely with the presence of the mRNA granules. In both CA1 and CA3, the mRNA granules colocalized with eIF4G and PABP, but not S6, TIA-1 or TTP, indicating that they were neither stress granules nor processing bodies. Colocalization of HuR in the mRNA granules correlated with translation of HSP70, which occurred early in CA3 (8hr) and was delayed in CA1 (36 hr). Thus, differential compartmentalization of mRNA away from the 40S subunit correlated with translation arrest in post-ischemic neurons, providing a concise mechanism of persistent translation arrest in post-ischemic CA1.
Keywords: hippocampus, HSP70, HuR, mRNA granules, protein synthesis inhibition, stress granules
Introduction
Hippocampal CA1 pyramidal neurons are selectively vulnerable to global ischemia-reperfusion (I/R) injury (Kirino and Sano, 1984; reviewed in Kirino, 2002). This selective vulnerability correlates with a prolonged translation arrest (TA) during reperfusion (reviewed in Hossmann 1993; DeGracia, 2004; DeGracia and Hu, 2007). While it is reasonable to assume that the inability to recover translation contributes to CA1 selective vulnerability, the underlying mechanisms have not been unequivocally established.
Phosphorylation of the alpha subunit of eukaryotic initiation factor 2 [eIF2, alpha subunit, eIF2α; phosphorylated eIF2α, eIF2α(P)], inhibits translation initiation (Clemens, 2001), and occurs in all post-ischemic brain regions immediately with reperfusion (Burda et al., 1994; Kumar et al., 2003). However, eIF2α(P) dephosphorylates by 6–8 hr of reperfusion in all brain regions, including CA1 (DeGracia et al., 1997; Althausen et al., 2001; Kumar et al., 2003; Roberts et al., 2007), and thus, cannot be the cause of prolonged TA in CA1.
Mechanisms of prolonged TA in reperfused CA1 based on ribosome sequestration have recently been reported. The Hu laboratory showed accumulation of ribosomal proteins, initiation factors and cotranslation chaperones in insoluble protein aggregates (PAs), which persist in CA1 (Hu et al., 2000; Liu et al., 2005a; Liu et al., 2005b). We showed, following cardiac arrest and resuscitation (CA/R), the exclusive sequestration of small ribosomal subunit (40S) protein S6 in stress granules (SGs) (Kayali et al., 2005). Both mechanisms preclude protein synthesis by trapping translational machinery in translationally nonfunctional complexes. Because PAs and SGs form by different mechanisms, these pathways are not mutually exclusive (DeGracia and Hu, 2007). Indeed, we showed accumulation of PAs in SGs during late reperfusion (DeGracia et al., 2007) indicating a convergence of these mechanisms of TA.
However, neither of these mechanisms can fully account for prolonged TA in CA1. Exclusive sequestration of 40S subunits in SGs was shown to be ischemia-model dependent and did not occur following bilateral carotid artery occlusion with hypotension (2VO/HT) ischemia (DeGracia et al., 2007). As 2VO/HT ischemia results in selective CA1 death (Smith et al., 1984), SG changes observed following cardiac arrest are therefore not required for CA1 neuronal death. While PAs trap translational components (Liu et al., 2005b), a quantitative trapping of an essential translation component in PAs has not been demonstrated to date. Liu et al. (2005b), for example, showed that accumulation of large and small ribosomal subunit proteins in PAs represented a loss of ~ 20% of microsome-associated ribosomes, and did not evaluate the loss of ribosomes in the cytosolic fraction. In principle, a mechanism of prolonged TA involving subcellular redistribution should: (1) correlate precisely with cell death (2) be ischemia model independent and (3) show quantitative sequestration of an essential translational component(s).
We also reported, following CA/R, that eIF4G formed cytoplasmic structures that persisted in CA1 neurons (DeGracia et al., 2006). Here we show, following 2VO/HT, that these structures contain poly-adenylated mRNAs [poly(A) mRNA], eIF4G, and poly(A) binding protein (PABP), but not the small ribosomal subunit (40S) protein S6, T-cell internal antigen 1 (TIA-1, a marker of SGs; Anderson and Kedersha, 2002) or tristetraprolin (TTP, a marker of processing bodies, or P-bodies; Parker and Sheth, 2007). These “mRNA granules” appear to represent a quantitative redistribution of cytoplasmic mRNAs away from ribosomes. The mRNA granules persisted in CA1 but not CA3 and correlated precisely with regional TA. The colocalization of HuR with the mRNA granules also correlated precisely with translation of the 70 kDa inducible heat shot protein (HSP70). Thus, a dysfunction in mRNA handling specifically in CA1 neurons contributes to both prolonged TA and delayed synthesis of HSP70. Both factors are expected to contribute substantially to the selective vulnerability of CA1 neurons.
MATERIALS AND METHODS
Materials
GAPDH (sc-25778), HuR (sc-5261), TIA-1 (sc-1751) and TTP (sc-8458) antisera were purchased from Santa Cruz Biotechnology, Inc. (Santa Cruz, CA). Mouse monoclonal (2317) and rat polyclonal (2217) S6 ribosomal protein antisera were purchased from Cell Signaling Technology, Inc. (Danvers, MA.). Antisera for phospho-specific (AHO1492) and total (AHO1182) eIF2α were purchased from Invitrogen (formerly Biosource International, Carlsbad, California). Rabbit polyclonal anti-PABP (ab21060) was from Abcam (Cambridge, MA). HSP70 antiserum (SPA-820) was from Stressgen (Ann Arbor, MI). Monoclonal mouse anti-eIF4G directed against a fragment corresponding to nucleotides 288-1811 of the rat sequence has been previously described (Kimball et al., 2003; DeGracia et al., 2006). Alexa FluorR 488 donkey anti-goat IgG, Alexa FluorR 555 donkey anti-rabbit IgG and Alexa FluorR 555 anti-mouse IgG, used for immunofluorescence histochemistry (IF) were purchased from Molecular Probes (Eugene, OR, U.S.A.). Fluoro-Jade was purchased from Histochem, Inc., Jefferson, AR. All other chemicals were reagent grade.
Animal model
All animal experiments were approved by the Wayne State University Animal Investigation Committee and were conducted following the Guide for the Care and Use of Laboratory Animals (National Research Council, revised 1996). All efforts were made to reduce animal suffering and minimize the total number of animals used. Global forebrain ischemia was induced in male Long Evans rats using the bilateral carotid artery (two-vessel) occlusion and hypovolemic hypotension (2VO/HT) model of Smith et al., (1984), as we have previously described (DeGracia et al., 2007; Roberts et al., 2007). Rats were maintained normothermic during the entire ischemia period and for the first hour of reperfusion. Post-surgical animals displaying frank necrosis, weight loss > 15% initial body weight/day, or sustained seizure activity were excluded from the study. Our overall survival rate for the reperfusion groups was 75%. Experimental groups were: sham-operated, nonischemic controls (NIC), 10 min ischemia and reperfusion durations of: 1 hr (1hrR), 8 hr (8hrR), 16 hr (16hrR), 24 hr (24hrR), 36 hr (36hrR), 48, hr (48hrR) and 72 hr (72hrR). For microscopy, there were 5–6 animals per each experimental group. For in vivo translation and Western blotting, there were 4 animals per each experimental group.
Tissue Slice Preparation
At appropriate times, animals were transcardially perfused, and 50 micron slices through the dorsal hippocampus were obtained via vibratome and stored at -20oC in cryostat solution until used, as previously described (Kayali et al., 2005; DeGracia et al., 2006).
Cell death measurements
Toluidine blue staining and Fluoro-Jade staining were performed exactly as described previously (DeGracia et al., 2007). The Fluoro-Jade procedure was exactly that of Schmued et al., (1997). Fluoro-Jade slides were examined using excitation at 488 nm and emission at 518 nm.
Immunofluorescence
Immunofluorescence (IF) procedures were exactly as described previously (Kayali et al., 2005, DeGracia et al., 2006, 2007). For HSP70 staining, antiserum was used at 1:200. Slides were examined on an Axioplan 2 Imaging System (Carl Zeiss, Oberkochen, Germany) equipped with an ApoTome. Excitation at 488 nm and 568 nm, and emission at 518 nm and 600 nm were used for Alexa 488 (green) and Alexa 555 (red), respectively. Optical sectioning was performed using the X63 oil immersion objective to generate z-stacks as previously described (Kayali et al., 2005, DeGracia et al., 2006). Fluorescent micrographs shown in the figures are orthographic projections of 3.5 micron z-stacks (10 x 0.35 micron optical sections), unless otherwise stated.
Fluorescent in situ hybridization (FISH)
Double IF/FISH was performed in a two stage procedure in which the FISH procedure was a modification of that described in Bessert and Skoff (1999). The first stage IF procedure was as described above. The second FISH stage was performed under low light illumination or in the dark. At the end of the IF procedure slices were mounted on lysine-coated slides. IF-stained sections were fixed in 3.6 % formaldehyde in PBS for 10 min at room temperature and then drained and blotted. Prehybridization was carried out in a box humidified with 50% formamide/4X SSC inside an incubator at 32oC for 3 hr in prehybridization buffer (mRNAlocator In Situ Hybridization Kit, Ambion, Austin, TX). Slides were then incubated overnight in the same apparatus in a solution of 50 ng/ml of a 5’-biotinylated 50-mer oligo-dT probe (Integrated DNA Technologies, Inc., Coralville, IA), dissolved in hybridization buffer (mRNA Locator In Situ Hybridization Kit). The next day, all subsequent processing was performed at room temperature. Slides were washed x2 in 2X SSC for 10 min and then incubated in 1:500 Alexa 488-labeled streptavidin (S32354, Invitrogen, Carlsbad, California) in 4X SSC/0.1% Triton X-100 for 60 min. Slides were then washed once in 4X SSC for 10 min followed by incubation in 2X SSC/0.1% Triton X-100 containing 1: 667 of biotinylated goat anti- streptavidin (BA-0500, Vector Laboratories, Burlingame, CA) for 60 min. Slides were again washed once in 4X SSC for 10 min and then incubated in 1:667 Alexa 488-labeled streptavidin in 2X SSC/0.1% Triton X-100 for 60 min. Slides were then washed sequentially in 4X SSC for 10 min and 2X SSC for 10 min, and then coverslipped for viewing. Pair wise stainings were performed for: poly(A) with, eIF4G (1:50), HuR (1:25), PABP (1:250), S6 (1:25), TIA-1 (1:150) or TTP (1:25).
In all cases, the poly(A) staining pattern obtain by performing IF/FISH double-labeling was identical to that obtained by performing FISH by itself. Validation of the specificity of the poly(T) probe for binding RNA was accomplished by preincubating NIC brain slices in 10 U/ml DNAse I (Invitrogen, Carlsbad, California) or 10 U/ml DNAse-free RNAse (Roche Applied Science, Indianapolis, IN) at 37oC, or 0.1M NaOH at 50oC, for 2 hr prior to performing FISH (Martone et al., 1996).
Validation of antisera stainings included (not shown): (1) loss of signal with omission of primary antisera, (2) graded loss of signal with antisera dilution, and (3) agreement with published descriptions of antisera staining patterns where available [e.g. HuR homologs (Gao and Keene, 1996) and TTP (Stoecklin et al., 2004)]. We previously validated the specificity of the S6 and TIA-1 (Kayali et al., 2005), and eIF4G staining (DeGracia et al., 2006).
Semi-quantitative analysis of colocalization
For TIA-1/poly(A) double staining, SGs were counted using the “yellow channel” method previously described (Kayali et al., 2005; DeGracia et al., 2006). “Yellow channels” were constructed from orthographic projections of acquired z-stacks of CA1. Orthographic projections were used to amplify colocalization signal as previously described (Kayali et al., 2005). Colocalization of paired antigens in discreet spots was quantified in BioImage Intelligent Quantifier, as previously described (Kayali et al., 2005; DeGracia et al., 2006). The total number of spots per image was determined and normalized to the number of cells in each image, and averages taken for each experimental group to give values for the “number of spots per cell”.
A semi-quantitative measure of the colocalization of S6 with poly(A) was achieved by taking the integrated density of the entire yellow channel, normalized to the number of cells in each image to produce a value of “density per cell” as previously described (DeGracia et al., 2007). These measurements were made using NIH ImageJ (Abramoff et al., 2004). Groups (n=5–6 per group) were compared by ANOVA followed by Tukey post hoc testing with statistical significance set at p < 0.05.
In vivo translation
Measurement of in vivo protein synthesis was performed as previously described (Kumar et al., 2003), with n =4 animals per each experimental group. Briefly, 1 mCi 35S-methionine/35S-cysteine (Trans 35S-LabelTM, ICN Biomedicals, Inc., Irvine, CA) was administered IV through the femoral vein, 60 min prior to sacrifice. After 60 min, brains were rapidly but carefully dissected on ice, and CA1, CA3 and cerebellum were further microdissected as previously described (DeGracia et al., 2007). Regions CA1 and CA3 were pooled bilaterally (recovered wet weights of each region were between 7–10 mg) and then sonicated at 1:10 wt:vol in buffer containing 7 M urea, 2 M thiourea, 0.4% CHAPS, 10 mM DTT, 1 mM PMSF, 4 μg/ml aprotinin, 4 μg/ml leupeptin, and 2 μg/ml pepstatin A. Thirty five microliters of each homogenate were spotted onto individual Whatmann GF-A glass fiber filters that had been prewet in 10% TCA, 1.6 % unlabeled methionine and 0.4 % unlabeled cysteine. Filters were incubated in this same solution for 15 min at 4°C with rocking, washed twice with cold 5% TCA, and sequentially dried in 100% ethanol and 100% acetone. 35S incorporation into TCA-precipitable material was quantified by liquid scintillation counting Protein concentrations were determined in homogenate aliquots using the Folin phenol reagent method.
To account for slight animal-to-animal variations of in vivo specific activity, incorporation, in dpm/μg protein/min, for the CA1 and CA3 regions of each animal were normalized and expressed as a percentage of incorporation in the cerebellum. This procedure was feasible because cerebellum does not undergo ischemia in the 2VO/HT model (Smith et al., 1984). Pilot studies showed that total in vivo incorporation in cerebellum, CA1 and CA3 were statistically indistinguishable in NIC rats (average of all three brain regions was 0.26 +/- 0.08 dpm/μg protein/min, ANOVA p = 0.564). Normalized translation rates were compared amongst groups by ANOVA, followed by Tukey post hoc testing to show P < 0.05 compared to the NIC groups for each region.
Western blotting
Fifty microgram samples of CA1, CA3 or cerebellum homogenates were run per lane on 10% SDS-PAGE gels, electroblot transferred to nitrocellulose, and Western blotted for phosphospecific (1:750) or total (1:1000) eIF2α or GAPDH (1:1000) as previously described (Roberts et al., 2007). Thapsigargin treated NB104 cells were used as a positive control for eIF2α (P), as described previously (Kumar et al., 2003). Band densitometry was quantified in BioImage Intelligent Quantifier (Jackson, MI), and groups compared by ANOVA and Tukey Post hoc with p < 0.05.
RESULTS
Cell death and model validation
Figure 1 shows representative micrographs of cell staining for CA1 and CA3 over the reperfusion durations used in the present studies. As per previous reports (Smith et al., 1984; Hu et al. 2000; Liu et al., 2005a, 2005b; DeGracia et al., 2007), cell death was observed exclusively in CA1 at 72hR after 10 min 2VO/HT ischemia. No changes in cell numbers were observed at 24 hr or 48 hr reperfusion in CA1 or CA3. The bottom panels of Figure 1 show that Fluoro-Jade staining was observed only in 72hR CA1, consistent with the loss of toluidine blue staining in this group. This data validates that the 2VO/HT model leads to the selective vulnerability of CA1 pyramidal neurons.
Figure 1.

Cell staining of hippocampal CA1 and CA3 following ischemia and reperfusion. Toluidine blue staining of 50 micron sections through dorsal hippocampus as indicated (Rows 1 and 2). Fluoro-jade labeling of nonischemic control (NIC) and at 72 hr reperfusion (72hR) as indicated (Row 3). Scale bar is 100 microns and applies to all panels.
In vivo translation
Figure 2A shows results of in vivo translation measurements in microdissected CA1 and CA3 normalized to cerebellum. We evaluated only to 48 hr reperfusion to avoid the possibility of cell death being a contributor to decreased in vivo translation rates. Cerebellum showed no change in translation compared to NICs during the entire reperfusion time course. Translation arrest was observed in both CA1 and CA3 with early reperfusion. However, translation gradually recovered in reperfused CA3. At 36hR and 48hR, translation in CA3 averaged ~80% of NICs, although statistically indistinguishable from NICs. In CA1 there was a recovery to about 35% controls at 8hR which declined after this time. Translation in CA1 after 8hR was indistinguishable from the 1hR samples. This data illustrates the well-established correlation between CA1 selective vulnerability (Figure 1) and persistent translation arrest (Hossmann, 1993).
Figure 2.

In vivo protein synthesis and eIF2α phosphorylation following ischemia and reperfusion. (A) In vivo translation in NICs, and from 1-48 hr reperfusion (1hR...48hR) expressed as a percentage of incorporation in cerebellum at each time point for each animal. (n=4 per group, mean +/- standard deviation). * Tukey post hoc p < 0.05 as compared to respective NICs. ANOVA p for cerebellum = 0.381. & indicates samples in which the respective brain region showed mRNA granules in their cytoplasm. (B) Western blots of microdissected brain regions (50 μg/lane) for eIF2α(P), total eIF2α, and GAPDH, the latter used as a normalizer. Experimental groups as indicated. Lanes 1, 4, 7, 10, 13, 16, 19 representative samples of CA1. Lanes 2, 5, 8, 11, 14, 17, 20 representative samples of CA3. Lanes 3, 6, 9, 12, 15, 18, 21 representative samples of cerebellum (CER). Lane tg+ is thapsigargin-treated NB104 cells, used as a positive control for eIF2α(P) as described previously (Kumar et al., 2003). (C) Densitometry of eIF2α(P) Westerns normalized to GAPDH levels (n=4 per group, mean +/-standard deviation). * Tukey post hoc p < 0.05 as compared to respective NICs for CA1 and CA3. ANOVA p for cerebellum = 0.711.
Phosphorylation of eIF2α
Phosphorylation of the alpha subunit of eIF2 was assessed in the same samples used for in vivo translation (Figure 2B). There was no change in the levels of total eIF2α(ANOVA p = 0.761) or GAPDH (ANOVA p = 0.586), the latter used as a normalizer (Figure 2B). We observed a statistically significant ~ 2.3-fold increase in eIF2α(P) only in CA1 and CA3 in the 1hR samples (Figure 2C, ANOVA p = 0.021 and 0.017 for CA1 and CA3, respectively). Levels of eIF2α(P) in cerebellum did not change (ANOVA p = 0.718). Hence, phosphorylation of eIF2α would be expected to contribute to translation arrest at 1hR, but cannot account for the persistent translation arrest at reperfusion durations > 1hr.
Microscope observations
We preface our description of the microscopy results by stating that all of our descriptive observations to follow occurred at 100% frequency in each group. The exact number of animals in each group (in parentheses) were: NIC(6), 1hR(6), 8hrR(6), 16hR(6), 36hR(5) and 48hR(5). Here we systematically compare hippocampal regions CA1 and CA3. In the course of our observations we also evaluated the hippocampal hilus and dentate gyrus as well as the cerebral cortex. Because these other brain regions: (1) did not show cell death in the ischemia model, and (2) behaved identically to CA3 as described below, we show only CA3 results as representative of an ischemia-resistant brain region.
FISH detection of poly(A) mRNA
FISH signal for poly(A) mRNA was eliminated when slices were pretreated with 10 U/ml RNAse or 0.1 M NaOH, but not 10U/ml DNAse, for 60 min at 37oC, prior to FISH (Figure 3), providing evidence that the poly(T) probe detected RNA and not DNA.
Figure 3.

Validation of fluorescent in situ hybridization (FISH). Fluorescence photomicrographs of NIC CA1 following treatments as indicated in labels. Probe for detecting poly-adenylated mRNAs was a biotinylated 50-mer poly-thymidine (poly T) probe. Treatment with 10 U RNAse A/ml or 0.1 N NaOH ablated poly(A) signal, but not treatment with 10U/ml DNAase I. Scale bar, 10 microns, applies to all panels.
Figure 4 shows poly(A) mRNA staining in CA1 and CA3 in NICs and from 1 to 48 hr reperfusion. In both regions in NIC samples, the poly(A) FISH signal showed three distinct components: (1) a diffuse homogeneous cytoplasmic staining, (2) a punctate cytoplasmic staining, and (3) staining of up to a dozen relatively large (0.5–2 micron) and round bodies in the nucleus. These results are essentially identical to a previous report of poly(A) FISH staining of CA1 pyramidal neurons (Martone et al., 1996). The co-staining pairs we performed (see ahead) showed that, in the NIC group, the punctate cytoplasmic poly(A) staining colocalized with eIF4G, TIA-1, S6, and to a lesser extent with PABP and TTP, but not with HuR. Each of these components has previously been shown to be components of SGs (Anderson and Kedersha, 2006). Therefore, the pun ctate cytoplasmic poly(A) staining represented SGs, supporting our previous observations of SGs in neurons of the normal brain (Kayali et al., 2005; DeGracia et al., 2006, 2007).
Figure 4.
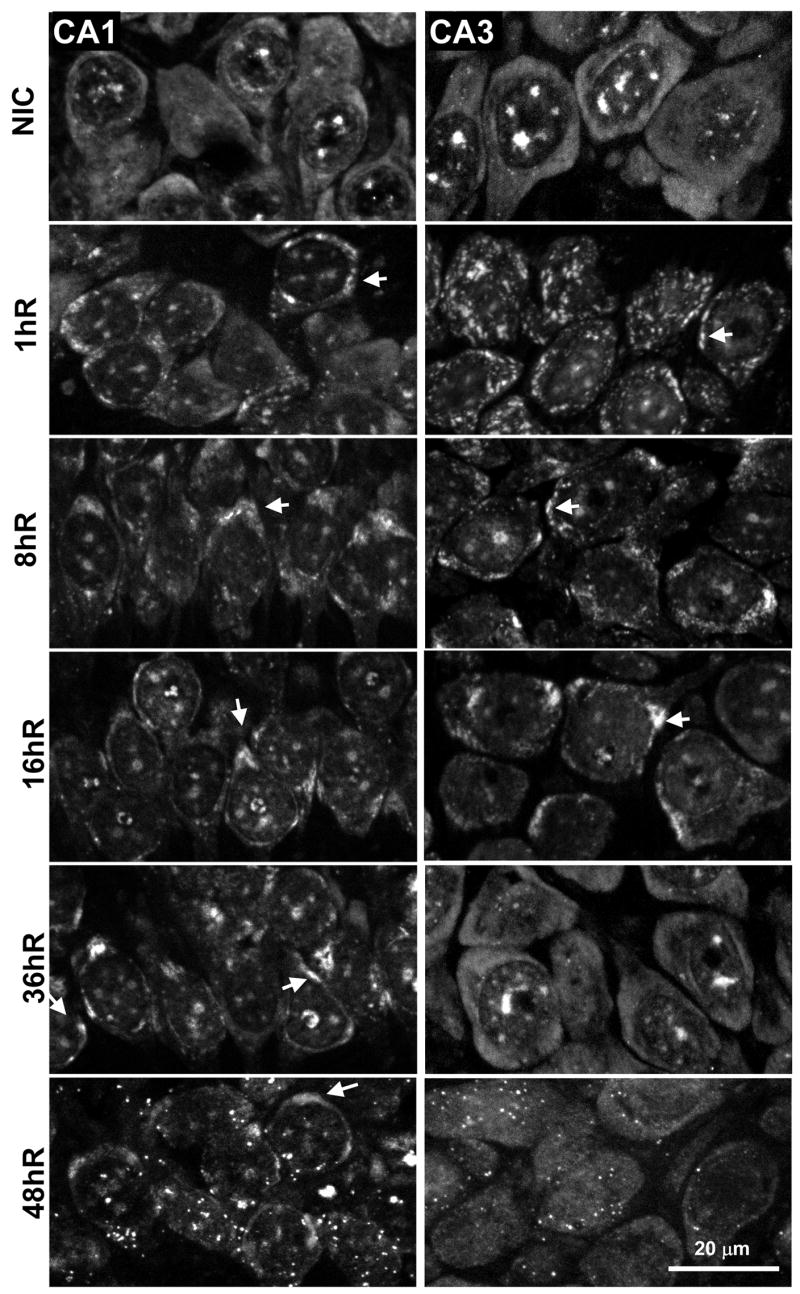
Staining for poly-adenylated [poly(A)]-containing mRNAs in nonischemic controls (NIC) and from 1 – 48 hr reperfusion (1hR-48hR, respectively). Fluorescent photomicrographs of CA1 (left column) and CA3 (right column) pyramidal layer of representative samples (n=5-6 per group) from experimental groups as indicated. Images are derived from orthographic projections of a 3.5 micron z-stack taken under 63X oil immersion. Arrows denote mRNA granules (see text). Scale bar is 20 microns and applies to all panels.
Following reperfusion, there was no change in the nuclear or SG poly(A) staining components. However, at 1hR, the diffuse cytoplasmic staining underwent an apparently quantitative rearrangement in both CA1 and CA3. There was a generalized loss of diffuse cytoplasmic staining and the appearance of irregular clusters of intense, concentrated poly(A) staining. We designate these structures as “mRNA granules”, examples of which are marked by white arrows in Figure 4. The mRNA granules were especially prominent and obvious in CA3 neurons due to their larger cytoplasmic area. The 8hR and 16hR samples showed essentially identical staining patterns in both CA1 and CA3: the smaller mRNA granules seen at 1hR were now replaced by up to several larger concentrations of poly(A) cytoplasmic staining. After 16hR, the poly(A) staining pattern between CA1 and CA3 significantly diverged. At 36hR and 48hR, the poly(A) staining returned to a diffuse pattern in CA3, resembling NICs. However, the mRNA granules persisted in CA1 at 36hR and 48hR. The reversible pattern of mRNA granule formation described here for CA3 was also observed in dentate granule cells, hilar interneurons, and the pyramidal neurons of layers II/III, V, and IV of the cerebral cortex at the level of the dorsal hippocampus (data not shown).
We note that the presence of the mRNA granules correlated precisely with inhibition of in vivo protein synthesis in CA1 and CA3. The time points in which mRNA granules were present were also the time points that showed in vivo translation rates statistically below controls; these groups are marked by an ampersand (&) in Figure 2. This one-to-one correlation suggests a relationship between the mRNA granules and TA.
Colocalization of mRNA binding proteins and poly(A) mRNAs
We assessed the colocalization, by double labeling with IF and FISH, of poly(A) with the following mRNA binding proteins: (1) eIF4G, a subunit of the eIF4F complex that delivers mRNA to the 40S subunit during translation initiation (Gingras et al., 1999), (2) Poly(A) binding protein (PABP), which binds the 3’ poly(A) tail, and contributes to a number of translation functions (Mangus et al., 2003) (3) S6, a protein of the 40S ribosomal subunit, (4) TIA-1, a component of SGs (Anderson and Kedersha, 2002), (5) TTP, a component of P-bodies (Stoecklin et al., 2004), and (6) HuR, an mRNA binding protein known to stabilize adenine and uridine rich element (ARE)-containing mRNAs (Keene, 1999). These costaining pairs are shown in Figures 5 and 6, in which arrows point to mRNA granules and arrowheads are used to point to SGs.
Figure 5.
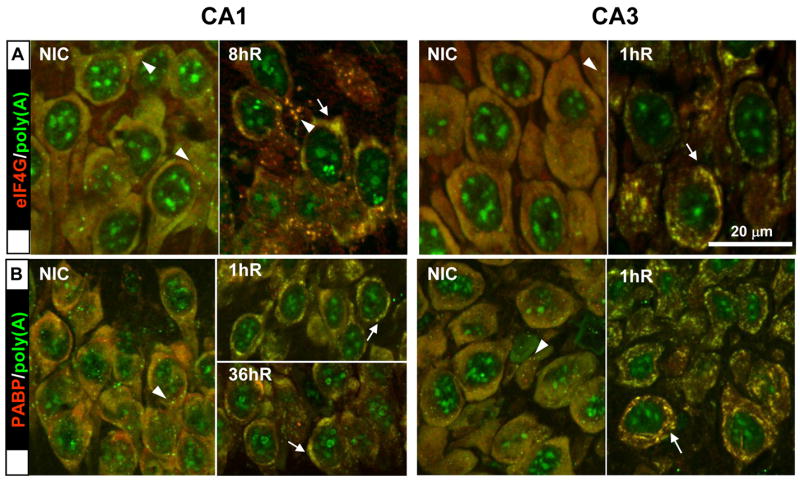
Proteins that colocalized with mRNA granules during reperfusion. Costaining of (A) eIF4G and poly(A), and (B) PABP and poly(A). Fluorescent colors associated with each staining pair are indicated in row labels. Merged fluorescent photomicrographs of representative samples (n=5-6 per group) from experimental groups as indicated. Orthographic projects were derived as described in legend to Figure 4. Scale bar is 20 microns and applies to all panels. Arrows point to mRNA granules, arrowheads point to stress granules as described in the Results section.
Figure 6.

Proteins that did not colocalize with mRNA granules during reperfusion. Costaining of: (A) TIA-1 and poly(A); (B) TTP and poly(A); (C) TIA-1 and TTP; (D) S6 and poly(A). Fluorescent colors associated with each staining pair are indicated in row labels. Merged fluorescent photomicrographs of representative samples (n=5-6 per group) from experimental groups as indicated. Orthographic projects were derived as described in legend to Figure 4. Scale bar is 20 microns and applies to all panels. Arrows point to mRNA granules, arrowheads point to stress granules as described in the Results section.
eIF4G, PABP & poly(A)
eIF4G and PABP are described together because their staining patterns were the same across experimental groups (Figure 5). In CA1 and CA3 of NICs, eIF4G and PABP staining were cytoplasmic as we previously showed for eIF4G (DeGracia et al., 2006). For both antisera, the cytoplasmic staining took two forms in NICs: a diffuse staining and a punctate staining. Both the diffuse and the punctate cytoplasmic staining of each protein colocalized with the equivalent cytoplasmic staining of poly(A), producing in each case a diffuse yellow cytoplasm containing yellow punctate particles (Figure 5A and 5B, NIC samples). For eIF4G the diffuse colocalization likely represented their binding to mRNAs undergoing translation initiation. PABP diffuse colocalization likely represented PABP associated with mRNAs on translating cytoplasmic ribosomes. The punctate cytoplasmic staining represented colocalization with poly(A) mRNA in SGs (Figure 5A and 5B, arrowheads).
Following reperfusion, eIF4G and PABP clearly colocalized with the mRNA granules in both CA1 and CA3. In each costaining pair, the mRNA granules showed an intense yellow color in merged images (Figure 5A and 5B, reperfused, arrows). In all samples in which mRNA granules were observed, they colocalized with eIF4G and PABP. In the individual channels for eIF4G and PABP, prominent cytoplasmic granules were present, similar to those we previously reported for eIF4G (DeGracia et al., 2006). At 36hR and 48hR in CA3, the costaining patterns for both proteins with poly(A) reverted to that seen in NICs (not shown).
TIA-1 and poly(A)
The TIA-1 staining pattern obtained when costaining with poly(A) FISH was identical to that which we previously described (Kayali et al., 2005). That is, TIA-1 was predominantly nuclear, with punctate cytoplasmic staining. In NICS, the punctate TIA-1 staining colocalized with the punctate poly(A) staining (Figure 6A, NIC CA1 and CA3, arrowheads), providing our main evidence that the punctate poly(A) staining represented SGs. Nuclear TIA-1 staining did not significantly colocalize with nuclear poly(A) staining in any control or reperfused samples.
During reperfusion, there was no colocalization of TIA-1 with the mRNA granules (Figure 6A, reperfused, arrows), indicating that the mRNA granules were not SGs. In fact, the mRNA granules (Figure 6A, arrows) and SGs (Figure 6A, arrowheads) were mutually visualized in the neurons with poly(A)/TIA-1 costaining. The SGs formed small circular yellow colocalizations of TIA-1 and poly(A), whereas the mRNA granules were larger, irregular shaped and stained only green for poly(A).
Since cytoplasmic TIA-1 colocalized only with poly(A) in the form of SGs (and not the mRNA granules), this afforded us the opportunity to count SGs using the “yellow channel” method we had previously developed for this purpose. Shown in Figure 8A are the results of counting the TIA-1/ poly(A) SGs in CA1. In spite of apparent changes in intensity of TIA-1/poly(A) SGs (e.g. compare NIC and 1hR CA1, Figure 6A), in both CA1 and CA3 (data not shown) there was no change from NICs in the number of SGs at any reperfusion time point. However, although the total number of SGs did not change, SGs did undergo changes in reperfusion, as discussed in the next section.
Figure 8.

Semi-quantitation of colocalization. (A) Counting of stress granules (SGs) in CA1. Left, the number of SGs per cell (mean +/- standard deviation, n = 5-6 per group) in CA1 of experimental groups as indicated. Yellow channels (right, showing representative samples) were constructed from orthographic projections of 3.5 micron z-stacks acquired under 63X oil immersion of TIA-1/poly(A) staining. ANOVA p = 0.468. (B) Left, integrated density (arbitrary units) of colocalization of poly(A) and S6 in CA1 and CA3 (mean +/- standard deviation) of experimental groups as indicated. ANOVA p was 0.070 for CA1, and 0.015 for CA3. *, post hoc p < 0.05 compared to NIC group. Right, representative yellow channels from CA3 samples.
TTP and poly(A)
We report here, to our knowledge, the first immunomapping of TTP in reperfused brain, and an assessment of its costaining with poly(A) (Figure 6B). In NICs, the TTP staining was similar to that of TIA-1 in that it was predominantly nuclear, in agreement with published TTP staining in other cell types (Stoecklin et al., 2004). However, in NICs, TTP did not significantly colocalize with the SG staining component of poly(A) (Figure 6B, NIC, arrowheads), suggesting it is not a major constituent of SGs in control neurons.
In reperfused CA1 and CA3 neurons showing mRNA granules, TTP did not colocalize with the mRNA granules (Figure 6B, arrows).
However, in both CA1 and CA3, we observed colocalization of TTP in poly(A) SGs starting at 8hR and peaking at 16hR (Figure 6B, reperfused, arrowheads). Increased colocalization of TTP and poly(A) in cytoplasmic SGs corresponded with a decrease in the nuclear TTP signal. This colocalization decreased at 36hR, and was no longer evident at 48hR in both CA1 and CA3 (data not shown). This data suggests that: (1) TTP exported from the nucleus and entered cytoplasmic SGs during reperfusion, but that (2) TTP interaction with cytoplasmic SGs was reversible. To confirm that TTP entered SGs, double-labeling IF with TIA-1 and TTP was performed (Figure 6C). We observed colocalization of TIA-1 and TTP in cytoplasmic particles that paralleled the colocalization of TTP with poly(A), supporting the conclusion that TTP entered cytoplasmic SGs.
As TTP behaved identically in CA1 and CA3 neuronal SGs (Figure 6B and 6C), TTP changes did not correlate with selective vulnerability. That TTP destabilizes ARE-containing mRNAs (Stoecklin et al., 2004), its presence in SGs may represent degradation, possibly of stress-induced ARE-containing mRNAs such as c-fos or hsp70, during reperfusion.
S6 and poly(A)
In NICs of CA1 and CA3 colocalization of S6 and poly(A) caused a diffuse yellow cytoplasm and yellow punctate cytoplasmic staining (Figure 6D, NIC). The former likely represented mRNAs being translated on cytoplasmic ribosomes, the latter represented 40S subunits and mRNAs sequestered together in SGs (Figure 6D, NIC, arrowhead).
During reperfusion, in CA1 from 1hR to 36hR, and in CA3 at 1hR and 8hR, the S6 did not colocalize with the mRNA granules (Figure 6D). At these time points, the prominent green mRNA granules were visible against a diffuse red S6 staining in the cytoplasm. Colocalization of poly(A) and S6 in SGs were apparent (Figure 6D, 16hR, arrowheads). In CA3 at 36hR (Figure 6D) and 48hR (not shown), the mRNA granules were no longer observed, and S6/poly(A) costaining reverted back to that seen in NICs.
At 16hR in CA3 and 48hR in CA1, there was an increased yellow hue to the mRNA granules (Figure 6D, 48hR CA1 and 16hR CA3, arrows). However, at these time points, S6 did not form distinct granular structures in the cytoplasm (Figure 7, S6 channels). To further assess the nature of this ostensible colocalization, linear densitometry was determined in both the red and green channels for CA3 at 8hR and 16hR and for CA1 at 36hR and 48hR (Figure 7). Densities were taken through individual mRNA granules (Figure 7, between arrows) and plotted as a function of distance. In mRNA granules of 8hR CA3 and 36hR CA1 neurons, the density of the green channel was greater than that of the red channel (Figure 7, left graphs) and the ratio of the green to red channel densities was greater than one (Figure 7, right graphs, black curves). The opposite result occurred with 16hR CA3 and 48hR CA1 (Figure 7, middle graphs and right graphs, blue curves). Therefore, the apparently increased colocalization of S6 and poly(A) in the mRNA granules of 16hR CA3 and 48hR CA1 was not due to a concentration of S6 in the mRNA granules, but was due to a decrease in poly(A) staining intensity relative to S6 in the mRNA granules. These calculations are consistent with the interpretation that, at 16hR in CA3 and 48hR in CA1, the mRNA granules were beginning to dissipate.
Figure 7.

Linear densitometry through mRNA granules. Photomicrographs of merged, red S6 and green poly(A) channels of individual CA1 and CA3 pyramidal neurons of experimental groups as indicated. Arrows denote the start and end points for linear densitometry though individual mRNA granules. Relative location of arrows is maintained through each triplet of micrographs. Left and middle graphs are plots of channel density as a function of distance between left and right arrows. Green lines are the green poly(A) channels and red lines are the red S6 channels, and the Y axis labels identify the respective experimental groups. Right graphs are the ratio of the green to the red channels plotted as a function of distance, and curves are as designated in the insets.
To get a quantitative sense of the temporal progression of S6/poly(A) double-labeling in both CA1 and CA3, we performed densitometry of the entire yellow channel as described previously (DeGracia et al., 2007). Densitometry results, along with representative yellow channels of the CA3 samples, are shown in Figure 8B. In CA1, the average density of channel overlap in NICs was higher than all the reperfusion groups, and the difference was close to being statistically significant (ANOVA p = 0.070). In CA3, a statistically significant decrease in S6/poly(A) colocalization was observed in the 1hR and 8hR groups (ANOVA p = 0.015), but from 16hR onwards was indistinguishable from NICs. Although they represent only an approximation, these results reinforce the qualitative observation that there is decreased colocalization of S6 and poly(A) during the entire reperfusion time course in CA1, and during early reperfusion in CA3.
Thus, S6 generally did not colocalize with the mRNA granules. Additionally, there was a 1:1 correlation between inhibited protein synthesis and the presence of the mRNA granules (Figure 2). We therefore conclude that the mRNA granules sequestered mRNA away from ribosomes. As mRNA is an essential component of protein synthesis, the compartmentalization of mRNA away from ribosomes provides a novel mechanism of prolonged TA in reperfused neurons.
HuR and poly(A)
Again, to our knowledge, this is the first investigation of HuR immunomapping, and an assessment of its colocalization with poly(A) mRNAs following brain reperfusion (Figure 9). In NICs, HuR showed a staining pattern in neurons essentially identical to that previously reported for its homolog HuB (Gao and Keene, 1996). HuR was mainly nuclear localized, but also showed a diffuse cytoplasmic staining of lesser intensity than the nuclear staining. We note that, in the interneurons of CA1 (Figure 9, NIC, CA1, large arrow) and CA3 (not shown), the cytoplasmic HuR staining was much more intense than in the pyramidal cells. In pyramidal neurons, the colocalization of HuR and poly(A) resulted in an “olive” colored cytoplasm, representing a small degree of colocalization between cytoplasmic HuR and the diffuse component of the poly(A) cytoplasmic signal. Additionally, the HuR nuclear signal showed “holes” within which the poly(A) nuclear staining tended to fit, almost like pieces of a puzzle, so there was no overlap between HuR and poly(A) nuclear staining patterns.
Figure 9.

Co-immunofluorescence (IF) and FISH for HuR and poly(A) in NIC and from 1hR-48hR. Merged fluorescent photomicrographs of CA1 (left column) and CA3 (right column) pyramidal layer of representative samples (n=5-6 per group) from experimental groups as indicated. Orthographic projects were derived as described in legend to Figure 4. Arrows denote mRNA granules (see text). Scale bar is 20 microns and applies to all panels.
Upon reperfusion, different patterns of HuR/poly(A) colocalization were obtained for the CA1 and CA3. At 1hR, 8hrR and 16hR in CA1, HuR remained mainly nuclear and there was no colocalization with the cytoplasmic mRNA granules. At 36hR and 48hR in CA1, HuR showed colocalization with the cytoplasmic mRNA granules. In CA3, HuR colocalized with mRNA granules at all time points they were observed in CA3 neurons (e.g. 1hR, 8hR, and 16hR). At 36hR and 48hR in CA3, the colocalization pattern reverted back to that of the NIC group. Therefore, there was at least a 35 hour delay in HuR colocalizing with the mRNA granules in CA1 compared to CA3.
HSP70 translation
Immunostaining for HSP70 is shown in Figure 10. When observed, HSP70 staining was extremely pronounced, resulting in what had been previously described as a “Golgi-like” staining pattern (Simon et al., 1991), in which the entire cell body, including extensive dendrite branching became labeled. In CA3, robust HSP70 staining occurred at the 8hR and 16hR time points. By 36hR in CA3, a much weaker HSP70 signal was obtained, confined predominantly to the nucleus and punctate cytoplasmic foci. By 48hR, the CA3 HSP70 signal was very weak. In contrast, in CA1 at 8hR, HSP70 staining was very weak. By 24hR in CA1, staining was detectable but still relatively weak. By 36hR, CA1 neurons were strongly stained with HSP70, which persisted at 48hR. These results are consistent with our recent quantification of HSP70 transcription and translation by PCR and Western blot, respectively, of microdissected CA1 and CA3, where we showed a similar early translation of HSP70 in CA3 (by 8hR) and a much delayed translation in CA1 (seen by 30hR in that study) (Roberts et al., 2007).
Figure 10.

Immunofluorescent photomicrographs of HSP70 in CA1 (left column) and CA3 (right column) pyramidal layer of representative samples (n=5-6 per group) from experimental groups as indicated. Orthographic projects were derived as described in legend to Figure 4. Scale bar is 20 microns and applies to all panels.
We note here another one-to-one correlation: samples that showed HuR in the mRNA granules also showed robust translation of HSP70 protein, with the exception of the 1hR CA3. In the latter case, previous studies have shown that hippocampal neurons do not begin synthesis of hsp70 mRNA until at least several hours into reperfusion (Vass et al., 1988; DeGracia et al., 1993; Roberts et al., 2007), precluding synthesis of the protein at this early time point. As hsp70 mRNA stability is regulated by a 3’-UTR ARE sequence (Laroia et al., 1999), the correlation between the colocalization of HuR in the mRNA granules and appearance of HSP70 protein in the same neurons is likely of functional significance.
DISCUSSION
Subcellular redistribution of translational machinery plays an important role in translation regulation in pathological circumstances (reviewed in Anderson and Kedersha, 2006). Because brain I/R results in a profound TA in selectively vulnerable neurons (Hossmann, 1993), the purpose of the present study was to assess if changes in the subcellular distribution of mRNA and translation regulators contributed to prolonged TA in vulnerable neurons.
To this end, the present study has resulted in several novel findings: (1) cytoplasmic poly(A) mRNAs redistributed into mRNA granules, a compartment distinct from both SGs and P-bodies, (2) the mRNA granules did not colocalize with S6, and by extension, 40S subunits, (3) the presence of mRNA granules in post-ischemic neurons correlated precisely with in vivo TA, and hence, cell death, and (4) colocalization of HuR with the mRNA granules correlated with translation of HSP70. Although our results are largely descriptive, these observations provide an essential framework around which new mechanistic hypotheses can be further developed. As mRNA is an essential translation component, its compartmentalization in the mRNA granules away from 40S subunits suggests a clear-cut mechanism of prolonged TA in reperfused neurons. The correlation between the HuR content of the mRNA granules and HSP70 synthesis further suggests mRNA granules are involved in post-transcriptional stress gene regulation in reperfused neurons.
Subcellular structures in reperfused neurons
To date, four subcellular structures have been identified in reperfused neurons: (1) ubiquitin-protein clusters (ubi-protein clusters), and (2) protein aggregates (PAs) (Hu et al., 2000; Liu et al., 2005a; Liu et al., 2005b), (3) SGs (Kayali et al., 2005; DeGracia et al., 2007), and (4) aggregates of eIF4G (DeGracia et al., 2006). It is appropriate to ask how these relate to the mRNA granules observed in the present study.
Ubi-protein clusters and PAs appear to be related as they are both marked by ubiquitin immunostaining in situ (Hu et al., 2000). Ubi-protein clusters form early in reperfusion in all post-ischemic neurons, but are reversible in resistant neurons (Hu et al., 2000; DeGracia et al., 2007). In vulnerable neurons at later reperfusion, the ubiquitin immunostaining transforms to take the form of PAs, suggesting that the PAs somehow derive from the ubi-protein clusters (DeGracia and Hu, 2007). Under the microscope, the ubi-protein clusters are large (~2–5 microns) irregular domains of ubiquitin staining, and the PAs are punctate ubiquitin-containing particles of 200–500 nm, best visualized under the electron microscope. Thus, the particles marked by ubiquitin immunoreactivity persist in vulnerable neurons and become smaller as reperfusion progresses (Hu et al., 2000; reviewed in DeGracia and Hu, 2007). However, the mRNA granules observed here became larger with reperfusion duration (Figure 4). Additionally, we previously showed PAs to colocalize with TIA-1 at 48 hr reperfusion (DeGracia et al., 2007). However, TIA-1 did not colocalize with mRNA granules at any time point in the present study. These data therefore argue that the mRNA granules are not the same structures that are marked by ubiquitin immunostaining.
We can also conclude that the mRNA granules are not SGs. Again, the morphology of the two particles was very different: SGs form circular punctate structures, but the mRNA granules were irregular domains occupying wide areas of cytoplasm. The mRNA granules lacked TIA-1 (Figure 6A), presumably a canonical component of SGs (Anderson and Kedersha, 2006). Finally, we could simultaneously visualize both the mRNA granules and SGs in the same neuron, proving their distinct identities (e.g. Figure 6A).
We previously showed following CA/R ischemia the formation of aggregates of eIF4G that persisted in reperfused CA1 pyramidal neurons (DeGracia et al., 2006). In the present study using 2VO/HT ischemia, we also observed aggregates of eIF4G that precisely colocalized with the mRNA granules (Figure 5A). The morphology of the eIF4G aggregates was identical in both studies making plausible the assumption that the previously identified eIF4G aggregates were markers of mRNA granule formation. If validated, the mRNA granules would provide a mechanism of prolonged TA common to both the CA/R and 2VO/HT models.
The mRNA granules
Although many cerebral I/R investigations have looked at changes in individual mRNAs with in situ hybridization or PCR, few studies have evaluated markers of total mRNA following brain I/R. In one such study, Matsumoto et al. (1990) showed a subcellular redistribution of mRNA by gradient centrifugation, concluded mRNA transport was altered following brain I/R, and suggested this may contribute to the TA associated with selective vulnerability. Our present observations support this suggestion. However, the Matsumoto et al. (1990) study offered no rationale underlying the change in mRNA distribution.
Our present understanding of translation regulation in reperfused neurons offers such a rationale. Phosphorylation of eIF2α occurs with the onset of reperfusion (Kumar et al., 2003) resulting in translation initiation inhibition, polysome dissociation, and resultant TA. Focus on ribosome regulation has diverted attention from the issue of what happens to mRNA when polysomes dissociate. We suggest that the mRNA granules form in response to polysome dissociation, possibly to, in part, sequester, preserve and silence neuronal “housekeeping” mRNAs. In this role, the mRNA granules are likely protective as they formed in all post-ischemic neurons.
The translational control literature offers further insight into the potential nature of the mRNA granules. A recent report showed that glucose, but not amino acid, deprivation in yeast lead to redistribution of cytoplasmic mRNAs in structures termed EGP granules that contained eIF4E, eIF4G and PABP, but lacked the P-body markers decapping enzymes Dcp1p and Dcp2p (Hoyle et al., 2007). The mRNA granules identified here also colocalized with eIF4G and PABP but not the P-body marker TTP. Given that ischemia is a form of severe neuronal glucose deprivation, the mRNA granules identified here may be the neuronal counterpart of the yeast EGP granules. It was suggested by Hoyle et al. (2007) that EGP granules may serve a function analogous to SGs, which is to route mRNAs to appropriate compartments within the cell (Anderson and Kedersha. 2006). However, the colocalization of HuR in the mRNA granules (Figure 9) suggests a different but related function.
Several laboratories have identified ELAV or Hu granules, which also are granular cytoplasmic mRNA formations that contain HuR or its homolog HuB (reviewed in Keene, 1999). Evidence suggests that the ELAV/Hu granules partition functionally related mRNAs, allowing for their coordinated regulation in terms of translation, silencing or degradation (Keene and Lager, 2005). This type of functional mRNA coordination has been observed following cell stress, in which well-known immediate early genes (IEGs) such as c-fos and c-myc are coordinately translated because many stress-induced mRNAs contain an ARE sequence (Atasoy et al., 1998; Brennan et al., 2000; Chen et al., 2002). The mRNA for HSP70 also contains a 3’-ARE (Laroia et al., 1999) and HuR activity has been implicated in the heat shock response (Gallouzi et al., 2000, 2001). It is well established that many stress genes are induced with reperfusion (reviewed in Nowak, 1993; Kogure and Kato, 1993; Akins et al., 1996; Koistinaho and Hokfelt, 1997). Therefore, in addition to silencing “housekeeping” mRNAs, the correlation between HuR/mRNA granule colocalization and HSP70 translation suggests that the mRNA granules may also function to coordinate stress gene expression in the reperfused brain. Or in other words, the mRNA granules identified here may represent a morphological correlate of the selective regulation of stress-induced mRNAs while normal neuronal translation is silenced.
Differences between CA1 and CA3
It is well established that, following the durations of ischemia used in the present study, CA1 pyramidal neurons show a profound and irreversible TA (Hossmann, 1993) and that there is either a delay in or no translation of HSP70 (Vass et al., 1988; Simon et al., 1991; Nowak, 1993). It has been proposed that these are linked insofar as the TA in CA1 will preclude synthesis of HSP70 (White et al., 2000). However, it well-established that HSP70 is translated under conditions where general protein synthesis is inhibited (Panniers, 1994). In fact, exclusive synthesis of HSPs in reperfused hippocampus has been reported (Kiessling et al., 1986). Additionally, induced stress proteins such as HSP70 are crucial to recovery of general translation (DiDomenico et al., 1982; Van Nieuwenhoven et al., 2001; Ron 2002; Gilks et al., 2004). Therefore, the direction of causality is not that TA prevents HSP70 translation in CA1, but the reverse: delayed synthesis of HSP70 prevents translation recovery, and hence causes prolonged TA. The differential behavior of the mRNA granules between CA1 and CA3 described here provides a deeper level linking these events.
Specifically, we propose the following sequence of events to underlie translation arrest and recovery. (1) I/R triggers eIF2α phosphorylation and polysome dissociation, (2) mRNA granules form to protect and silence “housekeeping” mRNAs, (3) HuR entrance into the mRNA granules serves as a marker of the coordinated regulation of stress-induced mRNAs, (4) selective translation of stress mRNAs, including HSP70 synthesis, occurs, leading to, (5) dissipation of the mRNA granules and recovery of global translation. Thus, there is a failure in the timely synthesis of stress proteins such as HSP70 in CA1, and our results indicate that the delayed entrance of HuR into the mRNA granules is an upstream event marking this failure. Our results therefore highlight the following questions: (1) Why is there a delay in HuR entering the mRNA granules in CA1? (2) How does HuR in the mRNA granule facilitate HSP70 translation? (3) By what mechanism does HSP70 protein contribute to mRNA granule dissipation and general translation recovery?
HuR and the mRNA granules
HuR exports from the nucleus following cellular stress, to effect regulation of cytoplasmic ARE-containing mRNAs in compartmentalized structures (reviewed in Cherry et al., 2006; Gorospe, 2003). The delayed accumulation of HuR in the mRNA granules of CA1 pyramidal neurons could be due to a defect in HuR nuclear to cytoplasmic transport. Alternatively, there could be successful nuclear export, but some biochemical alteration in the cytoplasm precludes HuR from entering the mRNA granules. Future work needs to address these issues.
In spite of the delay in HuR entering the mRNA granules, it is well established that there is copious transcription of hsp70 mRNA in both CA1 and CA3 at the duration of ischemia used in the preset study (Roberts et al., 2007). If, in CA3, the hsp70 mRNA is translated because of some process marked by HuR entering the mRNA granules, then what happens to hsp70 mRNA in CA1 neurons? It thus becomes essential to compare the subcellular distribution and protein interactions of hsp70 mRNA in CA1 and CA3 following I/R. The present study leads to the prediction that hsp70 mRNA will have differential binding partners and/or subcellular localization in CA1 and CA3 at reperfusion durations from 8hR to 36hR.
Finally, there is the issue of how precisely HuR can regulate the translation of an ARE-containing mRNA such as hsp70. Antic and Keene (1998) showed that interaction of Hu granules with microtubules, and polysomes with microfilaments, was important for translation of mRNAs in Hu granules. As cytoskeleton alterations occur in reperfused CA1 (Siesjo, 1994; Yokota et al., 1995; 2003), the present results indicate that investigating the relationship of cytoskeleton components to mRNA granules is merited.
Conclusion
We’ve presented the novel finding that cytoplasmic poly(A)-containing mRNAs redistributed to form mRNA granules in reperfused neurons. The mRNA granules appear to have sequestered mRNA away from the 40S subunit, providing a novel mechanism of prolonged TA in post-ischemic neurons. Our results indicate an important role for mRNA binding proteins and mRNA regulation as contributing to persistent TA in selectively vulnerable CA1. Further, our data links mRNA granules with the inability of CA1 neurons to translate HSP70 protein in a timely fashion. These results suggest that a fuller understanding of the underlying mechanisms may provide novel targets for therapeutic intervention, targets that could result in the simultaneous induction of translational recovery and early synthesis of HSP70 in selectively vulnerable neurons. Such an intervention might halt delayed neuronal death by allowing selectively vulnerable neurons to successfully express their endogenous cellular stress responses.
Acknowledgments
We would like to thank Dr. Robert Skoff (Department of Anatomy and Cell Biology, WSU) for his invaluable advice on performing FISH. We also thank Manupreet Chawla for her technical assistance with this work. We thank Jie Wang for her assistance with the 2VO/HT model. This work was sponsored by NIH NINDS Grant No. NS057167 (D.J.D.) and NIH IMSD Grant No. GM58905-8 (J.R.).
Abbreviations used
- 2VO/HT
bilateral carotid artery occlusion and hypovolemic hypotension
- 3’-UTR
three prime untranslated region
- 40S
small ribosomal subunit
- ARE
adenine and uridine rich element
- CA
Cornu Ammonis (Ammon’s horn)
- CA/R
cardiac arrest and resuscitation
- eIF
eukaryotic initiation factor
- EGP granules
granules containing eIF4E, eIF4G and poly(A) binding protein
- ELAV
embryonic lethal abnormal vision
- FISH
fluorescence in situ hybridization
- GAPDH
glyceraldehyde-3-phosphate dehydrogenase
- HSP70
70 kDa inducible heat shock protein
- HuR
also called HuA or ELAV
- I/R
ischemia and reperfusion
- IF
immunofluorescence histochemistry
- PA
protein aggregate
- PABP
poly(A) binding protein
- poly(A)
poly-adenylated mRNAs
- S6
small ribosomal subunit protein 6
- SG
stress granule
- TA
translation arrest
- TIA-1
T cell internal antigen
- TTP
tristetraprolin
Footnotes
Publisher's Disclaimer: This is a PDF file of an unedited manuscript that has been accepted for publication. As a service to our customers we are providing this early version of the manuscript. The manuscript will undergo copyediting, typesetting, and review of the resulting proof before it is published in its final citable form. Please note that during the production process errors may be discovered which could affect the content, and all legal disclaimers that apply to the journal pertain.
References
- Abramoff MD, Magelhaes PJ, Ram SJ. Image Processing with ImageJ. Biophotonics International. 2004;11:36–42. [Google Scholar]
- Akins PT, Liu PK, Hsu CY. Immediate early gene expression in response to cerebral ischemia. Friend or foe? Stroke. 1996;27:1682–1687. doi: 10.1161/01.str.27.9.1682. [DOI] [PubMed] [Google Scholar]
- Althausen S, Mengesdorf T, Mies G, Olah L, Nairn AC, Proud CG, Paschen W. Changes in the phosphorylation of initiation factor eIF-2alpha, elongation factor eEF-2 and p70 S6 kinase after transient focal cerebral ischaemia in mice. J Neurochem. 2001;78:779–787. doi: 10.1046/j.1471-4159.2001.00462.x. [DOI] [PubMed] [Google Scholar]
- Anderson P, Kedersha N. Visibly stressed: the role of eIF2, TIA-1, and stress granules in protein translation. Cell Stress Chaperones. 2002;7:213–221. doi: 10.1379/1466-1268(2002)007<0213:vstroe>2.0.co;2. [DOI] [PMC free article] [PubMed] [Google Scholar]
- Anderson P, Kedersha N. RNA granules. J Cell Biol. 2006;13172:803–808. doi: 10.1083/jcb.200512082. [DOI] [PMC free article] [PubMed] [Google Scholar]
- Antic D, Keene JD. Messenger ribonucleoprotein complexes containing human ELAV proteins: interactions with cytoskeleton and translational apparatus. J Cell Sci. 1998;111:183–197. doi: 10.1242/jcs.111.2.183. [DOI] [PubMed] [Google Scholar]
- Atasoy U, Watson J, Patel D, Keene JD. ELAV protein HuA (HuR) can redistribute between nucleus and cytoplasm and is upregulated during serum stimulation and T cell activation. J Cell Sci. 1998;111:3145–3156. doi: 10.1242/jcs.111.21.3145. [DOI] [PubMed] [Google Scholar]
- Bessert DA, Skoff RP. High-resolution in situ hybridization and TUNEL staining with free-floating brain sections. J Histochem Cytochem. 1999;47:693–702. doi: 10.1177/002215549904700511. [DOI] [PubMed] [Google Scholar]
- Brennan CM, Gallouzi IE, Steitz JA. Protein ligands to HuR modulate its interaction with target mRNAs in vivo. J Cell Biol. 2000;151:1–14. doi: 10.1083/jcb.151.1.1. [DOI] [PMC free article] [PubMed] [Google Scholar]
- Burda J, Martin ME, Garcia A, Alcazar A, Fando JL, Salinas M. Phosphorylation of the alpha subunit of initiation factor 2 correlates with the inhibition of translation following transient cerebral ischaemia in the rat. Biochem J. 1994;302:335–338. doi: 10.1042/bj3020335. [DOI] [PMC free article] [PubMed] [Google Scholar]
- Chen CY, Xu N, Shyu AB. Highly selective actions of HuR in antagonizing AU-rich element-mediated mRNA destabilization. Mol Cell Biol. 2002;22:7268–7278. doi: 10.1128/MCB.22.20.7268-7278.2002. [DOI] [PMC free article] [PubMed] [Google Scholar]
- Cherry J, Karschner V, Jones H, Pekala PH. HuR, an RNA-binding protein, involved in the control of cellular differentiation. In Vivo. 2006;20:17–23. [PubMed] [Google Scholar]
- Clemens MJ. Initiation factor eIF2 alpha phosphorylation in stress responses and apoptosis. Prog Mol Subcell Biol. 2001;27:57–89. doi: 10.1007/978-3-662-09889-9_3. [DOI] [PubMed] [Google Scholar]
- DeGracia DJ. Acute and persistent protein synthesis inhibition following cerebral reperfusion. J Neurosci Res. 2004;77:771–776. doi: 10.1002/jnr.20225. [DOI] [PubMed] [Google Scholar]
- DeGracia DJ, O'Neil BJ, Frisch C, Krause GS, Skjaerlund JM, White BC, Grossman LI. Initial studies of protein synthesis by purified ribosomes after cardiac arrest and resuscitation. Resuscitation. 1993;25:161–171. doi: 10.1016/0300-9572(93)90092-5. [DOI] [PubMed] [Google Scholar]
- DeGracia DJ, Sullivan JM, Neumar RW, Alousi SS, Hikade KR, Pittman JE, White BC, Rafols JA, Krause GS. Effect of brain ischemia and reperfusion on the localization of phosphorylated eukaryotic initiation factor 2 alpha. J Cereb Blood Flow Metab. 1997;17:1291–1302. doi: 10.1097/00004647-199712000-00004. [DOI] [PubMed] [Google Scholar]
- DeGracia DJ, Rafols JA, Morley SJ, Kayali F. Immunohistochemical mapping of total and phosphorylated eukaryotic initiation factor 4G in rat hippocampus following global brain ischemia and reperfusion. Neuroscience. 2006;139:1235–48. doi: 10.1016/j.neuroscience.2006.01.038. [DOI] [PubMed] [Google Scholar]
- DeGracia DJ, Hu BR. Irreversible translation arrest is the reperfused brain. J Cereb Blood Flow Metab. 2007;27:875–93. 1–19. doi: 10.1038/sj.jcbfm.9600388. [DOI] [PMC free article] [PubMed] [Google Scholar]
- DeGracia DJ, Rudolph J, Roberts GG, Rafols JA, Wang J. Convergence of stress granules and protein aggregates in hippocampal cornu ammonis 1 at later reperfusion following global brain ischemia. Neuroscience. 2007;146:562–72. doi: 10.1016/j.neuroscience.2007.01.050. [DOI] [PMC free article] [PubMed] [Google Scholar]
- DiDomenico BJ, Bugaisky GE, Lindquist S. Heat shock and recovery are mediated by different translational mechanisms. Proc Natl Acad Sci USA. 1982;79:6181–6185. doi: 10.1073/pnas.79.20.6181. [DOI] [PMC free article] [PubMed] [Google Scholar]
- Kiessling M, Dienel GA, Jacewicz M, Pulsinelli WA. Protein synthesis in postischemic rat brain: a two-dimensional electrophoretic analysis. J Cereb Blood Flow Metab. 1986;6:642–649. doi: 10.1038/jcbfm.1986.119. [DOI] [PubMed] [Google Scholar]
- Gallouzi IE, Brennan CM, Stenberg MG, Swanson MS, Eversole A, Maizels N, Steitz JA. HuR binding to cytoplasmic mRNA is perturbed by heat shock. Proc Natl Acad Sci USA. 2000;97:3073–3078. doi: 10.1073/pnas.97.7.3073. [DOI] [PMC free article] [PubMed] [Google Scholar]
- Gallouzi IE, Brennan CM, Steitz JA. Protein ligands mediate the CRM1-dependent export of HuR in response to heat shock. RNA. 2001;7:1348–1361. doi: 10.1017/s1355838201016089. [DOI] [PMC free article] [PubMed] [Google Scholar]
- Gao FB, Keene JD. Hel-N1/Hel-N2 proteins are bound to poly(A)+ mRNA in granular RNP structures and are implicated in neuronal differentiation. J Cell Sci. 1996;109:579–589. doi: 10.1242/jcs.109.3.579. [DOI] [PubMed] [Google Scholar]
- Gilks N, Kedersha N, Ayodele M, Shen L, Stoecklin G, Dember LM, Anderson P. Stress granule assembly is mediated by prion-like aggregation of TIA-1. Mol Biol Cell. 2004;15:5383–5398. doi: 10.1091/mbc.E04-08-0715. [DOI] [PMC free article] [PubMed] [Google Scholar]
- Gingras AC, Raught B, Sonenberg N. eIF4 initiation factors: effectors of mRNA recruitment to ribosomes and regulators of translation. Annu Rev Biochem. 1999;68:913–963. doi: 10.1146/annurev.biochem.68.1.913. [DOI] [PubMed] [Google Scholar]
- Gorospe M. HuR in the mammalian genotoxic response: post-transcriptional multitasking. Cell Cycle. 2003;2:412–414. [PubMed] [Google Scholar]
- Hossmann KA. Disturbances of cerebral protein synthesis and ischemic cell death. Prog Brain Res. 1993;96:167–177. doi: 10.1016/s0079-6123(08)63265-3. [DOI] [PubMed] [Google Scholar]
- Hoyle NP, Castelli LM, Campbell SG, Holmes LE, Ashe MP. Stress-dependent relocalization of translationally primed mRNPs to cytoplasmic granules that are kinetically and spatially distinct from P-bodies. J Cell Biol. 2007;179:65–74. doi: 10.1083/jcb.200707010. [DOI] [PMC free article] [PubMed] [Google Scholar]
- Hu BR, Martone ME, Jones YZ, Liu CL. Protein aggregation after transient cerebral ischemia. J Neurosci. 2000;20(9):3191–3199. doi: 10.1523/JNEUROSCI.20-09-03191.2000. [DOI] [PMC free article] [PubMed] [Google Scholar]
- Kayali F, Montie HL, Rafols JA, DeGracia DJ. Prolonged translation arrest in reperfused hippocampal cornu Ammonis 1 is mediated by stress granules. Neuroscience. 2005;134:1223–1245. doi: 10.1016/j.neuroscience.2005.05.047. [DOI] [PubMed] [Google Scholar]
- Keene JD. Why is Hu where? Shuttling of early-response-gene messenger RNA subsets. Proc Natl Acad Sci USA. 1999;96:5–7. doi: 10.1073/pnas.96.1.5. [DOI] [PMC free article] [PubMed] [Google Scholar]
- Keene JD, Lager PJ. Post-transcriptional operons and regulons co-ordinating gene expression. Chromosome Res. 2005;13:327–337. doi: 10.1007/s10577-005-0848-1. [DOI] [PubMed] [Google Scholar]
- Kimball SR, Horetsky RL, Ron D, Jefferson LS, Harding HP. Mammalian stress granules represent sites of accumulation of stalled translation initiation complexes. Am J Physiol. 2003;284:C273–C284. doi: 10.1152/ajpcell.00314.2002. [DOI] [PubMed] [Google Scholar]
- Kirino T. Delayed neuronal death. Neuropathology. 2000;20(Suppl):S95–957. doi: 10.1046/j.1440-1789.2000.00306.x. [DOI] [PubMed] [Google Scholar]
- Kirino T, Sano K. Selective vulnerability in the gerbil hippocampus following transient ischemia. Acta Neuropathol (Berl) 1984;62:201–208. doi: 10.1007/BF00691853. [DOI] [PubMed] [Google Scholar]
- Kogure K, Kato H. Altered gene expression in cerebral ischemia. Stroke. 1993;24:2121–2127. doi: 10.1161/01.str.24.12.2121. [DOI] [PubMed] [Google Scholar]
- Koistinaho J, Hokfelt T. Altered gene expression in brain ischemia. Neuroreport. 1997;8:i–viii. [PubMed] [Google Scholar]
- Kumar R, Krause GS, Yoshida H, Mori K, DeGracia DJ. Dysfunction of the unfolded protein response during global brain ischemia and reperfusion. J Cereb Blood Flow Metab. 2003;23:462–471. doi: 10.1097/01.WCB.0000056064.25434.CA. [DOI] [PubMed] [Google Scholar]
- Laroia G, Cuesta R, Brewer G, Schneider RJ. Control of mRNA decay by heat shock-ubiquitin-proteasome pathway. Science. 1999;284:499–502. doi: 10.1126/science.284.5413.499. [DOI] [PubMed] [Google Scholar]
- Liu CL, Chen S, Kamme F, Hu BR. A) Ischemic preconditioning prevents protein aggregation after transient cerebral ischemia. Neuroscience. 2005;134:69–80. doi: 10.1016/j.neuroscience.2005.03.036. [DOI] [PMC free article] [PubMed] [Google Scholar]
- Liu CL, Ge P, Zhang F, Hu BR. B) Co-translational protein aggregation after transient cerebral ischemia. Neuroscience. 2005;134:1273–1284. doi: 10.1016/j.neuroscience.2005.05.015. [DOI] [PMC free article] [PubMed] [Google Scholar]
- Mangus DA, Evans MC, Jacobson A. Poly(A)-binding proteins: multifunctional scaffolds for the post-transcriptional control of gene expression. Genome Biol. 2003;4:223–237. doi: 10.1186/gb-2003-4-7-223. [DOI] [PMC free article] [PubMed] [Google Scholar]
- Martone ME, Pollock JA, Jones YZ, Ellisman MH. Ultrastructural localization of dendritic messenger RNA in adult rat hippocampus. J Neurosci. 1996;16:7437–7446. doi: 10.1523/JNEUROSCI.16-23-07437.1996. [DOI] [PMC free article] [PubMed] [Google Scholar]
- Matsumoto K, Yamada K, Hayakawa T, Sakaguchi T, Mogami H. RNA synthesis and processing in the gerbil brain after transient hindbrain ischaemia. Neurol Res. 1990;12:45–48. doi: 10.1080/01616412.1990.11739912. [DOI] [PubMed] [Google Scholar]
- Nowak TS., Jr Synthesis of heat shock/stress proteins during cellular injury. Ann N Y Acad Sci. 1993;679:142–156. doi: 10.1111/j.1749-6632.1993.tb18295.x. [DOI] [PubMed] [Google Scholar]
- Panniers R. Translational control during heat shock. Biochimie. 1994;76:737–747. doi: 10.1016/0300-9084(94)90078-7. [DOI] [PubMed] [Google Scholar]
- Parker R, Sheth U. P bodies and the control of mRNA translation and degradation. Mol Cell. 2007;25:635–646. doi: 10.1016/j.molcel.2007.02.011. [DOI] [PubMed] [Google Scholar]
- Roberts GG, Di Loreto MJ, Marshall M, Wang J, DeGracia DJ. Hippocampal Cellular Stress Responses After Global Brain Ischemia and Reperfusion. Antioxid Redox Signal. 2007 doi: 10.1089/ars.2007.1786. ahead of print. [DOI] [PubMed] [Google Scholar]
- Ron D. Translational control in the endoplasmic reticulum stress response. J Clin Invest. 2002;110:1383–1388. doi: 10.1172/JCI16784. [DOI] [PMC free article] [PubMed] [Google Scholar]
- Schmued LC, Albertson C, Slikker W., Jr Fluoro-Jade: a novel fluorochrome for the sensitive and reliable histochemical localization of neuronal degeneration. Brain Res. 1997;751:37–46. doi: 10.1016/s0006-8993(96)01387-x. [DOI] [PubMed] [Google Scholar]
- Siesjo BK. Calcium-mediated processes in neuronal degeneration. Ann N Y Acad Sci. 1994;747:140–161. doi: 10.1111/j.1749-6632.1994.tb44406.x. [DOI] [PubMed] [Google Scholar]
- Simon RP, Cho H, Gwinn R, Lowenstein DH. The temporal profile of 72-kDa heat-shock protein expression following global ischemia. J Neurosci. 1991;11:881–889. doi: 10.1523/JNEUROSCI.11-03-00881.1991. [DOI] [PMC free article] [PubMed] [Google Scholar]
- Smith ML, Bendek G, Dahlgren N, Rosen I, Wieloch T, Siesjo BK. Models for studying long-term recovery following forebrain ischemia in the rat 2 A 2-vessel occlusion model. Acta Neurol Scand. 1984;69:385–401. doi: 10.1111/j.1600-0404.1984.tb07822.x. [DOI] [PubMed] [Google Scholar]
- Stoecklin G, Stubbs T, Kedersha N, Wax S, Rigby W, Blackwell TK, Anderson P. MK2-induced tristetraprolin:14-3-3 complexes prevent stress granule association and ARE-mRNA decay. The EMBO Journal. 2004;23:1313–1324. doi: 10.1038/sj.emboj.7600163. [DOI] [PMC free article] [PubMed] [Google Scholar]
- Van Nieuwenhoven FA, Martin X, Heijnen VV, Cornelussen RN, Snoeckx LH. HSP70-mediated acceleration of translational recovery after stress is independent of ribosomal RNA synthesis. Eur J Cell Biol. 2001;80:586–592. doi: 10.1078/0171-9335-00192. [DOI] [PubMed] [Google Scholar]
- Vass K, Welch WJ, Nowak TS., Jr Localization of 70-kDa stress protein induction in gerbil brain after ischemia. Acta Neuropathol (Berl) 1988;77:128–135. doi: 10.1007/BF00687422. [DOI] [PubMed] [Google Scholar]
- White BC, Sullivan JM, DeGracia DJ, O'Neil BJ, Neumar RW, Grossman LI, Rafols JA, Krause GS. Brain ischemia and reperfusion: molecular mechanisms of neuronal injury. J Neurol Sci. 2000;179(S 1–2):1–33. doi: 10.1016/s0022-510x(00)00386-5. [DOI] [PubMed] [Google Scholar]
- Yokota M, Saido TC, Tani E, Kawashima S, Suzuki K. Three distinct phases of fodrin proteolysis induced in postischemic hippocampus. Involvement of calpain and unidentified protease. Stroke. 1995;26:1901–1907. doi: 10.1161/01.str.26.10.1901. [DOI] [PubMed] [Google Scholar]
- Yokota M, Saido TC, Kamitani H, Tabuchi S, Satokata I, Watanabe T. Calpain induces proteolysis of neuronal cytoskeleton in ischemic gerbil forebrain. Brain Res. 2003;984:122–132. doi: 10.1016/s0006-8993(03)03121-4. [DOI] [PubMed] [Google Scholar]