

Summary
Embryonic stem (ES) cells are capable of indefinite self-renewal while retaining the ability to differentiate to any of the three germ layers that give rise to all somatic cell types. An emerging view is that a core set of transcription factors, including Oct4, Sox2 and Nanog, form a robust autoregulatory circuit that maintains ES cells in a self-renewing state. To accommodate the capacity of such cells to undergo germ layer-specific differentiation, we predicted a post-translational mechanism that could negatively regulate these core self-renewal factors. Here we report caspase-induced cleavage of Nanog in differentiating ES cells. Stem cells lacking the Casp3 gene showed marked defects in differentiation, while forced expression of a caspase cleavage-resistant Nanog mutant in ES cells strongly promoted self-renewal. These results link a major component of the programmed cell death pathway to the regulation of ES cell development.
Introduction
Embryonic stem (ES) cell research holds remarkable promise, yet the mechanisms by which these cells transition from pluripotency to differentiation have been elusive. It now appears that a small core set of transcription factors work together to maintain the pluripotent state of ES cells (Bernstein et al., 2006; Boyer et al., 2005; Boyer et al., 2006; Lee et al., 2006). These transcriptional regulators, including Oct4, Sox2 and Nanog, stimulate the expression of genes controlling self-renewal while repressing genes that drive differentiation. An emerging concept is that Nanog and other core transcription factors form a tight autoregulatory circuit that enables ES cells to remain stable in culture and ensures extreme autonomy in proliferative decisions (Boyer et al., 2005; Chickarmane et al., 2006). Thus, ES cells depend only marginally on mitogenic stimuli typically required for somatic cells to proliferate, but stimulate their own growth through endogenous factors. This autonomy is best shown by the unique ability of ES cells, injected into virtually any anatomical site in adult animals, to form rapidly growing tumors called teratocarcinomas (Damjanov and Solter, 1974). How, then, do ES cells retain the capacity for rapid differentiation? The most plausible mechanism, in our view, would modify one or more core transcription factors post-translationally, allowing the ES cells to rapidly escape the constrains of their self-renewal machinery.
Attractive candidates for the role of post-translational modifier of ES cell function are the site-specific proteases of the programmed cell death system. (Earnshaw et al., 1999; Thornberry and Lazebnik, 1998). The cysteine protease Caspase-3 is especially notable because it not only cleaves vital proteins, but also activates other caspases, such as Caspase-9, that have their own targets. These proteases are very specific for particular amino acid sequences, are highly regulated in their activities, and in some contexts appear to influence the decision of cells to differentiate (Arama et al., 2003; De Botton et al., 2002; De Maria et al., 1999a; De Maria et al., 1999b; Ishizaki et al., 1998), implying functions other than the execution of cell death programs. Here we report that caspases play a critical role in ES cell differentiation by negatively regulating the self-renewal machinery of these stem cells.
Results
Caspase activity increases after induction of ES cell differentiation
We first tested differentiating mouse ES cell cultures for the presence of caspase activity. As shown in Figure 1A and S1, such activity began to increase very shortly after the ES cells were stimulated with retinoic acid (RA) or plated in differentiation medium. To exclude an effect from increased apoptosis, we assayed the cultures for the percentage of cells undergoing apoptosis, demonstrating essentially no increases in this end point over 72 hours poststimulation with RA (Figure 1B). To substantiate that the caspase activity peaks were associated with cell differentiation and not programmed cell death, we generated a caspase activity reporter cell line (Caspsensor, Figure S2A), in which enhanced yellow fluorescent protein (EYFP) could be seen in the cytoplasm as long as caspase activity was low or absent, but appeared in the nucleus when caspases were active (Figure 1C). In their undifferentiated state, the ES cells showed mainly cytoplasmic EYFP staining, but upon induction of differentiation, the EYFP signal shifted to the nucleus in most or an increased percentage of the ES cells (Figure 1C – D), indicating the presence of caspase activity. Importantly, none of the caspase-positive cells appeared to be undergoing programmed cell death, as they lacked the classical features of nuclear condensation, nuclear fragmentation and membrane blebbing (not shown). Western blot analysis revealed marked differences in the sizes of the EYFPs, indicating that the reporter protein had indeed been cleaved by caspases (Figure S2B). We attribute the slight discrepancy in the kinetics of caspase activity shown in Figure 1A and 1D to the different cell densities required for the respective assays. Finally, we asked if PARP-1, a recognized caspase target during the execution of apoptosis (Lazebnik et al., 1994), might also be cleaved after induction of differentiation. Western blot analysis and immunofluorescence microscopy with PARP-1 antibodies revealed what appeared to be cleaved PARP-1 (the p85 fragment) at 48 hours poststimulation of ES cells (Figure 1E – F), suggesting that as in cells undergoing apoptosis, PARP-1 was also cleaved by caspases during differentiation. Thus, differentiating ES cells show increased caspase activity that is not associated with programmed cell death.
Figure 1. Increased Caspase activity in mouse ES cells upon induction of Differentiation.
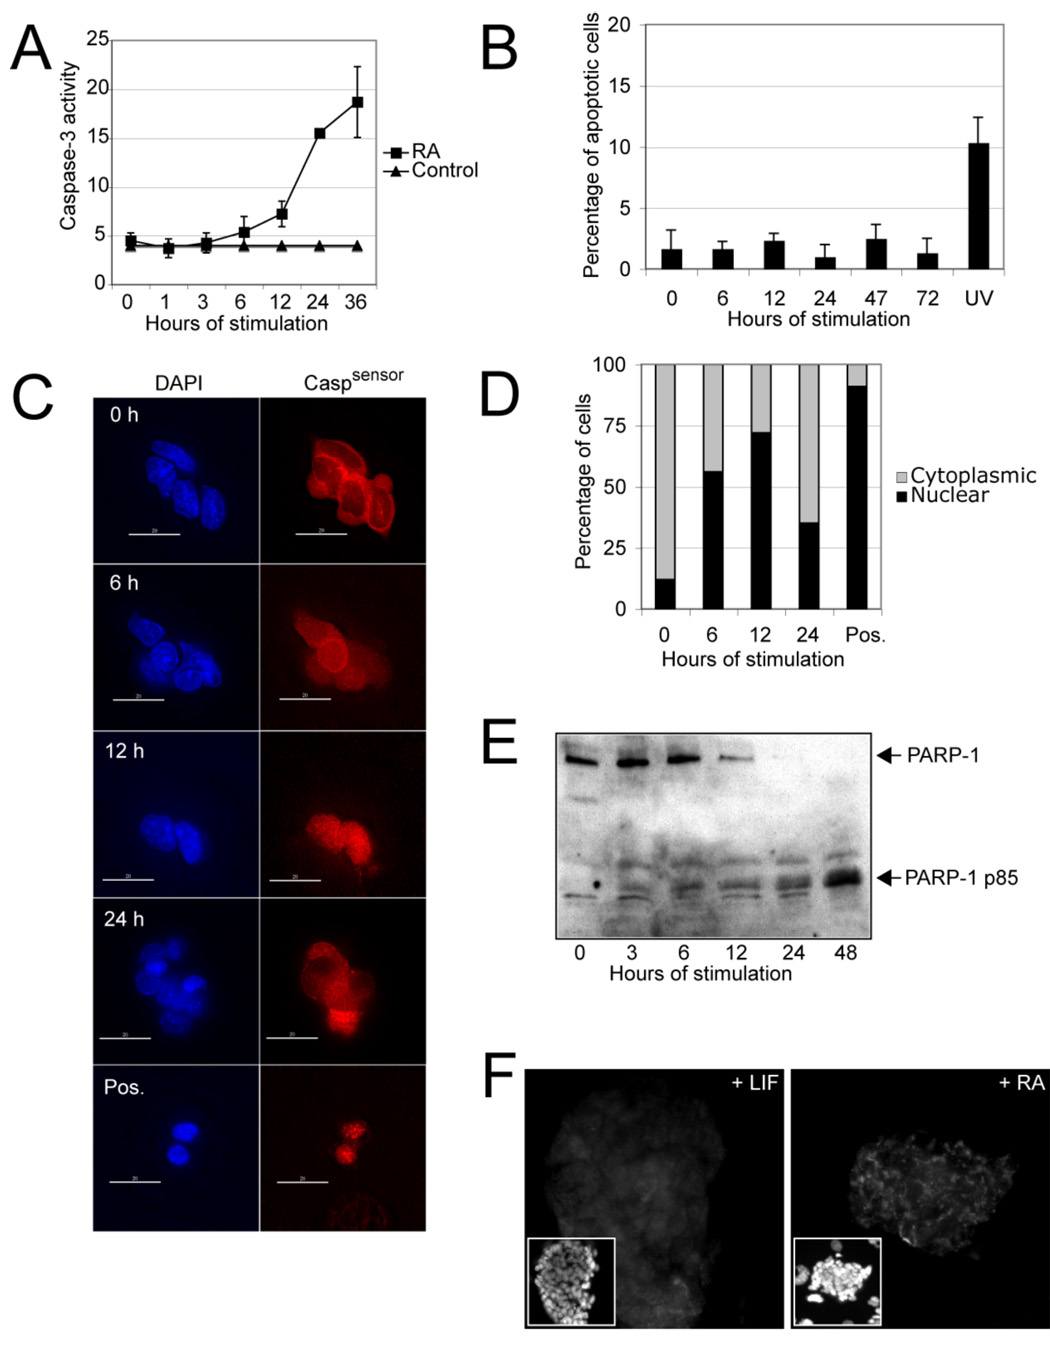
(A) The R1 ES cell line was stimulated with RA (1 µM) for the indicated times and Caspase activity was measured in an in vitro Caspase activity assay. The data are means (+/− SD) of triplicate experiments. (B) The same ES cell line was again exposed to RA for various times and the mean (+/− SD) percentage of cells undergoing programmed cell death was determined by counting apoptotic bodies . UV, ultraviolet light. (C) ES cells expressing the Caspase sensor (Caspsensor) were stimulated with RA (1 µM), fixed at the four indicated time points and stained with an antibody against a reporter protein (enhanced yellow fluorecent protein, EYFP). Mainly cytoplasmic staining indicates low Caspase acitivty, while mainly nuclear staining typically indicates increased Caspase activity. Immunofluorescence images (40X) were taken from representative fields. Although a shift of the signal from the cytoplasm to the nucleus is apparent at 12 hours, the cells did not show any signs of apoptosis. Cells treated with stausporine at 6 hours served as positive controls; scale bar = 10 µm. (D) Similar experimental setting as in panel C except that the mean percentage of cells with mainly cytoplasmic or nuclear staining was determined. (E) Western blot analysis of nuclear lysates isolated from mouse ES cells after stimulation with RA for the indicated times. The blotted membrane was probed with an antibody against PARP-1. The uncleaved form of PARP-1 is apparent at the earlier poststimulation times, with the cleaved form (85-kDa fragment) appearing after 24 hours, indicating PARP-1 cleavage. (F) Immunostaining of a mouse ES cell colony stimulated with RA or incubated with leukemia inhibitory factor (LIF) for 2 days. The antibody used specifically recognizes the 85 kDa form of PARP-1. Magnification, 40X.
Because many different caspases could have accounted for the increases in caspase activity seen in our differentiating ES cell cultures, we performed a Western blot analysis for active caspases in protein lysates from these cultures. Using antibodies against five major caspases, we identified active Caspase-3 in the lysates (Figure 2A) but failed to detect other effector cysteine proteases (results not shown). To demonstrate the functional relevance of Caspase-3 to ES cell differentiation, we first exposed the cells to the caspase-blocking peptide VAD and induced differentiation with RA. This treatment clearly inhibited ES cell differentiation, although the block was not complete (Figure 2B and D, left). Thus, while important for differentiation, Caspase-3 activity may not have been the sole factor contributing to this process. Alternatively, the VAD peptide may not have fully inactivated the protease.
Figure 2. Caspase-3 is increased during differentiation and is essential for proper differentiation of ES cells.
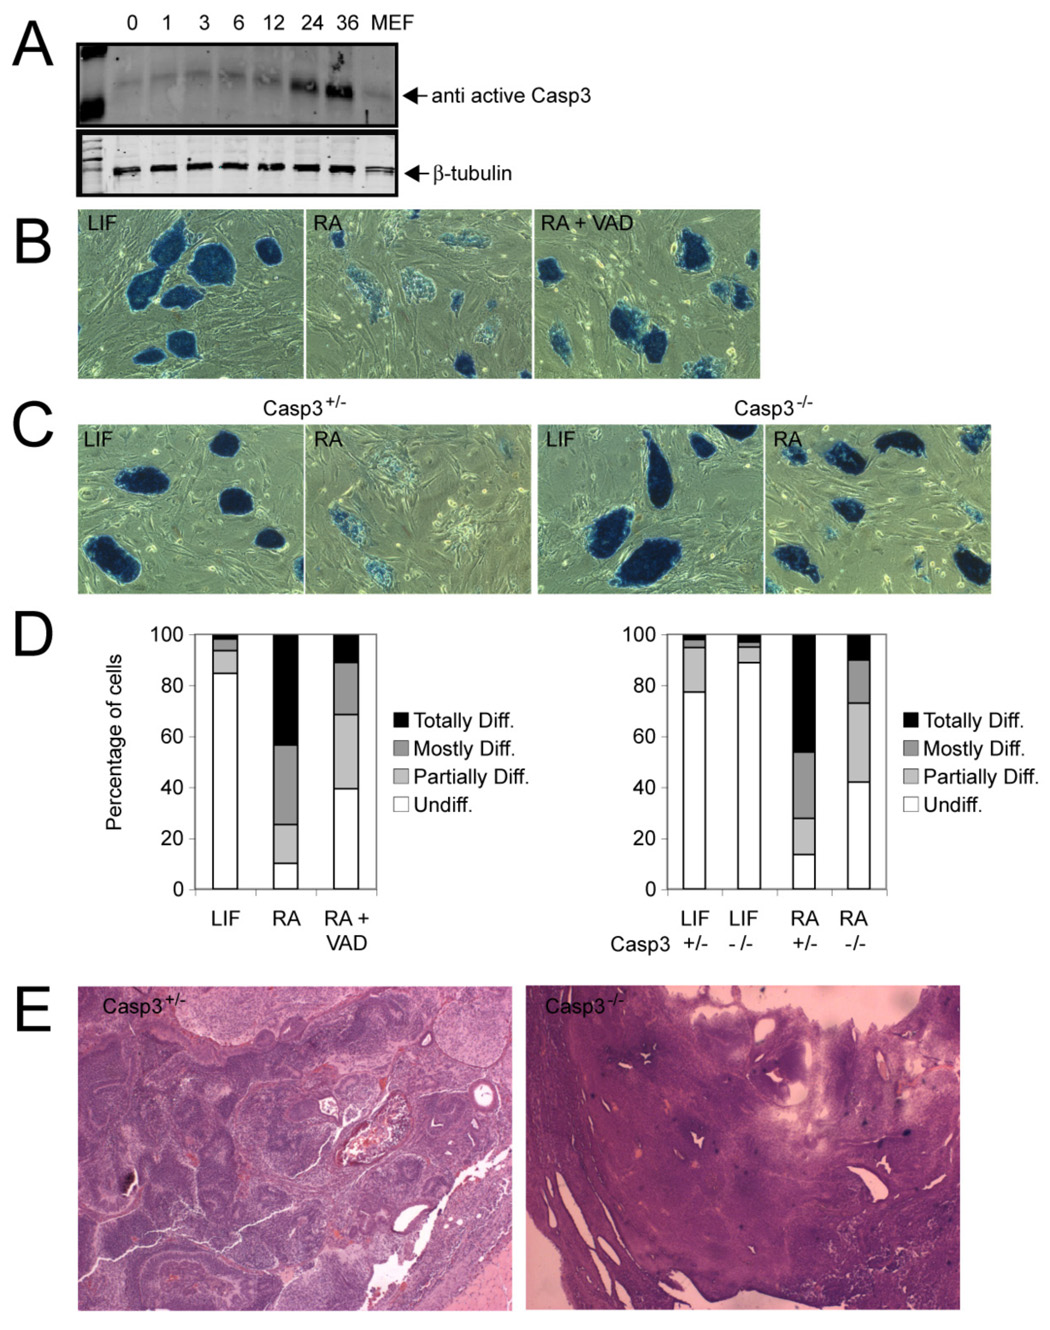
(A) Western blot analysis of protein lysates from ES cells stimulated to differentiate with RA for the indicated times. The Western blot membranes were probed with an antibody that specifically recognizes only active Caspase-3. MEF, mouse embryonic fibroblasts. (B) Alkaline phosphatase staining of ES cell colonies stimulated with RA (1 µM/ml) or coincubated with RA and the pan-Caspase blocking peptide VAD.fmk (100 µM) after 3 days. Cells incubated with leukemia inhibitory factor (LIF) served as controls. The majority of colonies lost staining due to differentiation, whereas coincubation with VAD prevented differentiation. Magnification, 10X. (C) Casp3 heterozygous (+/−) and knockout (−/−) ES cells were stimulated with RA (1 µM) for 3 days and stained for alkaline phosphatase. Casp3+/− ES cells differentiated, whereas the majority of Casp3−/− ES cells did not (10X). Controls were cells incubated without LIF (D, left) Quantification of colonies shown in panel B as described in Experimental Procedures. Mean values are shown. (D, right) Quantification of colonies shown in panel C. Mean values are shown. (E) Casp3+/− and Casp3−/− ES cells were injected into immunocompromised nude mice, and the resultant tumors were analyzed histologically. Typical aspects of Casp3+/− and of Casp3−/− tumors included derivatives from all three germ layers within a teratoma or immature and undifferentiated cells, respectively.
Caspase-3 knockout ES cells possess a differentiation defect
To substantiate a requirement for Caspase-3 activity in ES cell differentiation, we generated both homozygous and heterozygous lines of Casp3 knockout ES cells (Figure S3A). Deletion of the Casp3 locus lacked any discernible effect in undifferentiated ES cells; however, when exposed to RA, the Casp3−/− ES cells showed an obvious delay in differentiation compared with Casp3+/− cells (Figure 2C, D, right). Similar results were obtained when the ES cells were induced to differentiate as embryoid bodies (Figure S3B). As in the caspase blocking experiment, more than 25% of the Casp3−/− ES cell colonies showed appreciable signs of differentiation after 5 days, while a substantial proportion of the colonies remained either completely undifferentiated (42%) or only partially differentiated (31%). Quantification of Oct4 expression in Casp3−/− ES cells by PCR (Figure S3, C – D) showed a reduction in this transcription factor with time after differentiation, reinforcing the idea that a differentiation delay is associated with the absence of this protease in ES cells. We also injected Casp3+/− and Casp3−/− ES cells into immunocompromised mice, observing tumor formation at the injection sites 10–14 days later in both experimental groups. Histological examination of the tumors revealed differentiated cells from all germ layers in mice injected with the Casp3+/− ES cells, in contrast to the mainly undifferentiated or immature cells in Casp3−/− ES cells (Figure 2E and Figure S4). Taken together, the caspase-blocking and Casp3 knockout data support direct involvement of Caspase-3 in ES cell differentiation.
If Caspase-3 indeed promotes the differentiation of ES cells, it should be possible to demonstrate this effect by modulating levels of the active protease. We therefore made targeted insertions of cDNAs encoding a constitutively active (Casp3rev) or mutated (mCasp3rev) form of Caspase-3 upstream of the HPRT locus of A2lox ES cells; these cDNAs were under the control of a tetracycline-inducible promoter (Figure S5 A). Doxycycline induction of higher levels of inducible Caspase-3 in ES cells stimulated differentiation, coincident with a reduction of Nanog and Oct4 levels, an increase in the expression of miscellaneous differentiation factors, and an obvious change in cell morphology associated with differentiation (Figure 3A–C). Whether such stimulation favors differentiation to a particular cell type (e.g., endoderm) or simply releases ES cells from the self-renewal machinery to be stimulated by other extrinsic or intrinsic signals required for cell fate commitment is unclear.
Figure 3. Ectopic activation of Caspase-3 activity in ES cells leads to differentiation.
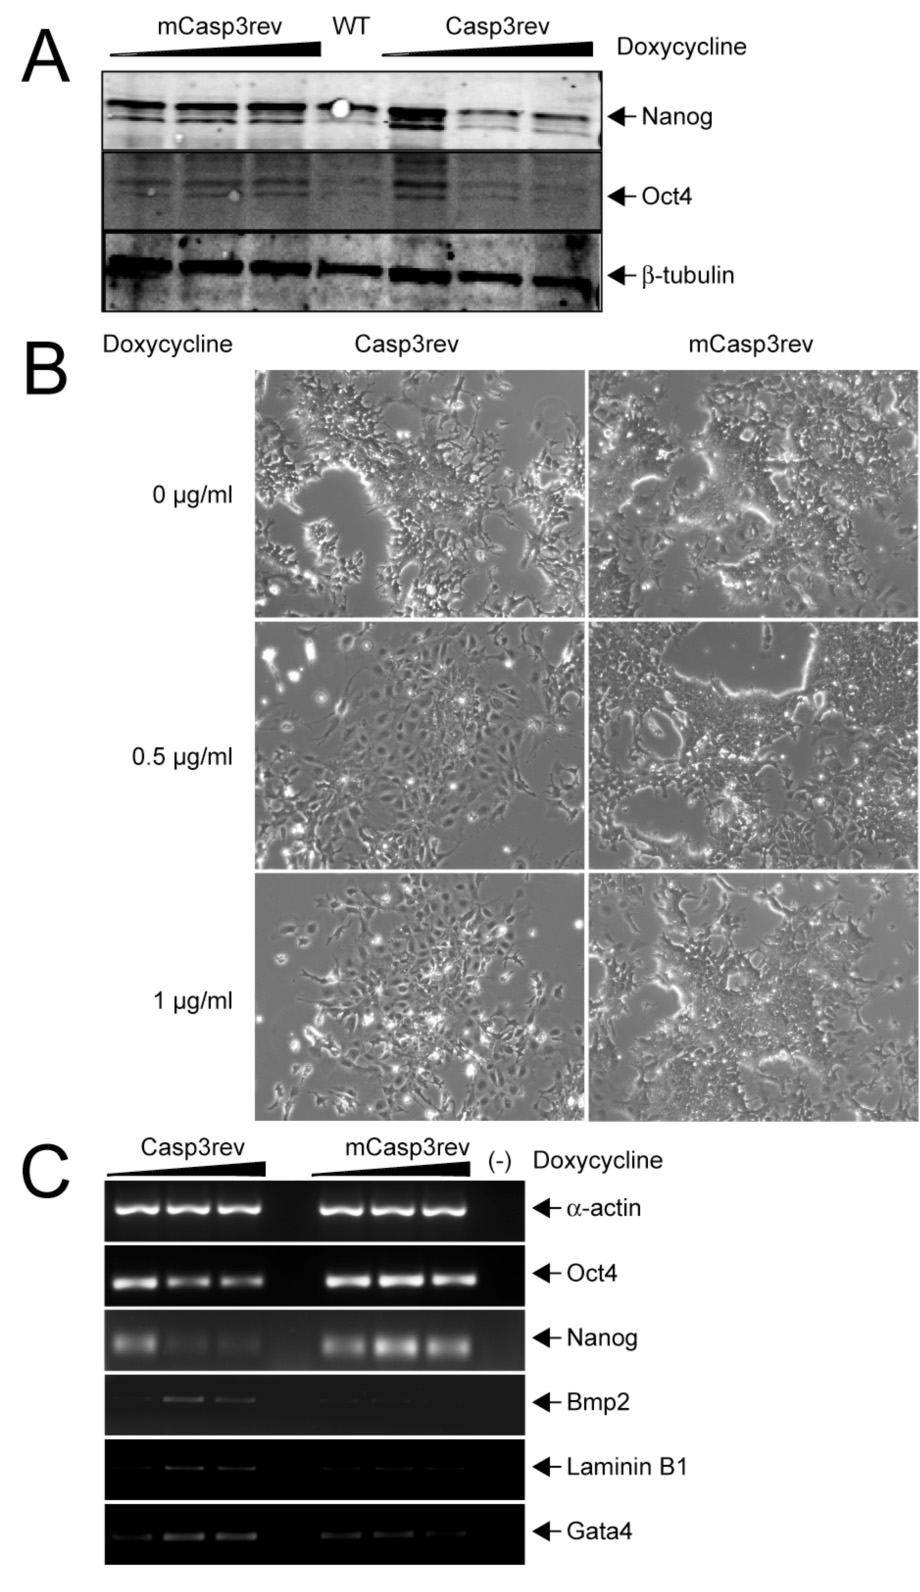
ES cells carrying a constitutively active form of Casp3 gene (Casp3rev) or a mutated version (mCasp3rev) under the control of a tetracycline-inducible element were stimulated with doxycycline at increasing concentrations. (A) Western blotting and detection of Oct4 and Nanog were then performed. Both Oct4 and Nanog disappeared when the expression of Casp3rev but not mCasp3rev increased. WT, wild-type. (B) ES cells show clear morphologic signs of differentiation when Casp3rev but not mCasp3rev expression is increased. (C) RT-PCR of Oct4, Nanog and differentiation markers. Both Oct4 and Nanog were downregulated when expression of Casp3rev but not mCasp3rev was increased, whereas expression of the differentiation markers Bmp2, Laminin B1 and Gata4 increased.
Nanog is cleaved upon induction of differentiation
To identify the differentiation-specific molecular targets of Caspase-3 in mouse ES cells, we developed an in vitro Caspase-3 cleavage assay and used it to determine the cleavage of Sox2, Oct4 and Nanog transcription factors, all of which maintain ES cells in a self-renewing state. Caspase-3 cleaved human (h) Nanog in vitro (Figure 4A), while Sox2 and Oct4 remained uncleaved (data not shown). Examination of the hNanog amino acid sequence revealed conserved residues at position 69 and at position 70 between the N-terminal transcriptional transactivator (Pan and Pei, 2003) and the homeodomain (Figure 4A), that likely serve as the Caspase-3 cleavage site. Indeed, when a single amino acid in this putative recognition sequence was mutated (yielding D69E hNanog), Caspase-3 was no longer able to cleave the protein in vitro (Figure 4A). We also noted that mouse (m) Nanog has a single amino acid substitution (D->G) at position 64, that is 3 bases upstream of the Caspase-3 cleavage site, a modification that could decrease the ability of Caspase-3 to cleave mNanog. An in vitro Caspase-3 substrate affinity assay revealed that the cleavage site in mNanog (GSPD) was still targeted by Caspase-3 (Figure S6B). However, after performing the same in vitro cleavage assays as used with hNanog, we observed very little or no cleavage of recombinant mNanog by Caspase-3 (Figure S6A). To determine whether both hNanog and mNanog and their corresponding mutants are cleaved in differentiating ES cells in vivo, we studied all four constructs in ES cells treated with RA (Figure 4B). Western blot analysis revealed cleavage of both wild-type hNanog and wild-type mNanog, but not their mutant forms harboring modified caspase cleavage sites (aa 67–68 in mNanog and aa 69–70 in hNanog) (Figure 4B). In addition, Western blot analysis with antibodies against endogenous Nanog detected a smaller band at 24 and 36 hours postinduction that corresponded to the cleaved form of Nanog (Figure 4C). Thus, given the apparently reduced activity of Caspase-3 toward mNanog in vitro, compared with its effective cleavage of this transcription factor in vivo, we hypothesized that another, Caspase-3-dependent protease may function with Caspase-3 to modify the regulatory activity of mNanog. By screening a panel of caspases for their ability to cleave mNanog in vitro (Figure 4D, left), we identified Caspase-9 as the most likely candidate for this role (Figure 4D and Figure S6C). Indeed, others have shown that the activity of Caspase-9 can be drastically enhanced either by active Caspase-3 (Zou et al. 2003) or by Procaspase-3 (Yin et al. 2006) supporting an important contribution of Caspase-9 to Nanog cleavage in ES cells.
Figure 4. Caspases cleave Nanog in ES cells.
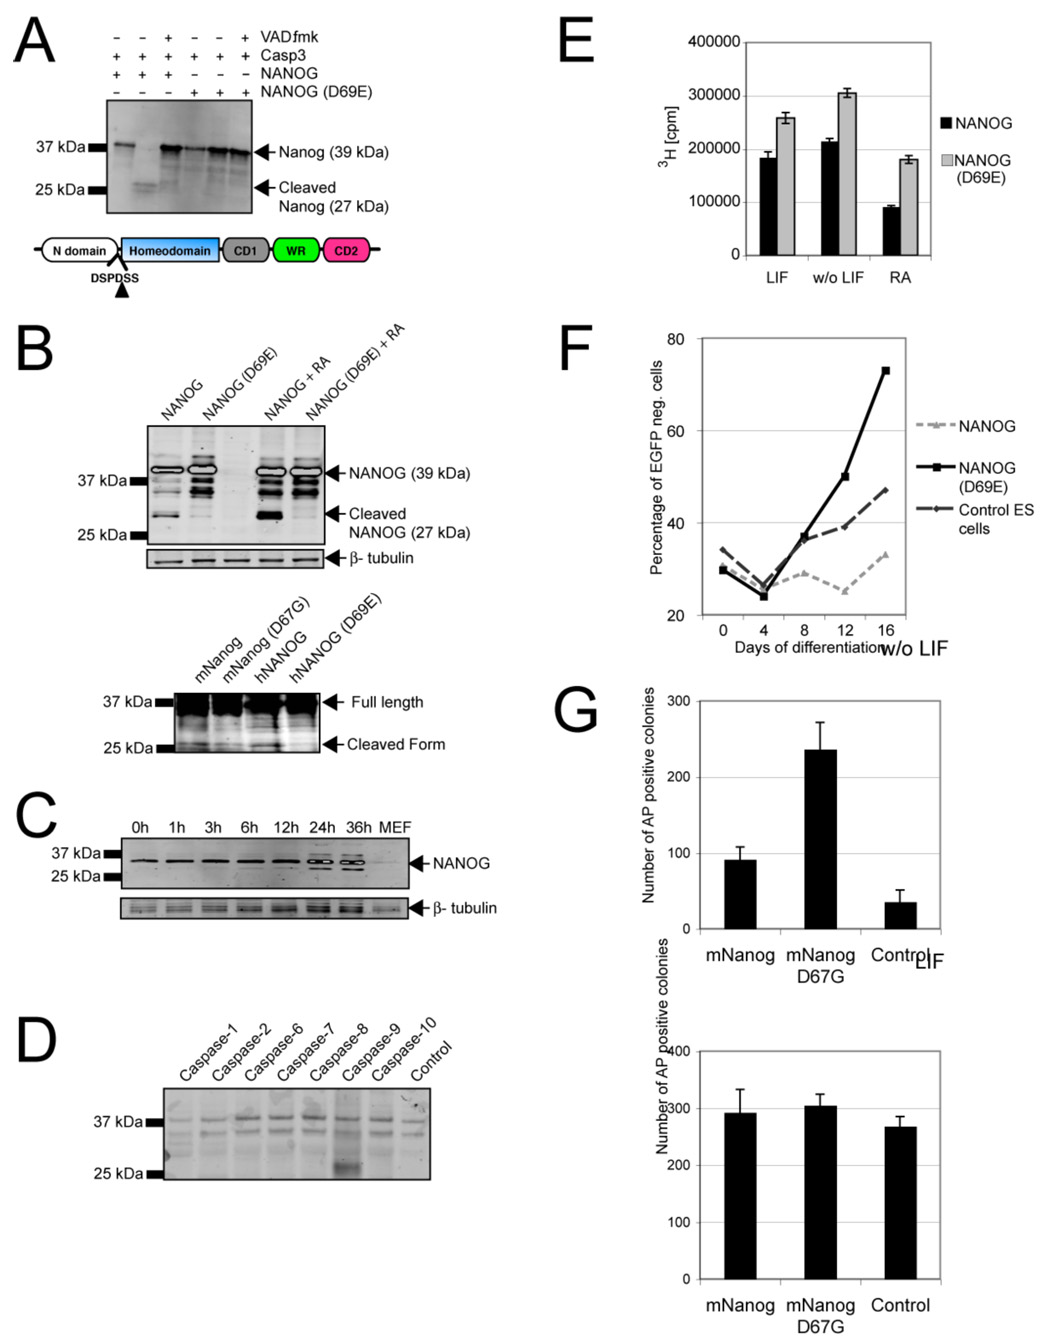
(A, top) In vitro-translated hNanog, but not its D69E mutant, is cleaved by Caspase-3. (A, bottom) Proposed caspase cleavage site at position 69, separating the N-terminal domain of Nanog from the rest of the protein. (B, top) Western blot showing expression of hNanog and mutant hNanog with or without a mutation at position 69 (D69E) that obviates cleavage. The results represent ES cells transfected with hNanog or D69E hNanog in cultures treated with RA (1 µM) or untreated. After induction of differentiation, cleaved hNanog appeared as a 27 kDa band that was not visible when the cells were transfected with the mutated form of hNanog. (B, bottom) Western blot showing expression of hNanog and mNanog and mutant hNanog and mNanog carrying a mutation at position 69 and 67 respectively (D69E, D67G) that obviates cleavage. The results represent ES cells transfected with depicted Nanog versions and treated with RA. Cleaved hNanog and mNanog appeared as a 27 kDa band that was barely visible when the cells were transfected with the mutated forms of hNanog and mNanog. (C) Western blot analysis for endogenous mNanog reveals the cleaved form of the protein after induction of differentiation with RA. (D) In vitro caspase cleavage assay reveals that Caspase-9 can effectively cleave in vitro-translated mNanog (E) Proliferation of ES cells harboring hNanog or D69E hNanog and grown under normal conditions with LIF or RA stimulation. Mean (+/− SD) levels of 3H incorporation in triplicate experiments indicate a consistently greater proliferative advantage for cells expressing the hNanog cleavage mutant. (F) Proliferation of ES cells expressing D69E or wild-type hNanog that were mixed 20:80 with EGFP-labeled ES cells. The percentage of unlabeled ES cells in the mixture was determined during growth in the absence of LIF. Cells carrying the caspase cleavage-resistant mutant (D69E hNanog) had a marked growth advantage over control or hNanog-expressing cells. The data are means (+/− SD) of triplicate experiments. (G) Mouse ES cells were plated at low densities (5000 cells/cm2) and transfected with wild-type mNanog, D67G mNanog (caspase cleavage-resistant Nanog) or control plasmid (GFP) and cultured with or without LIF for 3 days. Tranfection with D67G mNanog substantially increased the number of undifferentiated (AP-positive) colonies.
If Nanog is indeed one of the principal targets of Caspases in ES cells, its cleavage should have profound effects on whether the cells remain in a state of pluripotency or differentiate. To test this prediction, we again generated ES cells harboring cDNA coding for hNanog or D69E, the caspase cleavage-resistant form of hNanog targeted upstream of the HPRT locus under the control of a tetracycline-inducible element (Figure S7A, B). Importantly, the expression of induced hNanog reached levels comparable to those of endogenous Nanog (Figure S7C). ES cells expressing the D69E form of hNanog had a clear proliferative advantage over cells with the wild-type allele when cultured under conditions that promote differentiation (Fig. 4E, F). They also lacked evidence of morphological changes, in contrast to ES cells carrying the wild-type form of Nanog (Figure S7D). To assess the antidifferentiation effects of caspase cleavage mNanog we plated ES cells transfected with wild-type and D67G (cleavage-resistant) mNanog at clonal densities and analyzed colony formation 3 days later. The vast majority of colonies expressing the cleavage-resistant form of mNanog appeared morphologically unaffected and were positive for alkaline phosphatase, whereas a significantly lower number of colonies expressing wild-type mNanog consisted of undifferentiated, alkaline phosphatase-positive cells (Figure 4G). These observations support the hypothesis that caspase mediated cleavage of Nanog promotes ES cell differentiation.
Discussion
Our findings suggest that ES cells exploit caspases for rapid and specific deactivation of Nanog, thus disrupting the autoregulatory circuit that otherwise preserves pluripotency in these cells. They indicate further that Caspase-3 plays a dominant role in this negative regulation, by acting directly on Nanog or interacting as a cofactor with Caspase-9, which then deactivates the transcription factor. The action of caspases on Nanog appears to separate the N-terminal domain from the homeodomain, leading to the destabilization and subsequent degradation of the protein. From our experiments it is clear that both human and mouse Nanog are cleaved by caspases, and therefore it is likely that both of them are completely interchangeable with regard to caspase-mediated cleavage during the differentiation of ES cells. That the caspase cleavage-resistant forms of Nanog have a significantly stronger antidifferentiation effect in ES cells than does wild-type Nanog firmly suggests that caspase-mediated cleavage of endogenous Nanog plays a critical role in ES cell differentiation.
The link we have identified between ES cell differentiation and programmed cell death helps to explain several poorly understood observations on these ostensibly distinct processes, both in vitro and in the early embryo. For instance, some components of the cell death system, such as Bcl-2, protect ES cells not only from apoptosis but also from differentiation (Yamane et al., 2005), while p53 has been shown to be directly involved in both the control of cell proliferation and apoptosis and the differentiation of ES cells (Lin et al., 2005). Moreover, other proteolytic components of ES cells, such as the proteasome, appear to have direct roles in the control of stem cell self-renewal (Szutorisz et al., 2006). Future studies will need to address the question of whether caspase activity indeed actively promotes differentiation, as our data suggest, or perhaps functions as part of a mechanism for the selective elimination of undifferentiated cells. In either case, the net outcome – cell differentiation -- would be the same.
Selective targeting of Nanog by caspases is consistent with evidence implicating this transcription factor as a “master” regulator of the pluripotent state (Chambers et al., 2003; Ivanova et al., 2006; Mitsui et al., 2003). However, given the remarkable complexity of the pathways controlling cell death and differentiation, we find it difficult to imagine how Caspase-3, acting alone or in collaboration with Caspase-9, could be solely responsible for the mediation of proliferation versus differentiation choices in ES cells. We predict, instead, that other mediators of cell death, possibly by targeting pluripotency factors other than Nanog. This hypothesis is supported by the absence of any overt phenotype in the preimplantation embryos of Casp3 knockout mice (Kuida et al. 1996, Woo et al. 1998).
Our results leave unanswered the major question of why Caspase-3 activation during differentiation is limited and does not self-amplify as seen during apoptosis. Potential mechanisms for such control of caspase activity include subcellular localization of the enzyme, the caspase activity level itself, phosphorylation or other forms of structural modification, as well as direct or indirect interaction with protein inhibitors, such as IAPs. Given that ES cells carrying the cleavage-resistant form of Nanog proliferate better than those with the wild-type allele, it seems reasonable to suggest that the cleaved form of Nanog might exert a dominant-negative effect on some of the normal functions of Nanog.
A more comprehensive understanding of the molecular pathways controlling ES cell self-renewal and differentiation, in particular the apparent molecular link between programmed cell death and cell differentiation, would not only accelerate efforts to generate clinically relevant cell types from ES cells, but may also facilitate the reprogramming of differentiated cells to enter a pluripotent state (Okita et al., 2007), (Silva et al., 2006), for example, by blocking caspase activity. We consider the affinity of Caspase-3 and Caspase-9 for the transcription factor Nanog to be a paradigm for other potential caspase targets in ES cells; hence, it should be possible to exploit the caspases in experimental screens to identify other factors that regulate stem cell pluripotency. Finally, the involvement of caspases in nonapoptotic pathways, as demonstrated here and elsewhere (Arama et al., 2003; De Botton et al., 2002; De Maria et al., 1999a; De Maria et al., 1999b; Ishizaki et al., 1998), suggests that efforts to block apoptosis via caspase inhibition for therapeutic purposes may have much broader implications than initially thought, especially for stem cells.
Experimental Procedures
ES cell cultures
The mouse ES cell lines used were: D3 (from ATCC, #CRL11632), R1 (from Andras Nagy, Toronto), E14Tg2a-derived A2lox (from Michael Kyba, UT Southwestern Medical Center); cells were typically used between passages 10 and 20. A2lox ES cells express the reverse tetracycline transactivator from the endogenous Rosa26 locus and carry an insertion containing a tetracycline response element, loxP-lox2272 sites and the neomycinΔATG-resistance gene upstream of HPRT on the X chromosome. To generate inducible derivatives, we subcloned cDNAs into the p2Lox targeting vector. Cre / Lox recombination was used to insert p2Lox into the inducible locus as described previously (Kyba et al., 2003). The medium contained 10% FBS (Innovative Research, cat. no. IFBF-H) tested for toxicity to ES cells in a colony-forming assay (Evans, 2004), that included Knockout DMEM (Invitrogen, cat. no. 10829-018), 1x nonessential amino acids (Invitrogen, cat. no. 111140-050), L-glutamine 1% v/v (Invitrogen, cat. no. 25030-081), 2-mercaptoethanol (3.5 µl per 250 ml medium; Sigma, cat. no. M7522), LIF 1000 per ml (Esgro, cat. no. ESG1107). Cells were routinely maintained on irradiated (8400 rad) mouse embryonic fibroblasts (MEFs) derived from E14.5-old embryos (mouse strain CF1, Charles River timed pregnant mice). For some experiments ES cells were placed onto 0.1% gelatin type A (Sigma, cat. no. G1890)-coated dishes and passaged 2 to 4 times before the experiment was carried out. For differentiation studies, standard medium was replaced with medium containing 1 µM retinoic acid (RA, Sigma, cat. no. R2625) without LIF or N2B27 medium (Ying et al., 2003): 45% DMEM-F12 (Invitrogen, cat. no. 11320-033); 45% Neurobasal medium (Invitrogen, cat. no. 21103-049); 2% Supplement B27 ( Invitrogen, cat. no. 17504-044); 50 µg/ml BSA fraction. V (Invitrogen, cat. no. 15260-037); 100 µg/ml Apo-Transferrin bovine (Invitrogen, cat. no. 11108-016); 25 µg/ml Recombinant Human insulin (Invitrogen, cat. no. 0030110SA); 6 ng/ml progesterone (Sigma, cat. no. P6149); 16 µg/ml putrescin ( Sigma, cat. no. P6024); 30 nM Na-selenite (Sigma, cat. no. S5261); 2 mM glutamine (Invitogen, cat. no. 25030-081); and 0.15 mM monothioglycerol (Sigma, cat. no. M6145).
In vitro caspase cleavage assay
Trypsinized ES cells (R1; 200,000; D3 250,000) were plated into 6 wells containing normal ES cell medium, and on the next day the medium was changed to 1 µM RA differentiation medium. Cells were harvested with trypsin-EDTA (Invitrogen, cat. no. 25300-054), and protein extracts were made in 0.1% CHAPS buffer, pH 7.2 (50 mM Hepes; 150 mM KCl; 1x protease inhibitors (Roche, cat. no. 1697498001); 2 mM Na fluoride and orthovanadate, respectively, at specified time points. The CaspGlo (Promega, cat. no. G8091) kit was used to directly measure caspase activity. Before determining caspase activity, we tested the system for variability within the dynamic range, using recombinant caspase-3 (BD Bioscience, cat. no. 556471). The signal was measured with the Wallac 1429 VictorII instrument (Perkin-Elmer, Wellesley, MA).
Apoptosis rate
R1 ES cells (1 × 10⁵) were plated into 6-cm dishes on irradiated MEFs and stimulated with RA differentiation medium for up to 72 hours. Cells were fixed with 4% paraformaldehyde (EMS, cat. no. 15710), stained with DAPI and mounted with Vectashield (Vector Lab, cat. no. H1200). The number of apoptotic figures was determined intriplicate per 100 cells. As a positive control, ES cells were incubated with staurosporine (Sigma, cat. no. S5921, 1µM) for 4 hours.
Caspase sensor
The pCasp3-sensor (Clontech) was used, and the sensor insert (950 bp) was amplified by using primers with SalI 5’ (gatgtcgactcagatccgctagccgcca) and ScaI 3’ (gagtactttatctagatccggtggatcc) ends and cloned into the SalI-SmaI cloning site of the p2Lox vector (Michael Kyba). P2LoxPcaspase3 sensor (20 µg) was co-electroporated with 20 ug of pSalk-Cre (Michael Kyba) into (1 × 10⁶) A2lox ES cells (960 µF, 220 voltage, 25 millisec pulses). After electroporation, the cells were plated on neomycin-resistant MEFs (Chemicon, cat. no. PMEF-NL) and selected with G418 (400 µg/ml), individual clones were then picked and expanded. For the differentiation studies, a single clone was used (clone #6), 4000 cells/well were plated onto gelatine coated 8-chamber slides (Nalgen Nunc International) and stimulated with RA differentiation medium for specified times (cells incubated with staurosporine, 1 mM for 12 hours, served as a positive control). Cells were fixed with Cytofix (BD Biosciences, cat. no. 554714) at room temperature for 30 minutes, washed 3 times with Perm/Wash™ buffer, incubated with anti-EGFP antibody (1:500, MBL), diluted in Perm/Wash™ buffer (BD Biosciences, cat. no. 554714) at 4°C overnight, washed 3 times with Perm/Wash™ buffer 3, and incubated with antirabbit antibody (Alexa Fluor 594, Molecular Probes, cat. no. A11072). They were mounted with VECTASHIELD plus DAPI. (Vector Labs). Cells that contained signal in the cytoplasm or in the nucleus were counted (100 cells per condition) and representative images were taken with the DeltaVision® deconvolution microscope (Applied Precision) equipped 40X objective lens. The acquired images were analyzed with softWoRx® Suite (Applied Precision).
PARP-1 cleavage
D3 ES cells (25 × 104) were plated into gelatin-coated 6-well dishes and stimulated with RA. Cells were lysed with CHAPS buffer, and 20 µg of protein was loaded onto a PAGE gel and blotted. PARP-1 was detected with anti-PARP antibody (Santa Cruz). For PARP-1 immunostaining, R1 ES cells were plated onto 4-well chamber slides (Nunc, cat. no. 177437) and differentiation was induced with differentiation medium for 2 days. Cells were fixed for 30 minutes at RT in 4% parafomaldehyde (EMS, cat. no. 15710) in PBS and permeabilized for 5 minutes at room temperature (0.2% Triton X-100, Sigma, cat. no. T8532, in PBS). Blocking was peformed with 5% goat serum for 24 hours at room temperature followed by incubation with the primary antibody anti-PARP-1-p85 (1/100 dilution, Promega, cat. no. G7341, (Perng et al., 2000). After 4 washes with 0.1% Tween20-PBS, cells were incubated with the secondary antibody (Abcam, cat. no. 6717, goat anti-FITC 1/500 in 0.1%Twin-20-PBS.), washed three times and mounted in Vectashield plus DAPI. Representative images were taken with the Axioplan2 Imaging System Zeiss microscope.
Active caspase 3 Western blot analysis
R1 ES cells were plated at a density of 2 × 10⁵ cells per 6-well plate, kept in ES cell medium overnight and then stimulated for specified time with RA. Cells were lysed in CHAPS lysis buffer. Twenty µg of protein was run on a polyacrylmamide gel and blotted onto nitrocellulose membrane (BioRad). Antibody incubation was carried out with the primary anti-active caspase-3 antibody (Cell Signaling, cat. no. 9661; 1/1000 dilution). The Rockland anti rabbit IgG antibody (dilution 1/5000 in PBS 0.1% Twin-20, IRDay800 611-132-122) served as a second antibody. Reactions were detected with the infrared Imaging System Odyssey (Li-COR protocol, doc. no. 988-07568).
VAD inhibition experiment
R1 ES cells were plated at a density of 2 × 10⁵ cells/ml into 6-well plates containing ES cell medium. On the next day, medium was changed to RA differentiation medium with or without VAD (100 µM; Calbiochem, cat. no. 627610). Medium was changed every day and cells fixed at room temperature for 15 minutes in 4% paraformaldehyde (Polyscience, cat. no. 18814) followed by alkaline phosphatase staining according to the manufacturer’s instructions (Vector Laboratories, cat. no. SK5300 Alkphos Substrate III Blue.). Representative images were taken with a 10x objective. Colonies (1 × 10²) were assessed for their morphology as follows: totally differentiated colonies = no AP staining, no ES cell morphology; mostly differentiated = colonies containing small areas of undifferentiated AP-positive ES cells, but otherwise differentiated cells; partially differentiated = colonies containing more than 50% undifferentiated, AP-positive cells; undifferentiated = colonies lacking any discernible signs of differentiation.
Generation of caspase-3 knockout
ES cells were derived from E3.5-old mouse embryos. Briefly on day 1 caspase-3 homozygous (Kuida et al., 1996) and control C57/BL6 female mice were injected i.p. with 5 IU of PMS (Calbiochem, cat. no. 367222). Forty-six hours later, the female mice received an i.p. injection of 5 IU human chorionic gonadotropin (HCG; Calbiochem, cat. no. 230734). Stimulated females were placed into a cage with 8-week old caspase-3-homozygous stud males. Blastocysts were collected on day 3 post-coitum in the afternoon. The blastocysts were placed onto irradiated mouse embryonic feeder cells and incubated for 3 days in ES cell medium, trypsinized and replated. Colonies apparent on day 7 were picked, expanded and genotyped with use of the following primers: mCasp3-S: TGTCATCTCGCTCTGGTACG; mCasp3-AS: CCCTTTCTGCCTGTCTTCTG (PCR product SIZE 310 bp); Neomycin-S: AGACAATCGGCTGCTCTGAT; Neomycin-AS: ATACTTTCTCGGCAGGAGCA (PCR product size 260 bp); mOct4-S: GGCGTTCTCTTTGGAAAGGTGTTC; mOct4-AS: CTCGAACCACATCCTTCTCT (PCR product size 312 bp); Actin-S: GGCCCAGAGCAAGAGAGGTATCC, Actin-AS: ACGCACGATTTCCCTCTCAGC (PCR product size 460 bp). For PCR we used GoTaq green master mix (Promega, cat. no. M7112) with the program: 1 cycle at 95°C for 3 minutes followed by 40 cycles with 95°C - 58°C - 72°C for 30 seconds followed by one extension of 10 minutes at 72°C. We generated two caspase-3 knockout cell lines (34A and 34B) and two control caspase-3 heterozygote cell line (22A and 22B). All experiments were carried out with these four cell lines and yielded essentially the same results.
Teratoma, embryoid body formation and PCR for Oct4
Caspase-3 heterozygous and homozygous ES cells were injected (2×10⁶ cell in PBS) into 5 to 7 weeks old male NU/J mice (Charles River, stock no. 002019). Tumors that eventually formed were extracted and subjected to histological analysis. For embryoid body (E.B.) formation heterozygous and homozygous 2×10⁶ ES cells were plated for 4 days in 60 mm plates, trypsinized, plated onto gelatin-coated plates and incubated in differentiation medium. For Oct4 gene expression analysis, ES cells were harvested, total RNA extracted (Qiagen, RNAeasy kit; cat. no. 74104) and reverse transcriptase reactions (Impront II reverse transcription system; Promega, cat. no. M7112) were carried out according to the manufacturer’s instructions. Oct4 was amplified with the primers shown in table 1 and GoTaq green master mix (Promega; cat. no. M7112) as follows: 1 cycle at 95°C for 3 minutes, followed by 25 cycles of 30 seconds at 95°C - 60°C - 72°C, followed by one extension of 10 minutes at 72°C. In addition, quantitative PCR for Oct4 (cat. no. Mm658129 gH part no. 433182) and control GAPDH (probe mouse 4352339E-0611010) both from Applied Biosystems, were carried out with 2x TAQMAN Universal master mix (Applied Biosystems). DeltaCT values were determined according to user bulletin #2, ABI PRISM 7700, December 11, 1997). All experiments were carried out with both heterozygous and homozygous ES cell lines and yielded essentially the same results.
Inducible Caspase-3 cell line experiments
We used a constitutively active caspase-3 gene (Casp3rev) as described in (Srinivasula et al., 1998) and a mutated version of Casp3rev (C1635) as described in (Kamada et al., 1998). These active and inactive forms of caspase-3 were derived from the plasmids pGEMCasp3rev (6730 bp) and pGEM MutCas3rev (3867 bp). The caspase-3 inserts were cut out of their backbone vectors with EcoRI and the insert (874bp) cloned by blunt end ligation into the pLoxP2 vector and digested with XhoI-SmaI (3549 bp). The vector was co-electroporated with pSalk-Cre into 30 × 106 A172 cells (960 µF, 25 millisec pulse. After electroporation, the cells were selected with G418 (400 µg/ml) and individual clones were picked and subsequently expanded. For the differentiation experiment, cells were plated into 6-well plates (1 × 10⁵/well) and stimulated with 1µg/ml doxycycline (Sigma, cat. no. D9891) for 36 hours. They were then harvested, and Western blots for Oct4 (H-134 Santa Cruz, cat. no. SC9081), Nanog (Abcam, cat. no. AB14959; Chemicon 1/1000) and beta-tubulin (D10; Santa Cruz, cat. no. SC5274) performed. Secondary antibodies (dilutions 1/5000 and 1/10000 consist of: Alexa-680 antirabbit (Molecular Probes, cat. no. A21077) or IRday 800 antirabbit (Rockland, cat. no. 611-131-121). The signal was detected with the Odyssey system.
Detection of Nanog cleavage by caspase-3 in vitro
Human Nanog was obtained from ATCC (cDNA clone cat. no. 10806397 ; Image Clone IDm no. 40004923; Gene Bank ID no.BC09827) and subcloned into pCR-BlendII-TOPO (Invitrogen). The mutation D69E was introduced into human hNanog with a site-directed mutagenesis kit (Quickchange II, Stratagene). Sequencing of both clones confirmed the identity of the human Nanog cDNA wild type (TOPOT-Nanog) and D69E mutation (TOPO-mut -Nanog). In vitro transcription and translation were performed according to the manufacturer’s protocol (Promega, cat. no. L520A). TOPO-Nanog and TOPO-D69E-Nanog plasmid 1 µg was incubated at 30°C with T7 quick master mix and 1 mM methionine plus biotin–tRNA (Promega, cat. no. L506A) in a total volume of 50 µl. The reaction was stopped after 90 minutes, and aliquots frozen at −80 C°. Biotin labeled human hNanog and D69E-Nanog were detected after transfer to nitrocellulose membranes with streptavidin Alexa fluor 680- (Molecular Probes, cat. no. S21378, dilution 1/10000). Protein was digested with 40 ng recombinant active caspase-3 (BD Bioscience, cat. no. 51-66281V) in a total volume of 15 µl at pH 7.5 (6 mM Tris-Cl, 1.2 mM CaCl2; 1 mM KCl, 5 mM DTT; 1.5 mM MgCl2) (Laugwitz et al., 2001). The reaction product was run on 4–20% gradient PAGE gels (Bio-Rad), and protein was detected as previously described (streptavidin, Alexa Fluor 680 Odyssey system, LI-COR).
Detection of Nanog cleavage by endogenous caspase-3
Nanog and D69E-Nanog were cloned into the pEF1-luciferase-IRES-NEO vector (kindly provided by David Spencer, Baylor College of Medicine) by using XhoI and XbaI cloning sites, which together with a FLAG tag were added at the C-terminus by a PCR-based strategy with 5‘-ggactcgagatgagtgtggatccagcttgtcc-3’ and 5’-tcctctagatcacttatcgtcatccttgtaatc-3’ primers. The plasmid was transfected into 293 cells and R1 ES cells with lipofectamine 2000 (Invitrogen). R1 ES cells (1 × 10⁵) were plated into 6-well plates and transfected on the following day with 10 µl lipofectamine 2000 plus (Invitrogen, cat. no. 52887) with 4 µg plasmid DNA. Differentiation was induced with RA differentiation medium. Proteins were extracted with CHAPS buffer with two cycles of freezing (dry-ice) for 30 minutes and sonication with 20 pulses. Twenty µg of protein was subjected to PAGE (12% Bio-Rad, 2 hours at 80V) and transferred with TG buffer (Bio-Rad) supplemented with 0.05% SDS and 20% methanol to 0.2 µm nitrocellulose membranes (Bio-Rad). Detection was carried out with the FLAG antibody M2 (Stratagene, cat. no. 200470-21) in a 1/10,000 dilution in blocking buffer (Li-COR, cat. no. 927–4000). Equal loading was confirmed by probinding for alpha-tubulin (antibody D10, Santa Cruz, SC5274).
Nanog-inducible ES cell line
Nanog and mutated D69E cDNAs were obtained by EcoRI digestion of TOPO-Nanog and TOPO-mut-Nanog plasmids, as described previously. The inserts (1263 bp each) were filled with Klenow and ligated to the p2LoxP vector which was cut with SmaI and XhoI and klenowed. The vector was co-electroporated with pSalk-Cre into A2lox ES cells (960 µF, 220 millisec pulse, 15 × 106 cells). After electroporation, the cells were selected with 400 µg/ml of G418 (Invitrogen) and individual clones were picked, and subsequently expanded. Expression of inducible Nanog and inducible D69E Nanog was confirmed by western blotting and RT-PCR.
Nanog proliferation assay
Nanog and D69E-Nanog clones were plated at a density of 5000 cells into 96 well plates, incubated overnight and then stimulated with RA for specified times. Cells were then pulsed with methyl-3H thymidine (Perkin Elmer, NET027) for 3 hours, harvested (Packard Filtermate harvester) and scintillation counts were measured with the Packard Topocount-NXT Microplate Scintillation and Luminescence Counter.
Nanog competition assay
The inducible cell lines Nanog, D69E mutated Nanog, EGFP, and control A172 were plated and incubated over night with 1 µM doxycycline. The Nanog inducible, D69E Nanog and A172 ES cell lines were mixed with the EGFP inducible cell line in a ratio of 20:80 and plated on the next day. Cells were maintained in ES cell medium without LIF. The percentage of EGFP-positive cells was determined with a FACScan instrument (Becton Dickinson) on days 0, 4, 8, 12, and 16 days after plating.
Supplementary Material
Figure S1: Increased Caspase activity in ES cells upon induction of differentiation. The D3 ES cell line was stimulated with retinoic acid (RA) or N2B27 differentiation medium for the indicated times. Caspase activity was measured with an in vitro assay (see Supplementary Methods). Mean (+/− SD) measurements from triplicate experiments are shown.
Figure S2. Caspase sensor system. (A) The caspase sensor contains a nuclear translocation signal (NLS), enhanced yellow fluorescent protein (EYFP), a 30-nucleotide-long sequence encoding the caspase cleavage site of PARP-1, and a cytoplasmic translocation signal (NES). This fragment was integrated upstream of the HPRT locus in 17-2lox ES cells via Cre-mediated recombination, placing it under the control of a tetracycline response element (TRE). The tet transactivator (rtTA) is targeted to the rosa26 locus on chromosome 6. (B) Western blot of protein lysates extracted from cells treated as indicated at the top of the graphic. Only doxycycline-treated cells showed expression of the reporter protein, which was cleaved only after induction of apoptosis.
Figure S3. Characterization of Casp3 knockout ES cell lines. (A) Genotyping PCR analysis showing that the knockout ES cell lines 34A and 34B contain only the knockout allele (smaller fragment), whereas the cell lines 22A and 22B contain both the larger wild-type allele and the smaller knockout allele. (B) Differentiation of Casp3+/− and Casp3−/− ES cell lines stimulated according to an embryoid body differentiation protocol. Although both cell lines initially formed similar embryoid bodies poststimulation (day 4), there were clear differences on 8 days. The Casp3−/− ES cells remained largely compacted and showed typical ES cell morphology, whereas Casp3+/− ES cells had differentiated completely. This difference had become even more pronounced by day 12. (C) Quantification of Oct4 activity by semiquantitative reverse transcriptase PCR. On days 8 and 10, Casp3−/− cells had more Oct4 signal than did Casp3+/− cells, indicating delayed differentiation. (D) Experiment similar to that shown in panel C but with real-time quantitative PCR. ΔCT versus GAPDH values. Again, Casp3−/− ES cells differentiated more slowly than Casp3+/− ES cells.
Figure S4: Details of teratoma formation experiment. Casp3+/− teratomas form typical structures such as neural epithelium (top) cartilage (middle) and endodermal structures (bottom), whereas Casp3−/− tumors are extremely homogenous and largely contain undifferentiated cell types.
Figure S5. Inducible caspase-3 system. (A) The constitutively active Casp3 gene (Casp3rev) and a mutated version carrying a point mutation that renders the gene inactive (mCasp3rev) were subcloned (see Material and Methods). These fragments were then integrated upstream of the HPRT locus in A2Lox ES cells via Cre-mediated recombination, placing them under control of a tetracycline response element (TRE). The tet transactivator (rtTA) was targeted into to the Rosa26 locus on chromosome 6. (B) Western blot analysis of protein lysates extracted from two cell lines stimulated with increasing concentrations of doxycycline. Only doxycycline-treated cells carrying the Caspase-3 protein showed increased levels of active caspase-3. (C) Same two cell lines as shown in panels A and B were stimulated with doxycycline, and intrinsic caspase activity was measured with an in vitro Caspase activity assay (see Experimental Procedures). Values are means (+/− SD) of triplicate experiments.
Figure S6. mNanog is cleaved by caspases. (A) In vitro-translated mNanog is not cleaved by Caspase-3. (B) Caspase-3 activity assay (CaspGlo) reveals that both the hNanog caspase cleavage site peptide (DSPD) and the mNanog caspase cleavage site peptide (GSPD) effectively inhibit Caspase-3. (C) mNanog and mNanog (D67G) purified from ES cells by immunoprecipitation and exposed to recombinant Caspase-3 and Caspase-9. Only Caspase-9 effectively cleaved mNanog into a 27 kDa fragment. Mutation D67G in mNanog greatly diminished cleavage of mNanog by Caspase-9.
Figure S7. Inducible hNanog expression by in ES cells. (A) The hNanog gene and a mutated version carrying the point mutation D69E were subcloned. These fragments were integrated upstream of the HPRT locus in A2lox ES cells via Cre-mediated recombination, placing them under the control of a tetracycline response element (TRE). The tet transactivator (rtTA) is targeted to the Rosa26 locus on chromosome 6. (B) PCR analysis of RNA extracted from two cell lines stimulated with doxycycline. Only doxycycline-treated cells carrying wild-type or mutated hNanog showed increased levels of the transgene. (C) RT-PCR and simultaneous detection of endogenous Nanog and the hNanog transgene in cells stimulated with increasing concentrations of doxycycline. The highest concentration of doxycycline (1 µg/ml) results in a similar expression level of the hNanog transgenic as does the endogenous Nanog. (D) Phase-contrast, GFP channel and flow cytometry in mixing experiment carried out in Figure 4F. D69E hNanog samples showed a significant number of GFP-negative cells that grew in clusters with undifferentiated ES cell morphology, whereas most of the GFP-positive cells appeared to be differentiated.
Acknowledgements
We thank Dr. David Spencer (Baylor College of Medicine) for providing us with the EF1a-Luc-IRES-NEO vector and Kimberly Smuga-Otto and Kristopher Murphy for technical assistance. This work was supported by the Lance Armstrong Foundation (T.P.Z.), the Gillson Longenbaugh Foundation (T.P.Z.), the Tilker Medical Research Foundatiom (T.P.Z.), the Diana Helis Henry Medical Research Foundation (T.P.Z.), the Huffington Foundation (T.P.Z.), the Uehara Memorial Foundation (J.F.) and by the NIH (grant R01 EB005173-01, P20 EB007076 and P01 GM81627).
Footnotes
Publisher's Disclaimer: This is a PDF file of an unedited manuscript that has been accepted for publication. As a service to our customers we are providing this early version of the manuscript. The manuscript will undergo copyediting, typesetting, and review of the resulting proof before it is published in its final citable form. Please note that during the production process errors may be discovered which could affect the content, and all legal disclaimers that apply to the journal pertain.
References
- Arama E, Agapite J, Steller H. Caspase activity and a specific cytochrome C are required for sperm differentiation in Drosophila. Dev Cell. 2003;4:687–697. doi: 10.1016/s1534-5807(03)00120-5. [DOI] [PubMed] [Google Scholar]
- Bernstein BE, Mikkelsen TS, Xie X, Kamal M, Huebert DJ, Cuff J, Fry B, Meissner A, Wernig M, Plath K, et al. A bivalent chromatin structure marks key developmental genes in embryonic stem cells. Cell. 2006;125:315–326. doi: 10.1016/j.cell.2006.02.041. [DOI] [PubMed] [Google Scholar]
- Boyer LA, Lee TI, Cole MF, Johnstone SE, Levine SS, Zucker JP, Guenther MG, Kumar RM, Murray HL, Jenner RG, et al. Core transcriptional regulatory circuitry in human embryonic stem cells. Cell. 2005;122:947–956. doi: 10.1016/j.cell.2005.08.020. [DOI] [PMC free article] [PubMed] [Google Scholar]
- Boyer LA, Plath K, Zeitlinger J, Brambrink T, Medeiros LA, Lee TI, Levine SS, Wernig M, Tajonar A, Ray MK, et al. Polycomb complexes repress developmental regulators in murine embryonic stem cells. Nature. 2006;441:349–353. doi: 10.1038/nature04733. [DOI] [PubMed] [Google Scholar]
- Chambers I, Colby D, Robertson M, Nichols J, Lee S, Tweedie S, Smith A. Functional expression cloning of Nanog, a pluripotency sustaining factor in embryonic stem cells. Cell. 2003;113:643–655. doi: 10.1016/s0092-8674(03)00392-1. [DOI] [PubMed] [Google Scholar]
- Chickarmane V, Troein C, Nuber UA, Sauro HM, Peterson C. Transcriptional dynamics of the embryonic stem cell switch. PLoS Comput Biol. 2006;2:e123. doi: 10.1371/journal.pcbi.0020123. [DOI] [PMC free article] [PubMed] [Google Scholar]
- Damjanov I, Solter D. Experimental teratoma. Curr Top Pathol. 1974;59:69–130. doi: 10.1007/978-3-642-65857-0_2. [DOI] [PubMed] [Google Scholar]
- De Botton S, Sabri S, Daugas E, Zermati Y, Guidotti JE, Hermine O, Kroemer G, Vainchenker W, Debili N. Platelet formation is the consequence of caspase activation within megakaryocytes. Blood. 2002;100:1310–1317. doi: 10.1182/blood-2002-03-0686. [DOI] [PubMed] [Google Scholar]
- De Maria R, Testa U, Luchetti L, Zeuner A, Stassi G, Pelosi E, Riccioni R, Felli N, Samoggia P, Peschle C. Apoptotic role of Fas/Fas ligand system in the regulation of erythropoiesis. Blood. 1999a;93:796–803. [PubMed] [Google Scholar]
- De Maria R, Zeuner A, Eramo A, Domenichelli C, Bonci D, Grignani F, Srinivasula SM, Alnemri ES, Testa U, Peschle C. Negative regulation of erythropoiesis by caspase-mediated cleavage of GATA-1. Nature. 1999b;401:489–493. doi: 10.1038/46809. [DOI] [PubMed] [Google Scholar]
- Earnshaw WC, Martins LM, Kaufmann SH. Mammalian caspases: structure, activation, substrates, and functions during apoptosis. Annu Rev Biochem. 1999;68:383–424. doi: 10.1146/annurev.biochem.68.1.383. [DOI] [PubMed] [Google Scholar]
- Evans M. Isolation and Maintenance of Murine Embryonic Stem Cells. In: Lanza R, editor. Handbook of Stem Cells. Burlington: Elsevier Academic Press; 2004. pp. 413–417. [Google Scholar]
- Ishizaki Y, Jacobson MD, Raff MC. A role for caspases in lens fiber differentiation. J Cell Biol. 1998;140:153–158. doi: 10.1083/jcb.140.1.153. [DOI] [PMC free article] [PubMed] [Google Scholar]
- Ivanova N, Dobrin R, Lu R, Kotenko I, Levorse J, DeCoste C, Schafer X, Lun Y, Lemischka IR. Dissecting self-renewal in stem cells with RNA interference. Nature. 2006;442:533–538. doi: 10.1038/nature04915. [DOI] [PubMed] [Google Scholar]
- Kamada S, Kusano H, Fujita H, Ohtsu M, Koya RC, Kuzumaki N, Tsujimoto Y. A cloning method for caspase substrates that uses the yeast two-hybrid system: cloning of the antiapoptotic gene gelsolin. Proc Natl Acad Sci U S A. 1998;95:8532–8537. doi: 10.1073/pnas.95.15.8532. [DOI] [PMC free article] [PubMed] [Google Scholar]
- Kidd VJ. Proteolytic activities that mediate apoptosis. Annu Rev Physiol. 1998;60:533–573. doi: 10.1146/annurev.physiol.60.1.533. [DOI] [PubMed] [Google Scholar]
- Kuida K, Zheng TS, Na S, Kuan C, Yang D, Karasuyama H, Rakic P, Flavell RA. Decreased apoptosis in the brain and premature lethality in CPP32-deficient mice. Nature. 1996;384:368–372. doi: 10.1038/384368a0. [DOI] [PubMed] [Google Scholar]
- Kyba M, Perlingeiro RC, Hoover RR, Lu CW, Pierce J, Daley GQ. Enhanced hematopoietic differentiation of embryonic stem cells conditionally expressing Stat5. Proc Natl Acad Sci U S A. 2003;100 Suppl 1:11904–11910. doi: 10.1073/pnas.1734140100. [DOI] [PMC free article] [PubMed] [Google Scholar]
- Laugwitz KL, Moretti A, Weig HJ, Gillitzer A, Pinkernell K, Ott T, Pragst I, Stadele C, Seyfarth M, Schomig A, Ungerer M. Blocking caspase-activated apoptosis improves contractility in failing myocardium. Hum Gene Ther. 2001;12:2051–2063. doi: 10.1089/10430340152677403. [DOI] [PubMed] [Google Scholar]
- Lazebnik YA, Kaufmann SH, Desnoyers S, Poirier GG, Earnshaw WC. Cleavage of poly(ADP-ribose) polymerase by a proteinase with properties like ICE. Nature. 1994;371:346–347. doi: 10.1038/371346a0. [DOI] [PubMed] [Google Scholar]
- Lee TI, Jenner RG, Boyer LA, Guenther MG, Levine SS, Kumar RM, Chevalier B, Johnstone SE, Cole MF, Isono K, et al. Control of developmental regulators by Polycomb in human embryonic stem cells. Cell. 2006;125:301–313. doi: 10.1016/j.cell.2006.02.043. [DOI] [PMC free article] [PubMed] [Google Scholar]
- Lin T, Chao C, Saito S, Mazur SJ, Murphy ME, Appella E, Xu Y. p53 induces differentiation of mouse embryonic stem cells by suppressing Nanog expression. Nat Cell Biol. 2005;7:165–171. doi: 10.1038/ncb1211. [DOI] [PubMed] [Google Scholar]
- Mitsui K, Tokuzawa Y, Itoh H, Segawa K, Murakami M, Takahashi K, Maruyama M, Maeda M, Yamanaka S. The homeoprotein Nanog is required for maintenance of pluripotency in mouse epiblast and ES cells. Cell. 2003;113:631–642. doi: 10.1016/s0092-8674(03)00393-3. [DOI] [PubMed] [Google Scholar]
- Okita K, Ichisaka T, Yamanaka S. Generation of germline-competent induced pluripotent stem cells. Nature. 2007 doi: 10.1038/nature05934. [DOI] [PubMed] [Google Scholar]
- Pan GJ, Pei DQ. Identification of two distinct transactivation domains in the pluripotency sustaining factor nanog. Cell Res. 2003;13:499–502. doi: 10.1038/sj.cr.7290193. [DOI] [PubMed] [Google Scholar]
- Perng GC, Jones C, Ciacci-Zanella J, Stone M, Henderson G, Yukht A, Slanina SM, Hofman FM, Ghiasi H, Nesburn AB, Wechsler SL. Virus-induced neuronal apoptosis blocked by the herpes simplex virus latency-associated transcript. Science. 2000;287:1500–1503. doi: 10.1126/science.287.5457.1500. [DOI] [PubMed] [Google Scholar]
- Silva J, Chambers I, Pollard S, Smith A. Nanog promotes transfer of pluripotency after cell fusion. Nature. 2006;441:997–1001. doi: 10.1038/nature04914. [DOI] [PubMed] [Google Scholar]
- Srinivasula SM, Ahmad M, MacFarlane M, Luo Z, Huang Z, Fernandes-Alnemri T, Alnemri ES. Generation of constitutively active recombinant caspases-3 and -6 by rearrangement of their subunits. J Biol Chem. 1998;273:10107–10111. doi: 10.1074/jbc.273.17.10107. [DOI] [PubMed] [Google Scholar]
- Szutorisz H, Georgiou A, Tora L, Dillon N. The proteasome restricts permissive transcription at tissue-specific gene loci in embryonic stem cells. Cell. 2006;127:1375–1388. doi: 10.1016/j.cell.2006.10.045. [DOI] [PubMed] [Google Scholar]
- Thornberry NA, Lazebnik Y. Caspases: enemies within. Science. 1998;281:1312–1316. doi: 10.1126/science.281.5381.1312. [DOI] [PubMed] [Google Scholar]
- Woo M, Hakem R, Soengas MS, Duncan GS, Shahinian A, Kagi D, Hakem A, McCurrach M, Khoo W, Kaufman SA, Senaldi G, Howard T, Lowe SW, Mak TW. Essential contribution of caspase-3/CPP32 to apoptosis and iys associated nuclear changes. Genes Dev. 1998;12:806–819. doi: 10.1101/gad.12.6.806. [DOI] [PMC free article] [PubMed] [Google Scholar]
- Yamane T, Dylla SJ, Muijtjens M, Weissman IL. Enforced Bcl-2 expression overrides serum and feeder cell requirements for mouse embryonic stem cell self-renewal. Proc Natl Acad Sci U S A. 2005;102:3312–3317. doi: 10.1073/pnas.0500167102. [DOI] [PMC free article] [PubMed] [Google Scholar]
- Yin Q, Park HO, Chung JY, Lin S-C, Lo Y-C, da Graca LS, Jiang X, Wu H. Caspase-9 Holoenzyme Is a Specific and Optimal Procaspase-3 processing Machine. Mol. Cell. 2006;22:259–268. doi: 10.1016/j.molcel.2006.03.030. [DOI] [PMC free article] [PubMed] [Google Scholar]
- Ying QL, Stavridis M, Griffiths D, Li M, Smith A. Conversion of embryonic stem cells into neuroectodermal precursors in adherent monoculture. Nat Biotechnol. 2003;21:183–186. doi: 10.1038/nbt780. [DOI] [PubMed] [Google Scholar]
- Zou H, Yang R, Hao J, Wang J, Sun C, Fesik SW, Wu JC, Tomaselli KK, Armstrong RC. Regulation of the Apaf-1/Caspase-9 Apoptosome by Caspase-3 and XIAP. J Bio Chem. 2003;278:8092–8098. doi: 10.1074/jbc.M204783200. [DOI] [PubMed] [Google Scholar]
Associated Data
This section collects any data citations, data availability statements, or supplementary materials included in this article.
Supplementary Materials
Figure S1: Increased Caspase activity in ES cells upon induction of differentiation. The D3 ES cell line was stimulated with retinoic acid (RA) or N2B27 differentiation medium for the indicated times. Caspase activity was measured with an in vitro assay (see Supplementary Methods). Mean (+/− SD) measurements from triplicate experiments are shown.
Figure S2. Caspase sensor system. (A) The caspase sensor contains a nuclear translocation signal (NLS), enhanced yellow fluorescent protein (EYFP), a 30-nucleotide-long sequence encoding the caspase cleavage site of PARP-1, and a cytoplasmic translocation signal (NES). This fragment was integrated upstream of the HPRT locus in 17-2lox ES cells via Cre-mediated recombination, placing it under the control of a tetracycline response element (TRE). The tet transactivator (rtTA) is targeted to the rosa26 locus on chromosome 6. (B) Western blot of protein lysates extracted from cells treated as indicated at the top of the graphic. Only doxycycline-treated cells showed expression of the reporter protein, which was cleaved only after induction of apoptosis.
Figure S3. Characterization of Casp3 knockout ES cell lines. (A) Genotyping PCR analysis showing that the knockout ES cell lines 34A and 34B contain only the knockout allele (smaller fragment), whereas the cell lines 22A and 22B contain both the larger wild-type allele and the smaller knockout allele. (B) Differentiation of Casp3+/− and Casp3−/− ES cell lines stimulated according to an embryoid body differentiation protocol. Although both cell lines initially formed similar embryoid bodies poststimulation (day 4), there were clear differences on 8 days. The Casp3−/− ES cells remained largely compacted and showed typical ES cell morphology, whereas Casp3+/− ES cells had differentiated completely. This difference had become even more pronounced by day 12. (C) Quantification of Oct4 activity by semiquantitative reverse transcriptase PCR. On days 8 and 10, Casp3−/− cells had more Oct4 signal than did Casp3+/− cells, indicating delayed differentiation. (D) Experiment similar to that shown in panel C but with real-time quantitative PCR. ΔCT versus GAPDH values. Again, Casp3−/− ES cells differentiated more slowly than Casp3+/− ES cells.
Figure S4: Details of teratoma formation experiment. Casp3+/− teratomas form typical structures such as neural epithelium (top) cartilage (middle) and endodermal structures (bottom), whereas Casp3−/− tumors are extremely homogenous and largely contain undifferentiated cell types.
Figure S5. Inducible caspase-3 system. (A) The constitutively active Casp3 gene (Casp3rev) and a mutated version carrying a point mutation that renders the gene inactive (mCasp3rev) were subcloned (see Material and Methods). These fragments were then integrated upstream of the HPRT locus in A2Lox ES cells via Cre-mediated recombination, placing them under control of a tetracycline response element (TRE). The tet transactivator (rtTA) was targeted into to the Rosa26 locus on chromosome 6. (B) Western blot analysis of protein lysates extracted from two cell lines stimulated with increasing concentrations of doxycycline. Only doxycycline-treated cells carrying the Caspase-3 protein showed increased levels of active caspase-3. (C) Same two cell lines as shown in panels A and B were stimulated with doxycycline, and intrinsic caspase activity was measured with an in vitro Caspase activity assay (see Experimental Procedures). Values are means (+/− SD) of triplicate experiments.
Figure S6. mNanog is cleaved by caspases. (A) In vitro-translated mNanog is not cleaved by Caspase-3. (B) Caspase-3 activity assay (CaspGlo) reveals that both the hNanog caspase cleavage site peptide (DSPD) and the mNanog caspase cleavage site peptide (GSPD) effectively inhibit Caspase-3. (C) mNanog and mNanog (D67G) purified from ES cells by immunoprecipitation and exposed to recombinant Caspase-3 and Caspase-9. Only Caspase-9 effectively cleaved mNanog into a 27 kDa fragment. Mutation D67G in mNanog greatly diminished cleavage of mNanog by Caspase-9.
Figure S7. Inducible hNanog expression by in ES cells. (A) The hNanog gene and a mutated version carrying the point mutation D69E were subcloned. These fragments were integrated upstream of the HPRT locus in A2lox ES cells via Cre-mediated recombination, placing them under the control of a tetracycline response element (TRE). The tet transactivator (rtTA) is targeted to the Rosa26 locus on chromosome 6. (B) PCR analysis of RNA extracted from two cell lines stimulated with doxycycline. Only doxycycline-treated cells carrying wild-type or mutated hNanog showed increased levels of the transgene. (C) RT-PCR and simultaneous detection of endogenous Nanog and the hNanog transgene in cells stimulated with increasing concentrations of doxycycline. The highest concentration of doxycycline (1 µg/ml) results in a similar expression level of the hNanog transgenic as does the endogenous Nanog. (D) Phase-contrast, GFP channel and flow cytometry in mixing experiment carried out in Figure 4F. D69E hNanog samples showed a significant number of GFP-negative cells that grew in clusters with undifferentiated ES cell morphology, whereas most of the GFP-positive cells appeared to be differentiated.