

Abstract
Respiratory motion compensation for cardiac imaging requires knowledge of the heart's motion and deformation during breathing. This paper presents a method for measuring the natural tidal respiratory motion of the heart from free breathing coronary angiograms. A three-dimensional (3-D) deformation field describing the cardiac and respiratory motion of the coronary arteries is recovered from a biplane acquisition. A cardiac respiratory parametric model is formulated and used to decompose the deformation field into cardiac and respiratory components. Angiograms from ten patients were analyzed. A 3-D translation motion model was sufficient for describing the motion of the heart in only two patients. For all patients, the heart translated caudally (mean, 4.9 ± 1.9 mm; range, 2.4 to 8.0 mm) and underwent a cranio-dorsal rotation (mean, 1.5° ± 0.9°; range, 0.2° to 3.5°) during inspiration. In eight patients, the heart also translated anteriorly (mean, 1.3 ± 1.8 mm; range, −0.4 to 5.1 mm) and rotated in a caudo-dextral direction (mean, 1.2° ± 1.3°; range, −1.9° to 3.2°).
Index Terms: Chest imaging, magnetic resonance imaging, modeling, motion analysis, motion compensation, X-ray angiography
I. Introduction
Breathing during magnetic resonance (MR) imaging of the heart generates image artifacts [1]. Short acquisitions can be completed during a breath hold, but this approach does not necessarily eliminate respiratory motion and can alter physiologic conditions [2]. Some imaging methods, such as three-dimensional (3-D) and coronary MR angiography, take longer to complete, but dividing the acquisition into multiple short breath holds introduces potential misregistration artifacts. Consequently, there is a need to understand the respiratory motion of the heart in order to improve respiratory gating and motion correction solutions for free breathing imaging acquisitions.
More than 30 years ago, Dougherty studied the effects of respiration on the electrocardiogram (ECG), and noted that Einthoven had concluded in 1913 that the heart undergoes anatomic rotation in the frontal plane with respiration [3], [4]. Motivated by the development of computed tomography and its potential uses for thoracic imaging, Bogren provided the first quantitative study of the respiratory motion of the heart from X-ray cineangiograms [5]. He observed that the inferior-superior (IS) motion at the valve planes was approximately half as much as the IS motion of the diaphragm, which averaged 15 mm (range = 1 – 19 mm) during normal respiration. The existence of an anatomic rotation of the heart during respiration was substantiated using contours of the cardiac silhouette, and from heterogeneous measurements of displacement along the length of the right coronary artery (RCA) in a projection image.
Nearly 20 years later, and driven by respiratory limitations in cardiac MR imaging, the problem re-appeared. Wang used two-dimensional (2-D) MR images at multiple breath-hold levels to conclude that the primary motion of the heart was translation in the IS direction, and that IS motion of the heart at the level of the coronary ostia was between 0.6–0.7 times the IS displacement of the diaphragm [6]. A report of 12 volunteers using real-time 2-D MR imaging during free breathing validated this mean ratio, but reported high variability both between subjects and within each individual [7]. However, these studies were limited by the use of 2-D imaging methods, which restricted the results to the family of translational motion models. Due to through-plane motion, the landmark seen in a given imaging plane is not guaranteed to be the same material point observed in the plane at a later time.
Three recent efforts used 3-D MR imaging to study respiratory motion. In one, 3-D datasets of the whole heart were acquired at multiple breath-hold levels, and registered using an image intensity based method [8]. In another, 3-D slabs were reconstructed for three respiratory phases during free breathing and selected coronary landmarks were tracked [9]. The third study presented differences between free-breathing and multiple breath-hold studies in the same patients [10]. Due to the limitations of MRI, the free breathing studies were acquired and averaged over multiple breathing cycles. In addition, the studies had limited temporal (70–352 ms) and spatial resolution (3- to 6-mm slice thickness).
This paper presents a method for measuring the respiratory motion of the heart by tracking the coronary arteries in a free breathing cine-angiogram. X-ray angiography is the clinically accepted modality for imaging the coronary arteries because of its high temporal and spatial resolution. A 3-D coronary tree model is reconstructed from a biplane acquisition, and its motion is tracked through the images [11]. Three different motion models – translation, rigid body, and affine – are tested for their ability to describe the respiratory motion and/or deformation of the coronary arteries. This analysis is performed on mid-diastolic images captured at different respiratory states. Then, a cardiac respiratory parametric model is formulated and used to decompose the motion of the arteries into cardiac and respiratory components. The beating motion of heart is mathematically arrested, allowing the tidal breathing motion of the heart to be studied throughout the respiratory cycle.
The bulk motion of the heart is inferred from the motion of the coronary arteries, which branch out and span the epicardial surface of the myocardium, and which are attached to the underlying muscle through branching vessels which penetrate the myocardium.
II. Methods
A. Notation and Coordinate Systems
Lower case letters (e.g., n, t, ρ) represent scalar values. Bold lower case letters represent a vector (e.g., q = [qx, qy, qz]). Upper case letters (e.g., U, V) represent matrices. Sets are represented by upper case Greek letters (e.g.,Υ, Λ). Three-dimensional transformations are represented by upper case script letters (e.g.,ℳ, 𝒯, 𝒜, ℛ).
A right handed coordinate system coincident with the patient's body is used. The x axis corresponds to a left-right (LR) axis, with +x directed toward the patient's left. The y axis corresponds to an inferior-superior (IS), or caudo-cranial, axis, with +y pointed inferiorly. The z axis corresponds to a posterior-anterior (PA) axis with +z directed posterior. A +LR rotation is from +IS to +PA, or an inferior-to-posterior rotation (cranio-ventral). A +IS rotation is from +PA to +LR, or a posterior-to-left rotation (antero-dextral). A +PA rotation is from +LR to +IS, or a left-to-inferior rotation (caudo-dextral).
B. Imaging Protocol
Patients undergoing diagnostic left heart catheterization were recruited to participate in an IRB approved protocol. All images were acquired on a Siemens biplane cardiovascular angiography system. A personal computer with digital acquisition system recorded the ECG, and an image acquire signal from the Siemens digital acquisition subsystem. Each dataset recorded a 4- to 8-s contrast injection opacifying either the left or or right coronary tree. The patients received no instruction regarding their breathing. The orientation of the imaging C-arms was not constrained, and varied from patient to patient. The frame rate was 30 frames/s.
Images of a calibration grid and phantom were acquired with the imaging system in the same configurations used for the acquisition of patient data. Images of the grid were used to compensate for the geometric distortion of the image intensifier. The plastic rectangular phantom (9.8 × 12.1 × 3.8 cm) containing 18 metal beads was reconstructed and compared to its known geometry in order to optimize the imaging parameters and validate the accuracy of the 3-D reconstruction. Further details of this calibration method can be found in [12].
C. Cardiac Respiratory Phase Plane (CRPP)
Each angiogram image was assigned a cardiac and respiratory phase. Cardiac phase (χ) represents the percentage of the cardiac cycle, with the QRS peak at χ = 0. Beat-to-beat variations in heart rate were normalized by calculating the systolic and diastolic intervals using the method of [13]. The systolic interval was then linearly rescaled between [0, 0.42), which corresponds to the systolic interval of a 60 beat/minute heart rate. The diastolic interval was rescaled between [0.42, 1). Thus, each dataset, had a cardiac phase 0 ≤ χ < 1.
Respiratory phase (ρ) was measured directly from the images by taking a profile through the diaphragm (Fig. 1). The displacement of the diaphragm-lung interface relative to end-expiration (EE) is used as a measure of respiratory phase. ρ = 0 at EE, and ρ = ±1 at end-inspiration (EI). The sign of ρ depends on whether it is an inspiratory (−) or expiratory (+) maneuver. Since the diaphragm could not be reconstructed from the images, it was not possible to measure the absolute diaphragmatic displacement during breathing.
Fig. 1.

(a) Respiratory phase is measured by tracking the displacement of the diaphragm along a profile in the angiogram images. (b) The displacement of the lung-diaphragm interface is shown as a function of image number for the profile shown in (a).
The CRPP is introduced to help understand and formalize the physiologic motion of the heart [Fig. 2(a)] [14]. The cardiac phase is plotted along the abscissa and the respiratory phase along the ordinate axis. In contrast to the formal definition of a plane, the CRPP is finite and periodic. The respiratory phase treats the expiratory (lower half of plane) and the inspiratory portions of respiration separately because of known hysteresis in the motion [15]. Systole comprises the left portion of the plane, with diastole to the right.
Fig. 2.
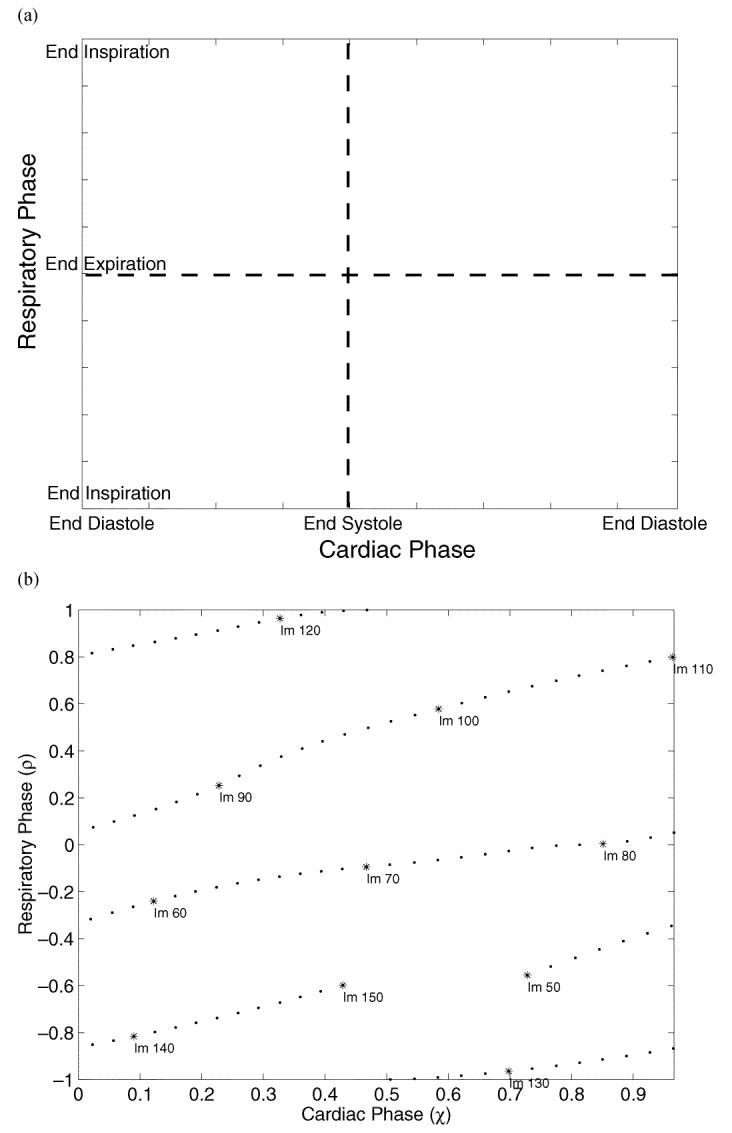
(a) The cardiac respiratory phase plane (CRPP). (b) The CRPP representation corresponding to the data of Fig. 1 is shown. Because the tree is not fully opacified at the start and end of the injection, only images which can be used for tracking the motion of the heart are shown. The label “Im N” represents the Nth image of the angiogram sequence. The sampling density on this plane depends on the frame rate, heart rate, respiratory rate, and the duration of the contrast injection.
The CRPP representation of an acquired dataset is shown in Fig. 2(b). When the trajectories extend to the right of the plane, they are wrapped back onto the left. Similarly, the area above wraps to the bottom of the plane.
D. Motion Tracking in Biplane Cineangiograms
A deforming 3-D (3D + t) model of the vessels is generated for each biplane cine-angiogram dataset. The method for generating these 3D + t model is presented in [11], and is briefly summarized here.
First, a static 3-D model of the coronary arteries, Υ0 is reconstructed at end-diastole. Using a semi-interactive segmentation tool, a user draws the arterial centerlines in one pair of projection images. This process is constrained by a potential field generated using multiscale filters which detect rectilinear structures such as vessels [16]. The epipolar constraint is used to define point to point correspondences between the arteries' two projections, and a tree of 3-D cubic B-spline curves is constructed using a dynamic programming algorithm [17].
The arterial model Υ0 serves as the initialization for an automatic motion tracking algorithm that recovers the motion of the arteries from the cine-angiogram images. The algorithm computes the transformations ℳ : ℝ3 → ℝ3 which keep the arteries' projection onto the image planes consistent with the temporally changing images [11]. If Υ0 was reconstructed from image pair t0, then the transformation ℳ maps any 3-D point q0 ∈ Λ0 to the point's 3-D position consistent with image t0+t
| (1) |
which is also written as
| (2) |
to represent the deformation of the whole arterial tree,
To take advantage of the heuristic knowledge that the deformation field is spatially regular, a B-spline parametric deformation field is used. Specifically
| (3) |
where
| (4) |
d : ℝ3 → ℝ3 is a 3-D displacement vector generated by a 3-D tensor product B-spline (B-solid), where the {uijk[t] ∈ ℝ3} are the ni × nj × nk control point vectors for image t, and the {b.,p : ℝ → ℝ} are the pth degree B-spline basis functions [18]. C2 continuity of the deformation field is maintained over the B-solid volume by using cubic B-spline basis functions (p = 3). Each B-spline basis function is defined on a uniform knot vector over the coronary tree range in that dimension.
The deformation field is recovered sequentially for each biplane image pair using an iterative gradient descent method. A 3-D root-mean-square (rms) error of 0.69 mm was found for the reconstruction and motion tracking procedure using a coronary phantom. A more complete description of this energy minimization algorithm and results of validation experiments can be found in [11].
E. Respiratory Motion: Translation, Rigid Body, Affine, or More?
After tracking the motion of the arteries in each dataset, it is possible to create a 3-D model of the coronary arteries for each image pair in the biplane cine-angiogram. This set of arterial trees Λ = {Υt} is generated using (2). A 3-D rms distance can be defined between two coronary trees in Λ
| (5) |
where qj,i is one of n samples of Υj = ℳ[Υ0, j] and qk,i is the matching point in Υk = ℳ[Υ0,k].
A subset of coronary trees Λdiastasis ⊂ Λ at diastasis are identified. Diastasis was defined by inspecting the sequence of images and selecting the time point in diastole corresponding to minimum coronary motion. The subset corresponds to images found along a vertical line in the CRPP. The tree in Λdiastasis with respiratory phase closest to end-expiration is used as the reference model,ΥEE. Computing e3-D of the other trees in Λdiatasis to ΥEE measures the magnitude of the respiratory motion of the coronaries from EE.
In order to further characterize the motion during respiration, three different motion models were investigated: 1) a 3-D translation motion model 𝒯; 2) a 3-D rigid body transformation ℛ; and 3) a 3-D affine deformation 𝒜. The rigid body motion model includes the translational motion model, as well as a 3-D rotation. The affine deformation extends the rigid body motion model with three shear and three scale parameters.
For some coronary tree Υj ∈ Λdiastasis, there is an optimal 3-D translation which registers Υj with ΥEE
| (6) |
where 𝒯[Υj] is the 3-D translation of coronary tree Υj. The transformation 𝒯 can be recovered with a closed form linear least squares method since the pairwise matching of points between Υj and ΥEE is known (remember: both trees are related to Υ0 by ℳ). Thus, e𝒯 is a measure of the residual error after optimal registration of two coronary trees using a 3-D translation motion model.
In a similar manner, it is possible to define the residual error for a rigid body transformation
| (7) |
and an affine transformation
| (8) |
F. Cardiac and Respiratory Parametric Model (CRPM)
The 3D + t coronary deformation field calculated from the angiogram images captures the interplay of cardiac and respiratory motion. In order to quantify the respiratory motion alone, the deformation field is parameterized into independent cardiac and respiratory components.
1) Theory
Each control point of the deformation B-solid (see (4)) is parameterized separately. The discrete function uijk[t] describes the (i, j, k)th control point's variation through the angiogram image sequence. Plotting the x, y, and z components of uijk[t] as a function of the image number t reveals that the signal has components that correlate with the cardiac phase, and an underlying respiratory motion (Fig. 3).
Fig. 3.

An RCA is shown in relation to its B-solid. The B-solid deforms the space and the arteries within,such that the projected motion of the arteries is consistent with the biplane angiogram images. The x, y, and z displacements of one B-solid control point are shown as a function of the angiogram image number. The plots show four cardiac cycles and a slower respiratory drift spanning 100 images(3.3 s). The CRPP representation of the data is shown in Fig. 2(b).
Since each image frame is associated with a cardiac and respiratory phase, the B-solid control points can be expressed as a function of these phases, where
| (9) |
Using the CRPP framework, consider that there exists a function ûijk(χ, ρ) defined for all cardiac and respiratory phases, and that uijk[χt, ρt] is a sampling of that function for some combinations of cardiac and respiratory phases.
In choosing a model ûijk(χ, ρ), it should capture the temporal smoothness characteristic of physiologic motion, and display periodicity in the cardiac and respiratory cycles. The function should support interpolation of the deformation field at cardiac-respiratory phase combinations other than those captured in the angiogram. Most importantly, the function needs to facilitate the separation of the cardiac and respiratory motion. For these reasons, ûijk(χ, ρ) is modeled as the sum of two periodic B-spline parametric functions
| (10) |
where {v ∈ ℝ3} are the nχ + nρ control point vectors, and the {b.,p : ℝ → ℝ} are the pth degree B-spline basis functions. The control points are spaced uniformly over the range of cardiac and respiratory phase values using a periodic and uniform knot vector. The control points v are computed so that
| (11) |
for the tn sampled points on the CRPP. Equation (10) is the cardiac respiratory parametric model (CRPM), where the first summation term represents the cardiac motion, and the second represents the respiratory motion.
2) Fitting the CRPM
Each spatial dimension of each B-solid control point is fit independently. For clarity, the second subscript representing polynomial degree of the B-spline basis function is omitted. Also, the subscript ijk is dropped from uijk, and the solution is described for ux, the dimension of u.
Suppose that there is data for tn+1 cardiac-respiratory phases
| (12) |
then, the right-hand side of (10) can be written in matrix form
| (13) |
where
| (14) |
| (15) |
| (16) |
and
| (17) |
The set of observation are represented as a column vector
| (18) |
so that (11) can be written as
| (19) |
The linear minimum mean-square estimate of Vx is obtained by solving
| (20) |
where STS is a second derivative constraint on the respiratory components of Vx, and α2 is a parameter that controls the amount of smoothing [19], [20]. α2 is empirically determined and set to 1 for all the datasets that were analyzed. The smoothing matrix S is
| (21) |
where 0n × m is an n × m zero matrix, and Sρ is the nρ × nρ first derivated matrix
| (22) |
In practice, cubic B-spline basis functions were used ( pχ = pρ = 3 ), with nρ = 10 control points in the respiratory dimension. The number of control points used for the cardiac motion was calculated using a subset of the ux[χt, ρt] corresponding to one cardiac cycle. This subset, Γ, was selected so that it captured a minimum of respiratory motion, which for most datasets was possible at end-expiration.
Γ was further subdivided by even and odd t into Γe and Γo. A cross validation technique, in which half the data is used to the model and the remainder used for testing the model, was used to calculate the optimal number of control points nχ. The values of ux ∈ Γe were fit using the cardiac portion of the CRPM [nρ = 0 in (10)], and the rms error of the fit
| (23) |
was computed for the n samples ux [χi, ρi] ∈ Γo.
This cross-validation technique creates a parabolic error function as a function of cardiac control point number. Increasing the number of control points initially improves the quality of the fit, until a point at which over-fitting introduces oscillations which are detected using this cross-validation method. The inflection point of the error function identifies the optimal number of cardiac control points.
3) Validating the CRPM
After fitting the CRPM to data, a new deformation B-solid can be generated for any cardiac-respiratory phase combination. The model is validated by generating a set of B-solids corresponding to the cardiac-respiratory phase combinations which are captured in the images. Recalling that ℳ is the transformation which tracks the coronary artery tree Υ0 through a cine-angiogram dataset, then this new set of B-solids generated from the CRPM is called ℳ̂. Validating the CRPM is performed by asking whether
| (24) |
For angiogram image t, it is possible to generate two coronary trees Υt and [unk]
| (25) |
| (26) |
A3-D rms error between the two trees can be quantified by computing . Taking for all the images in a cine-angiogram sequence and computing the mean and standard deviation provides a measure of the ability of the CRPM to explain the coronary artery motion that was measured by the motion tracking algorithm described in Section II-D.
G. Measuring Respiratory Motion Parameters
After parameterizing each dataset using the CRPM, it was possible to separate the respiratory and cardiac motions of the heart. A new set of respiration-only B-solid deformation fields was created by evaluating the CRPM at different respiratory phases, for a constant cardiac phase in diastasis. These new deformation fields represent the motion of the coronary tree due only to respiration.
The original reconstructed coronary model Υ0 was deformed by these respiration-only deformation fields, and a set of coronary models at different respiratory phases was generated. The motion of the coronary tree was computed by registering the end-expiratory coronary tree with the trees at other respiratory phases using a rigid body motion model. The registration algorithm was previously described in Section II-E.
Before registration, the coronary trees in each dataset were translated so that the center of mass of the end-expiratory coronary tree was at the origin of the coordinate system. The rotation parameters of the registration are not affected by this offset displacement. However, this initialization step ensures that the translation parameters are not artificially influenced by any rotational motion.
III. Results
Coronary angiograms were acquired for 8 male and 2 female patients. The mean age, weight, and height of the patients were 65±11 years, 86±17 kg, 176±11 cm, respectively. There were four cases of mild dilated cardiomyopathy, and two mild to moderate cases of hypertrophic disease. A mean ejection fraction of 58±8% (range = 40% – 65%) was measured by left ventriculography. In total, 12 left coronary and 4 right coronary datasets were analyzed since multiple contrast injections were available for four patients. The mean length of the reconstructed left coronary trees was 26 ± 7 cm (range = 16 – 38 cm). The mean length of the reconstructed right coronary trees was 19 ± 4 cm (range= 14 – 24 cm).
The automatic motion tracking algorithm was applied in each cine-angiogram to the subset of images that had well opacified arteries. On average, this was 111 ± 18 image pairs, or 3.7 ± 0.6 s/dataset (range = 81 – 160 images). The datasets capture the motion of the heart through approximately one respiratory cycle.
Fig. 4 shows sample tracking results for one patient. The images show two pairs of biplane images at diastasis, one at end expiration and one near end inspiration during tidal breathing. The motion tracking algorithm is deforming a 3-D coronary model representing the left main, left anterior descending, proximal segment of the circumflex, and the first obtuse marginal. The projection of the model onto the images (white lines) shows that the results of the motion tracking algorithm are consistent with the motion of the arteries seen in the angiogram. The 3-D coronary tree model corresponding to these images are shown in Fig. 5.
Fig. 4.

Biplane images of patient P2 at tidal end expiration and end inspiration. The images show the heart in diastasis. The white lines represent the projection of a 3-D coronary tree model onto the imaging planes. The 3-D deformation of the coronary tree is calculated automatically using a motion tracking algorithm.
Fig. 5.
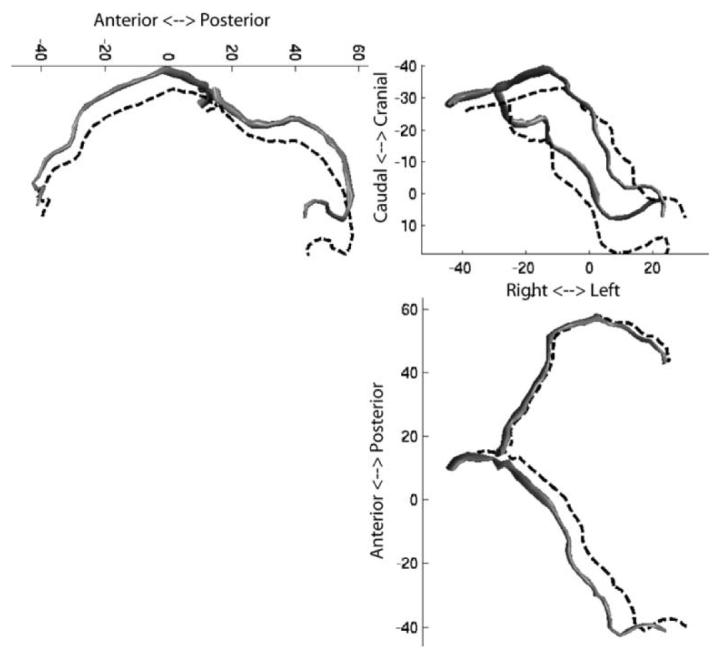
Three orthogonal projections of patient P2's coronary arteries at tidal end expiration (solid model) and end inspiration (dotted lines). The arteries are shown at a mid-diastolic (diastasis) cardiac phase. Clockwise from top left: LR projection; PA projection; IS projection.
A. Translation, Rigid Body, Affine, or More?
For each patient, images at diastasis were identified. For the left coronary studies this corresponded to ; for the right coronary studies, . The values are consistent with previously reported measurements [21]. One image was selected for each heartbeat, so that the number of images selected per patient was between 3–6, depending on the duration of the contrast injection and heart rate.
Since the patients' breathing was unconstrained, a diastasis image at the absolute EE (ρ = 0) was not guaranteed. So, the image nearest to EE was selected as the reference state. The average |ρ| of the selected EE images was 0.05 ± 0.06.
Similarly, finding a diastasis image at EI (|ρ| = 1) was not guaranteed, so the image nearest to EI was identified in each dataset. The average |ρ| of the selected EI images was 0.88 ± 0.14.
1) Left Coronary Tree
One randomly chosen left coronary dataset was analyzed in patients for which multiple injections were available. For the left coronary tree, the selected EE and EI images spanned an average of 82±15% of the respiratory cycle, and the patient-averaged 3-D rms displacement of the coronary tree was ē3-D = 6.1 ± 1.8 mm (range = 3.8 – 9.7 mm)
The coronary tree corresponding to the EI image was registered to the EE coronary tree using a 3-D translation model. The residual 3-D rms error eT ≤ 1 mm in 1/9 patients. After optimal 3-D rigid body registration, eR ≤ 1 mm in 6/9 patients. With a 3-D affine registration, eA ≤ 1 mm in 7/9 patients. Fig. 6 shows the results of the registration using the 3 different motion models in one patient.
Fig. 6.

Tidal end inspiration images for patient P2. The white lines represent the projection of a 3-D coronary tree onto the images. The first column shows the ability of a 3-D translation motion model to register the coronary tree reconstructed at end expiration to these end inspiration images. The second and third columns show a rigid and affine motion model, respectively. An improvement in the fit is seen from left to right, but there is evidence of residual local deformation.
Fig. 7 shows the residual registration errors from EE to EI for the different patients and motion models. The residual 3-D rms error for patients P2 and P3 remained above 1 mm with the 3-D affine registration, suggesting the presence of local deformations of the left coronary tree from EI to EE during tidal breathing.
Fig. 7.

Residual errors of three motion models used to characterize the tidal respiratory motion of the left coronary tree for nine patients.e3-D is a baseline 3-D rms distance between the coronary tree at the respiratory extremes.eT, eR, and eA are the residual 3-D rms distance after registration using, respectively, a 3-D translation, 3-D rigid body, and 3-D affine transformation.
2) Right Coronary Tree
For the RCA, the selected EE and EI images spanned an average 85 ± 18% of the respiratory cycle, and the patient-averaged 3-D rms displacement of the coronary tree was ē3-D = 5.9±2.6 mm (range = 3.2–9.4 mm).
The residual 3-D rms error following optimal registration using a 3-D translation eT ≤ 1 mm in 1/4 patients. After optimal 3-D rigid body registration, eR ≤ 1 mm in 2/4 patients. With a 3-D affine registration, eA ≤ 1 mm in 4/4 patients.
Fig. 8 shows the residual registration errors from EI to EE for the different patients and motion models.
Fig. 8.

Residual errors of three motion models used to characterize the tidal respiratory motion of the RCA for four patients.e3-D is a baseline 3-D rms distance between the coronary tree at the respiratory extremes.eT, eR, and eA are the residual 3-D rms distance after registration using, respectively, a 3-D translation, 3-D rigid body, and 3-D affine transformation.
B. Cardiac Respiratory Parametric Modeling
The 3D + t deformation field for each dataset was parameterized using the CRPM. The decomposition algorithms were implemented in MATLAB. It took approximately 5 s to decompose each node of the B-solid on a Xeon 3 GHz computer running Linux. Decomposition of a B-solid of size 12 × 12 × 12 was completed in approximately 2–3 hours. Fig. 9 shows the CRPM fit to the B-solid control point data shown in Fig. 3.
Fig. 9.

The CRPM is applied to each B-solid control point independently. The results of the model fit (solid line) are shown with respect to the original data (dots) from Fig. 3.
1) Validation
Table I presents validation results for the CRPM. The results provide a measure of how well the CRPM can represent the coronary deformation that was recovered from the images. is computed for each image frame, and the mean and maximum values are reported for each patient. Except for one patient (P4), the mean plus one standard deviation of e3-D was submillimeter. Fig. 10 shows the validation results for one patient. is plotted as a function of image number, cardiac phase, and respiratory phase.
TABLE I.
RMS Error of the Cardiac Respiratory Parametric Model Describing the Deformation of the Tracked Arteries
| Patient | (mm) | ||
|---|---|---|---|
| Mean ± Std Dev | Maximum | ||
| Left | P1 | 0.37 ± 0.12 | 0.71 |
| P1 | 0.44 ± 0.14 | 0.89 | |
| P2 | 0.72 ± 0.24 | 1.29 | |
| P3 | 0.64 ± 0.23 | 1.59 | |
| P4 | 0.78 ± 0.27 | 1.52 | |
| P5 | 0.41 ± 0.22 | 1.14 | |
| P6 | 0.53 ± 0.18 | 1.05 | |
| P7 | 0.67 ± 0.28 | 1.94 | |
| P8 | 0.54 ± 0.25 | 1.48 | |
| P8 | 0.44 ± 0.16 | 0.92 | |
| P9 | 0.41 ± 0.14 | 0.93 | |
| P9 | 0.62 ± 0.24 | 1.68 | |
| Right | P5 | 0.76 ± 0.27 | 1.52 |
| P8 | 0.67 ± 0.33 | 1.67 | |
| P9 | 0.68 ± 0.27 | 1.43 | |
| P10 | 0.57 ± 0.18 | 1.28 | |
Fig. 10.

Validation results for the CRPM in Patient P9. The 3-D rms error, , is calculated between the coronary tree Υ recovered from the images, and the coronary tree [unk] generated by the parametric CRPM. e3-D as plotted as a function of (a) image number, (b) cardiac phase, and (c) respiratory phase. In this patient, a higher variability in rms error is coincident with the QRS complex (b) and with the tidal end-expiration and end-inspiration respiratory phases (c).
2) Respiratory Motion Parameters
Respiration-only deformation fields were synthesized for each dataset from the CRPM. These were created by sampling the CRPM at 100 respiratory phase on the interval [−1,1), while keeping the cardiac phase constant at diastasis. 3-D coronary trees Υρ were generated at each respiratory phase.
The coronary tree corresponding to EE, , was identified and used as the reference configuration. The other trees were registered to using a 3-D rigid body transformation to quantify the bulk respiratory motion of the heart. The translation and rotation parameters representing this motion are plotted in Fig. 11 for one patient.
Fig. 11.
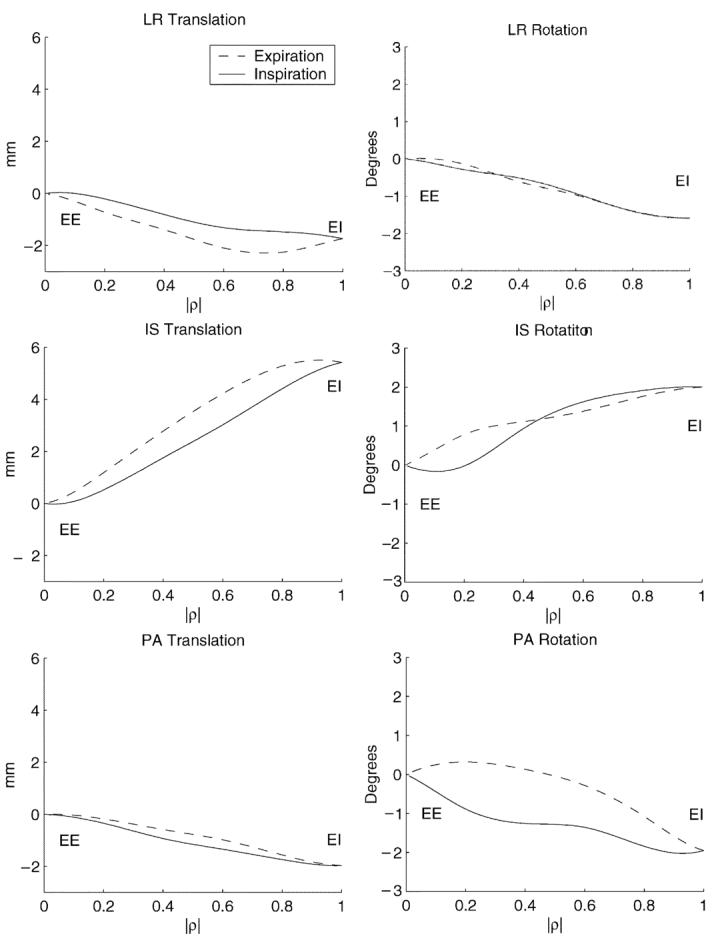
Rigid body motion parameters of the heart as a function of diaphragmatic displacement in patient P8.
Table II shows the rigid body motion parameters describing the motion of the heart from end expiration to end inspiration for each patient. In some patients, the coronary injection was repeated, so it is possible to analyze the variation between breaths. When multiple injections were available for a patient, an average motion for that patient was computed before performing inter-patient analysis to avoid undue weighting toward patients with multiple injections.
TABLE II.
Rigid Body Motion Parameters Describing the Natural Tidal Respiratory Motion of the Heart From End-Expiration to End-Inspiration at Diastasis
| Patient | Cor. Tree |
Rotation (°) | Translation (mm) | ||||
|---|---|---|---|---|---|---|---|
| LR | IS | PA | LR | IS | PA | ||
| P1 | L L |
−1.3 −0.5 |
−1.1 −0.2 |
1.3 0.8 |
−0.3 0.1 |
4.8 3.4 |
−1.5 −1.3 |
| P2 | L | −3.6 | −2.6 | 3.2 | 4.7 | 6.8 | 1.3 |
| P3 | L | −0.7 | −1.3 | 1.1 | 1.3 | 2.6 | −1.0 |
| P4 | L | −1.8 | −3.1 | 2.3 | 0.8 | 7.2 | 0.4 |
| P5 | L R |
−1.4 −1.9 |
−0.2 −2.7 |
2.1 2.3 |
0.7 2.2 |
4.4 5.2 |
0.0 −2.9 |
| P6 | L | −2.8 | −0.2 | 1.4 | 0.7 | 8.0 | −5.1 |
| P7 | L | −1.1 | −0.5 | 1.3 | −1.0 | 3.8 | −1.0 |
| P8 | L L R |
−1.0 −0.7 −1.6 |
1.0 1.4 2.0 |
−1.5 −1.4 −2.0 |
−4.0 −3.3 −1.8 |
3.0 3.6 5.4 |
−2.8 −2.4 −1.9 |
| P9 | L L R |
−1.3 −1.8 −0.2 |
0.7 0.3 2.4 |
0.9 2.1 1.0 |
−0.9 1.1 −2.0 |
3.5 4.5 8.1 |
−0.3 −0.4 −0.0 |
| P10 | R | −0.1 | 0.5 | 1.4 | −0.5 | 2.7 | −2.6 |
As expected, every patient's heart moved caudally on inspiration, with a mean IS translation of 4.9 ± 1.9 mm. Translation toward the patient's anterior was seen in 8/10 patients. The mean PA translation was −1.3 ± 1.8 mm. The mean of the LR translation was 0.4 ± 2.0 mm.
In addition, all patients had a cranio-dorsal rotation of the heart, with a mean LR rotation of −1.5°±0.9°. A caudo-dextral rotation from expiration to inspiration was seen in 8/10 patients. The mean PA rotation was 1.2° ± 1.3°. The mean of IS rotation was −0.7°±1.5°, with 7/10 patients showing a posterior-dextral rotation.
Intra-patient analysis in 4 patients, shows that the direction of motion is consistent for multiple injections within a patient. The only exception is the LR translation for patient P9.
IV. Discussion
This paper presents a method for modeling the cardiac and respiratory motions of the heart from coronary angiograms. The CRPM is used to model a 3D + t deformation field measured from biplane coronary angiograms, and to subsequently decompose the field into separate cardiac and respiratory components. The temporal resolution provided by the X-ray angiography system is 33 ms, and the method allows the respiratory motion to be measured over a single breath. Subsequent breaths could be studied independently with additional injections of dye. In contrast, 3-D free-breathing studies with MR imaging require that data is collected over multiple respiratory cycles [9].
The CRPM is fit to each control point of the B-solid deformation field independently. This approach maintains generality in that the cardiac-respiratory decomposition is not based on any global spatial motion model. For example, the decomposition does not immediately force the respiratory motion to be a rigid body transformation. Errors resulting from fitting the displacement at each control point are independent and should not bias the overall field toward a coherent and specific deformation mode. The CRPM decomposition generates separate cardiac and respiratory deformation fields that are themselves B-solids and can, therefore, maintain the level of spatial complexity found in the original deformation field. The ability of less complex motion models to describe the respiratory motion is tested subsequently.
The ability to represent a change in the shape of the coronary tree over a respiratory cycle is important because of evidence that the function and shape of the heart is modulated by breathing. A decrease in left ventricular (LV) stroke volume with an increase in LV end-systolic volume during spontaneous inspiration was shown in canines [22] and humans [23]. The inspiratory decrease in LV stroke volume, and a corresponding increase in right ventricular (RV) stroke volume was also shown in humans using MRI [24]. Respiration has also been shown to change the shape of the heart during diastole [25]. An increase in LV compliance was proposed as a mechanism for increased filling of the chamber during early inspiration [22]. An in situ canine experiment demonstrated increases in both end-diastolic and end-systolic volumes as a result of negative intrathoracic pressure [26].
This study used the motion of the diaphragm as a measure of the respiratory phase. The choice was made based on evidence that, compared with the use of a respiratory bellows signal, diaphragmatic displacement was more effective for respiratory motion suppression during MR imaging [27]. However, it is known that respiratory motion is affected by both the diaphragm and the chest wall. The high variability in errors along the ρ = 0 axis of Fig. 10(c) suggests that perhaps there is some motion near end-expiration which occurs while the diaphragm is static. This is a degenerate situation in that one respiratory phase cannot describe multiple geometric configurations. This would explain the spikes seen at ρ = 0 and |ρ| = 1. The combination of a respiratory bellows signal with diaphragmatic displacement as a measure of respiratory phase might improve the motion modeling by reducing degenerate conditions.
The results of this study indicate that a 3-D translation was able to model the motion of the coronaries (to within a 3-D rms error of 1 mm) in only one left coronary tree and one right coronary tree that were studied. For the left coronary tree, the most powerful motion model was the 3-D rigid body transformation, which was sufficient to explain the motion in five additional patients. The affine deformation only added one more patient to this group, leaving two patients whose motion could not be explained with a global motion model. For the RCA, the rigid body transformation was sufficient for one more patient, while the affine deformation was necessary for the two remaining studies.
The results of the rigid body analysis showed rotation angles of only a few degrees over the range of tidal breathing. However, a rotation of 1.5° through a moment arm of 5 cm can generate a displacement of 1.3 mm. The use of translation-only motion correction for MR imaging of the coronary vessels would be insufficient for applications requiring submillimeter resolution.
The measurements made in this paper represent the respiratory motion of the heart with the patient in the supine position. Different patient orientations would likely affect the respiratory motion of the heart, but the nature and patient safety considerations of the invasive angiography procedure do not allow for the study of these differences [28]. Nonetheless, since MR and CT imaging of the thorax is routinely performed with the patient in that position, knowledge from these measurements are suitable for application to motion correction techniques within these imaging domains.
V. Conclusion
A method for quantifying the 3-D respiratory motion of the heart from biplane coronary angiograms is presented and validated. An analysis of the natural tidal respiratory motion in 10 patients is presented. A 3-D translation motion model was sufficient for describing the motion of the heart (3-D rms error ≤ 1 mm) from end-expiration to end-inspiration in only two patients. During inspiration, the heart moved inferiorly and underwent a cranio-dorsal rotation for all patients studied. In eight patients, the heart also moved anteriorly and underwent a caudodextral rotation.
Acknowledgment
The authors would like to thank C. Blondel, L.F. Gutierrez, and C.J. Yeung for helpful discussions; S. Ventura for providing technical help with the Siemens angiography system; S. Chesnick for designing a pulse detector circuit; D.A. Kass for the use of his digital acquisition system; and the fellows and staff of the Cardiovascular Diagnostic Laboratory of the Johns Hopkins Hospital for helping to acquire patient data.
The work of G. Shechter was supported by the National Institutes of Health (NIH) under a Pre–IRTA Fellowship. The Associate Editor responsible for coordinating the review of this paper and recommending its publication was G.-Z. Yang. The Associate Editor responsible fo r coordinating the review of this paper and recommending its publication was G.-Z. Yang. Asterisk indicates corresponding author.
Contributor Information
Guy Shechter, The Laboratory of Cardiac Energetics, NHLBI, National Institutes of Health, DHHS, Bethesda, MD 20892 USA, and with Department of Biomedical Engineering, Johns Hopkins University, Baltimore, MD 21205 USA. (e-mail: guy@jhu.edu)..
Cengizhan Ozturk, The Cardiovascular Interventions, Vascular Biology Branch, NHLBI, National Institutes of Health, DHHS, Bethesda, MD 20892 USA..
Jon R. Resar, The School of Medicine, Johns Hopkins University, Baltimore, MD 21205 USA.
Elliot R. McVeigh, The Laboratory of Cardiac Energetics, NHLBI, National Institutes of Health, DHHS, Bethesda, MD 20892 USA, and with Department of Biomedical Engineering, Johns Hopkins University, Baltimore, MD 21205 USA.
References
- 1.Axel L, Summers R, Kressel H, Charles C. Respiratory effects in two-dimensional Fourier transform MR imaging. Radiology. 1986;160:795–801. doi: 10.1148/radiology.160.3.3737920. [DOI] [PubMed] [Google Scholar]
- 2.Holland A, Goldfarb J, Edelman R. Diaphragmatic and cardiac motion during suspended breathing: Preliminary experience and implications for breath-hold MR imaging. Radiology. 1998 Nov.209(2):483–489. doi: 10.1148/radiology.209.2.9807578. [DOI] [PubMed] [Google Scholar]
- 3.Dougherty J. The relation of respiratory changes in the horizontal QRS and T-wave axes to movement of the thoracic electrodes. J. Electrocardiol. 1970;3(1):77–86. doi: 10.1016/s0022-0736(70)80075-9. [DOI] [PubMed] [Google Scholar]
- 4.Dougherty J. Change in the frontal QRS axis with changes in the anatomic positions of the heart. J. Electrocardiol. 1970;3(3–4):299–308. doi: 10.1016/s0022-0736(70)80056-5. [DOI] [PubMed] [Google Scholar]
- 5.Bogren H, Lantz B, Miller R, Mason D. Effect of respiration on cardiac motion determined by cineangiography. Acta Radiologica Diagnosis. 1977 Nov.18:609–620. doi: 10.1177/028418517701800601. [DOI] [PubMed] [Google Scholar]
- 6.Wang Y, Riederer S, Ehman R. Respiratory motion of the heart: Kinematics and the implications for the spatial resolution in coronary imaging. Magn. Reson. Med. 1995 May;33(5):713–719. doi: 10.1002/mrm.1910330517. [DOI] [PubMed] [Google Scholar]
- 7.Danias P, Stuber M, Botnar R, Kissinger K, Edelman R, Manning W. Relationship between motion of coronary arteries and diaphragm during free breathing: Lessons from real-time MR imaging. AJR. 1999;172:1061–1065. doi: 10.2214/ajr.172.4.10587147. [DOI] [PubMed] [Google Scholar]
- 8.McLeish K, Hill D, Atkinson D, Blackall J, Razavi R. A study of the motion and deformation of the heart due to respiration. Proc. Int. Soc. Mag. Reson. Med. 2002;10 doi: 10.1109/TMI.2002.804427. CD-ROM. [DOI] [PubMed] [Google Scholar]
- 9.Manke D, Nehrke K, Börnert P, Rösch P, Dössel O. Respiratory motion in coronary magnetic resonance angiography: A comparison of different motion models. J. Magn. Reson. Imag. 2002;15:661–671. doi: 10.1002/jmri.10112. [DOI] [PubMed] [Google Scholar]
- 10.Keegan J, Gatehouse P, Yang G-Z, Firmin D. Coronary artery motion with the respiratory cycle during breath-holding and free-breathing: Implications for slice-followed coronary artery imaging. Magn. Reson. Med. 2002;47:476–481. doi: 10.1002/mrm.10069. [DOI] [PubMed] [Google Scholar]
- 11.Shechter G, Devernay F, Coste-Manière E, Quyyumi A, McVeigh E. Three-dimensional motion tracking of coronary arteries in biplane cineangiograms. IEEE Trans. Med. Imag. 2003 Apr.22(4):493–503. doi: 10.1109/TMI.2003.809090. [DOI] [PMC free article] [PubMed] [Google Scholar]
- 12.Shechter G, Devernay F, Coste-Manière E, McVeigh E. Temporal tracking of 3D coronary arteries in projection angiograms. Proc. SPIE Med. Imag. 2002 May;4684:612–623. [Google Scholar]
- 13.Weissler A, Harris W, Schoenfeld C. Systolic time intervals in heart failure in man. Circulation. 1968;37:149–159. doi: 10.1161/01.cir.37.2.149. [DOI] [PubMed] [Google Scholar]
- 14.Bohning D, Carter B, Liu S, Pohost G. PC-based system for retrospective cardiac and respiratory gating of NMR data. Magn. Reson. Med. 1990;16:303–316. doi: 10.1002/mrm.1910160211. [DOI] [PubMed] [Google Scholar]
- 15.Nehrke K, Börnert P, Manke D, Böck J. Free-breathing cardiac MR imaging: Study of implications of respiratory motion – Initial results. Radiology. 2001;220:810–815. doi: 10.1148/radiol.2203010132. [DOI] [PubMed] [Google Scholar]
- 16.Frangi A, Niessen W, Hoogeveen R, van Walsum T, Viergever M. Model-based quantitation of 3-D magnetic resonance angiographic images. IEEE Trans. Med. Imag. 1999 Oct.18:946–956. doi: 10.1109/42.811279. [DOI] [PubMed] [Google Scholar]
- 17.Mourgues F, Devernay F, Malandain G, Coste-Manière E. 3D+t modeling of coronary artery tree from standard non simultaneous angiograms. Proc. MICCAI. 2001 Oct.2208:1320–1322. [Google Scholar]
- 18.Piegl L, Tiller W. The NURBS Book. 2nd ed. Springer-Verlag; Berlin, Germany: 1997. [Google Scholar]
- 19.Declerck J, Denney T, Ozturk C, O'Dell W, McVeigh E. Left ventricular motion reconstruction from planar tagged MR images: A comparison. Phys. Med. Biol. 2000;45:1611–1632. doi: 10.1088/0031-9155/45/6/315. [DOI] [PMC free article] [PubMed] [Google Scholar]
- 20.Denney T, Prince J. Reconstruction of 3-D left ventricular motion from planar tagged cardiac MR images: An estimation theoretic approach. IEEE Trans. Med. Imag. 1995 Dec.14:625–635. doi: 10.1109/42.476104. [DOI] [PubMed] [Google Scholar]
- 21.Patel S, Oshinski J, Leimbach M, Sharma P, Pettigrew R. Three-dimensional analysis of coronary motion in CAD patients: Implications for MR coronary angiography. Proc. Int. Soc. Mag. Reson. Med. 2002 May;10:1597. [Google Scholar]
- 22.Summer W, Permutt S, Sagawa K, Shoukas A, Bromberger-Barnea B. Effects of spontaneous respiration on canine left ventricular function. Circ. Res. 1979;45:719–728. doi: 10.1161/01.res.45.6.719. [DOI] [PubMed] [Google Scholar]
- 23.Karam M, Wise R, Natarajan T, Permutt S, Wagner H. Mechanism of decreased left ventricular stroke volume during inspiration in man. Circulation. 1984;69(5):866–873. doi: 10.1161/01.cir.69.5.866. [DOI] [PubMed] [Google Scholar]
- 24.Thompson R, Ennis D, Derbyshire J, Arai A, McVeigh E. Respiratory resolved cine phase contrast MRI: Measurement of right and left heart cardiac output during inspiration and expiration. Proc. Int. Soc. Mag. Reson. Med. 2002;10 CD-ROM. [Google Scholar]
- 25.Scharf S, Brown R, Saunders N, Green L. Effects of normal and loaded spontaneous inspiration on cardiovascular function. J. Appl. Physiol. 1979 Sept.47(3):582–590. doi: 10.1152/jappl.1979.47.3.582. [DOI] [PubMed] [Google Scholar]
- 26.Hausknecht M, Brin K, Weisfeldt M, Permutt S, Yin F. Effects of left ventricular loading by negative intrathoracic pressure in dogs. Circ. Res. 1988 Mar.62(3):620–631. doi: 10.1161/01.res.62.3.620. [DOI] [PubMed] [Google Scholar]
- 27.McConnell M, Khasgiwala V, Savord B, Chen M, Chuang M, Edelman R, Manning W. Prospective adaptive navigator correction for breathhold MR coronary angiography. Magn. Reson. Med. 1997;37:148–152. doi: 10.1002/mrm.1910370121. [DOI] [PubMed] [Google Scholar]
- 28.Vellody V, Nassery M, Druz W, Sharp J. Effects of body position change on thoracoabdominal motion. J. Appl. Physiol. 1978 Oct.45(4):581–589. doi: 10.1152/jappl.1978.45.4.581. [DOI] [PubMed] [Google Scholar]