Abstract
Na+/H+ exchanger 3 (NHE3) provides a major route for intestinal Na+ absorption. NHE3 has been considered a target of proinflammatory cytokines and enteropathogenic bacteria, and impaired NHE3 expression and/or activity may be responsible for inflammation-associated diarrhea. However, the possibility of loss of NHE3 function reciprocally affecting gut immune homeostasis has not been investigated. In this report, we describe that NHE3-deficient mice spontaneously develop colitis restricted to distal colonic mucosa. NHE3−/− mice housed in a conventional facility exhibited phenotypic features such as mild diarrhea, occasional rectal prolapse, and reduced body weight. Genomewide microarray analysis identified not only a large group of transport genes that potentially represent an adaptive response, but also a considerable number of genes consistent with an inflammatory response. Histological examination demonstrated changes in the distal colon consistent with active inflammation, including crypt hyperplasia with an increased number of 5-bromo-2′-deoxyuridine-positive cells, diffuse neutrophilic infiltrate with concomitant 15-fold increase in matrix metalloproteinase 8 expression, an increased number of pSer276-RelA-positive cells, and a significant decrease in periodic acid-Schiff-positive goblet cells. Real-time PCR demonstrated elevated expression of inducible nitric oxide synthase (38-fold), TNF-α (6-fold), macrophage inflammatory protein-2 (48-fold), and IL-18 (3-fold) in the distal colon of NHE3−/− mice. NHE3−/− mice showed enhanced bacterial adhesion and translocation in the distal colon. Colitis was ameliorated by oral administration of broad-spectrum antibiotics. In conclusion, NHE3 deficiency leads to an exacerbated innate immune response, an observation suggesting a potentially novel role of NHE3 as a modifier gene, which when downregulated during infectious or chronic colitis may modulate the extent and severity of colonic inflammation.
Keywords: colon, knockout, microarray, Slc9a3
diarrhea is one of the major hallmarks of numerous gastrointestinal disorders including infections, graft-vs.-host disease, celiac sprue, and food allergy. It is also commonly associated with inflammatory bowel diseases (IBDs), occurring in ∼50% of acute flare-ups of Crohn's disease (CD) and in virtually all patients with ulcerative colitis (UC) (40). Chronic watery diarrhea represents a primary symptom in patients with microscopic colitis (32). A number of early studies demonstrated severely diminished or reversed Na+ absorption in the colonic mucosa of CD and UC patients (1, 15), a phenomenon that could be restored by steroid administration (37). More recent studies determined that a combination of epithelial barrier dysfunction and altered electrolyte movement (increased Cl− efflux and/or decreased electrogenic and electroneutral Na+ absorption) can be attributed to the changes in net water flux during inflammation-associated diarrhea. In a T cell-mediated acute model of CD3 antibody-induced diarrhea, a general defect in sodium absorption has been described including impaired Na+/H+ exchange, Na+/glucose cotransport, and Na+/K+-ATPase activities (10, 29).
Electroneutral Na+/H+ exchange, mediated primarily by NHE3, plays a critical role in the intestinal sodium and water absorption and regulation of intracellular pH as well as acidity of the apical microenvironment. NHE3-deficient mice exhibit mild chronic diarrhea, distention, retention of alkaline fluid in all intestinal segments, mild metabolic acidosis, and lower blood pressure (39). Moreover, NHE3 has been established as a target of inhibition by the two major proinflammatory cytokines associated with intestinal inflammation, TNF-α and IFN-γ (4, 36), whereas anti-inflammatory agents such as glucocorticoids (20, 44) or butyrate (21) significantly stimulate NHE3 expression and/or activity. Moreover, butyrate effectively restores IFN-γ-and TNF-α-mediated transcriptional inhibition of NHE3 (3).
Inflammation-associated changes in electroneutral Na+ absorption cannot always be attributed to decreases in NHE3 mRNA expression and may also result from inhibition of the transporter activity or its endocytic retrieval from the apical membrane of the enterocyte. Indeed, in spontaneous models of colitis of IL-2- or IL-10-deficient mice, NHE3 activity is severely depressed with relatively minor or no changes in NHE3 gene expression (7, 40). Coordinated loss of NHE3 activity due to its PKC-dependent internalization and MLCK-dependent intestinal barrier dysfunction were recently found to be a critical mechanism of TNF-α-induced diarrhea in experimental mice (10).
Inhibition of NHE3 expression and/or activity has also been observed in response to pathogenic microbiota or their products. Clostridium difficile toxin B severely depresses sodium/proton exchange across the apical membrane of renal epithelial cells primarily because of internalization of NHE3 (16). Also, enteropathogenic Escherichia coli strains cause significant inhibition of NHE3 activity, an effect dependent on the type III secretion system (17).
All the existing evidence points to a crucial role of NHE3 in the basal and meal-stimulated intestinal Na+ and water absorption, as well as to a critical contribution of NHE3 inhibition in the pathogenesis of inflammation-associated or infectious diarrhea. The reciprocal relationship, i.e., the effect of loss of NHE3 function and chronic sodium diarrhea on small intestinal homeostasis, was investigated via microarray analysis by Woo et al. (43), who described a significant increase in expression of IFN-γ and IFN-γ-inducible genes, including inducible nitric oxide synthase (iNOS). Serum levels of IFN-γ were similarly elevated fivefold, without a concomitant increase in TNF-α, IL-2, IL-4, or IL-6 concentrations. Since no inflammatory changes were noted in the small intestine of NHE3-deficient mice, and no apparent differences were observed in the cytokine production in response to systemically administered LPS, the authors concluded that an increase in small intestinal production of IFN-γ likely represents an adaptive response, which through inhibition of active Cl− secretion could modulate the extent of net water flux (43). Although the colon was not the focus of this investigation, the report indicated elevated expression of IL-1β in the large intestine of NHE3−/− mice, a cytokine that not only is prosecretory but is commonly elevated in colitis. Incidentally, the initial report of the effects of Slc9a3 gene targeting indicated significantly increased epithelial thickness in the distal but not the proximal colon of NHE3−/− mice (39). Again, although this could be considered a compensatory increase in absorptive area, crypt hyperplasia is also a typical hallmark of colitis.
Considering these factors, the known detrimental effects of IFN-γ on colonic barrier function (albeit in this case not produced locally but rather affecting colon through systemic circulation), and because of lack of systematic insight into the role of NHE3 in colonic mucosal homeostasis, we aimed at investigating the effects of the loss of NHE3 expression in Slc9a3-null knockout mice on colonic gene expression. Using a comprehensive and quantitative approach of genomewide microarray analysis (Affymetrix MOE420 2.0), we identified a significant group of genes indicative of active inflammation. Histological and immunohistochemical analyses demonstrated inflammatory changes restricted to the distal colon, including increased neutrophilic infiltration, loss of periodic acid-Schiff (PAS)-positive goblet cells, and increased numbers of 5-bromo-2′-deoxyuridine (BrdU)-positive cells. Moreover, we observed significant activation of NF-κB, a master regulator of proinflammatory responses. Microarray data as well as real-time RT-PCR analysis demonstrated upregulated expression of proinflammatory cytokines such as TNF-α, IL-18, as well as MIP-2 (mouse functional homologue of IL-8) and iNOS (NOS2) expression. Colonic inflammation could be alleviated by oral antibiotic treatment indicating bacterial involvement in the pathogenesis of colitis in NHE3−/− mice. Collectively, the presented observations point to a novel role of NHE3 in modulating inflammatory processes in the distal colon.
MATERIALS AND METHODS
Animals.
Slc9a3-deficient mice (NHE3−/−) were obtained as a kind gift from Dr. Gary E. Shull (39) and were bred on the original mixed (129/Black Swiss) genetic background and maintained in a conventional animal facility at the University of Arizona. Sentinel mice were routinely monitored and determined as free from common murine pathogens (MHV, MPV, MVM, TMEV, Mycoplasma pulmonis, Sendai, EDIM, MNV, ecto- and endoparasites). Breeders were maintained on Teklad Global 2019 (19% protein extruded) diet, and experimental mice after weaning were fed NIH-31 Modified Open Formula Mouse/Rat Diet (7013; both from Harlan Teklad, Madison, WI). Water and food were provided ad libitum. At weaning, mice were genotyped by use of specific primers as described previously (22). Briefly, PCR genotyping reactions of wild-type and knockout alleles of the Slc9a3 gene were done by using forward (CATCTCTATCACAAGTTGCCCACAATCGTG) and reverse (GTGACTGCATCGTTGAGCAGAGACTCG) primers corresponding to sequences from near the 5′ and 3′ ends of the sixth exon and a primer from near the 5′ end of the neomycin resistance gene (GCATGCTCCAGACTGCCTTG) to amplify 199- and 113-bp products from the wild-type and knockout allele, respectively. In a separate series of experiments, wild-type and NHE3−/− mice were treated for 10 days with antibiotics in drinking water (ciprofloxacin, 200 mg/l; metronidazole, 500 mg/l). Considering average water consumption at 7 ml/30 g body wt per day (6), the approximate doses were 46.6 and 116 mg·kg−1·day−1 of ciprofloxacin and metronidazole, respectively. All animal protocols and procedures were approved by the University of Arizona Animal Care and Use Committee.
Tissue collection.
Mice at 6–8 wk old were taken for experiments and euthanized by CO2 inhalation followed by cervical dislocation. Colons were then dissected and flushed with PBS. Tissues for histological studies were immediately fixed in 10% buffered formalin (Fisher Scientific, Pittsburgh, PA), dehydrated with increasing concentrations of ethanol and xylene, and embedded in paraffin. Samples were cut into 5-μm-thick sections. Caudal mesenteric lymph nodes were also harvested and, along with colonic tissue, were frozen in liquid nitrogen and then stored at −80°C until their use for subsequent RNA extraction and gene expression analyses or for ELISA assays.
Microarray analysis of colonic gene expression.
Colonic tissues (mucosal scrapings from the entire colon except 2 cm of rectum) were obtained from 18 randomly selected mice: 9 wild-type and 9 NHE3−/− mice. Samples were pooled (three mice per sample) and RNA was purified with TRIzol reagent (Invitrogen, Carlsbad, CA) to yield three samples per genotype. RNA was cleaned up with RNeasy Mini Kit (Qiagen) according to the manufacturer's protocol. RNA integrity was evaluated with Agilent 2100 BioAnalyzer microfluidics-based platform (Agilent, Foster City, CA). RNA samples were subsequently processed to yield biotinylated cRNA for hybridization to Affymetrix GeneChip Mouse Genome 430 2.0 arrays (Affymetrix, Santa Clara, CA) according to the manufacturer's recommendations (Affymetrix; Expression Analysis Technical Manual) utilizing reagents provided by Affymetrix (One-Cycle cDNA Synthesis kit, Sample Cleanup Module, IVT labeling kit). The GeneChip Mouse Genome 430 2.0 array is a single array comprised of over 45,000 probe sets representing over 34,000 well-substantiated mouse genes. Fragmented cRNA was mixed with control oligonucleotide B2 (Affymetrix), eukaryotic hybridization controls (Affymetrix), herring sperm DNA (Invitrogen), bovine serum albumin (Invitrogen), 2× hybridization buffer, and RNase-free water. This hybridization cocktail was then applied to Mouse Genome 430 2.0 arrays and hybridized at 45°C for 16 h while spinning at 53 rpm. Chips were immediately washed and stained with the GeneChip Fluidics Station 400 (Affymetrix). SAPE (streptavidin-phycoerythrin) and antibody solutions were prepared according to the manufacturer's recommendations (Affymetrix), and chips were washed and stained by utilizing the Midi_euk2v3 fluidics script. After the chips had been washed and stained, they were scanned with the GeneChip Scanner 3000 (Affymetrix). Obtained data were subsequently exported for analysis to GeneSpring v.7.3.1 (Agilent). Stringent empirical and statistical analyses were employed to compare gene expression profiles between wild-type and NHE3−/− mice with cross-gene error model based on replicates. Normalized data (per gene, per chip, and per sample with healthy controls serving as a reference point) were serially filtered in the following order: eliminate genes flagged as absent in all groups, select genes up- or downregulated at least twofold with P < 0.05 (wild-type vs. NHE3−/− mice, Student t-test with Benjamini and Hochberg false discovery rate as multiple testing correction).
Real-time RT-PCR.
Expression of selected genes based on the outcome of microarray analysis was independently analyzed by real-time RT-PCR. Total RNA (200 ng) isolated from the distal colon by use of the RNeasy Mini Kit (Qiagen, CA) was reverse-transcribed by use of the iScript kit (Bio-Rad, Hercules, CA), and 10% of the RT reaction was used for real-time PCR analysis using TaqMan technology and commercially available primers (Table 1) from Applied Biosystems (Foster City, CA), iQSupermix (Bio-Rad), and the iCycler optical PCR cycler (Bio-Rad). Resulting data were analyzed by the comparative cycle threshold (Ct) method as means of relative quantitation of gene expression, normalized to an endogenous reference (TATA-box binding protein, TBP) and relative to a calibrator (normalized Ct value obtained from control mice) and expressed as 2−ΔΔCt (Applied Biosystems User Bulletin no. 2: Rev B “Relative Quantitation of Gene Expression”).
Table 1.
TaqMan gene expression assays used in real-time RT-PCR
| Gene | Description | Primer Set Reference |
|---|---|---|
| Mmp8 | matrix metallopeptidase 8 | Mm00772335_m1 |
| Muc2 | mucin 2 | Mm00458299_m1 |
| TNF-α | tumor necrosis factor | Mm00443258_m1 |
| MIP2 (Cxcl2) | chemokine (C-X-C motif) ligand 2 | Mm00436450_m1 |
| IFN-γ | interferon gamma | Mm00801778_m1 |
| IL-1β | interleukin 1 beta | Mm00434228_m1 |
| IL-23α-p19 | interleukin 23, alpha subunit p19 | Mm00518984_m1 |
| IL-18 | interleukin 18 | Mm00434225_m1 |
| IL-10 | interleukin 10 | Mm00439616_m1 |
| IL-6 | interleukin 6 | Mm00446190_m1 |
| IL-4 | interleukin 4 | Mm00445259_m1 |
| NOS2 | nitric oxide synthase 2, inducible | Mm00440485_m1 |
| TBP | TATA box binding protein | Mm00446973_m1 |
Histological evaluation and immunohistochemistry staining.
Sections of the proximal and/or distal colon were deparaffinized and rehydrated. For histological assessment, standard hematoxylin and eosin (H&E) staining was performed. For enumeration of the goblet cells, slides were stained with periodic-acid Schiff's reagent (PAS; Electron Microscopy Sciences, Hatfield, PA) specific for mucin and glycoproteins. To identify infiltrating neutrophils by immunohistochemistry, rat anti-mouse MCA771GA antibody recognizing a polymorphic 40-kDa antigen expressed by polymorphonuclear cells, but absent on resident tissue macrophages, was used (AbD Serotec, Oxford, UK). Rabbit anti-mouse phospho-NF-κB p65 antibody (pSer276-RelA, Cell Signaling Technology, Danvers, MA) was used to stain cells with activated NF-κB transcription factor. Slides were examined independently in a blinded manner by two experienced scientists using Zeiss Axioplan microscope (Carl Zeiss MicroImaging, Thornwood, NY). Images were captured with Nikon Digital Sight DS-Fi1 camera and NIS-Element software (Nikon Instruments, Melville, NY) for documentation and presentation. NF-κB-positive cells were counted and expressed as number positive stained cells per one field of vision (magnification ×200).
Cell proliferation assay (BrdU incorporation).
NHE3−/− mice or their wild-type littermates were injected intraperitoneally with 5-bromo-2′-deoxyuridine (BrdU; 50 mg/kg body wt) 60 min before tissue collection. Detection of BrdU-positive cells in formaldehyde-fixed and paraffin embedded colonic tissue was then performed with a BrdU staining kit (Zymed-Invitrogen, Carlsbad, CA) according manufacturer's protocol. Images were captured and analyzed as described above.
ELISA analyses.
Collected tissues from the distal colon of control and NHE3−/− mice were homogenized in RIPA buffer and clarified by centrifugation. Supernatants were used to measure IL-18 and MIP-2 concentrations by using commercially available ELISA assays (MBL International, Woburn, MA, and R&D Systems, Minneapolis, MN, respectively). Assays were performed according to the manufacturer's instructions. Optical densities were measured on a VERSAMax microplate reader (Molecular Devices, Sunnyvale, CA) at a wavelength of 450 nm. Results were expressed as picograms per milligram protein.
Fluorescence in situ hybridization for adherent bacteria.
Colonic tissue fragments were embedded in OCT (Sakura Finetek, Torrance, CA) and snap frozen in liquid nitrogen. Sections (5 μm) were cut, transferred onto electrostatically charged microscope slides (Superfrost Plus, Menzel, Braunschweig, Germany), and dried at room temperature in a dust-free chamber. Cy-3-conjugated DNA probes were used: EUB-338 probe specific for bacterial 16S ribosomal RNA (5′-GCTGCCTCCCGTAGGAGT-3′) (2) and a negative control, the NON338 probe (5′-ACTCCTACGGGAGGCAGC-3′) (41). Slides were incubated in a humidified chamber overnight at 37°C with 50 pmol of the labeled probe diluted in the hybridization buffer [20 mM Tris·HCl (pH = 8), 0.9 M NaCl, 0.01% SDS, 30% formamide], then mounted onto the tissue with a plastic coverslip. After incubation, the slides were washed twice in wash buffer (1× SSC, 0.15 m NaCl, 0.015 M sodium citrate). Slides were then counterstained with Sytox-Green (1 μM) according to the manufacturer's instruction (Invitrogen). Slide examination was performed independently in a blinded manner by two experienced scientists using a Bio-Rad MRC1024ES confocal microscope (Bio-Rad).
Tissue Gram staining and bacterial cultures.
To further visualize bacteria associated with the colonic epithelial surface and those translocating into the submucosa, tissue Gram staining was performed with a staining kit by Richard-Allan Scientific (Kalamazoo, MI), according to the manufacturer's instructions.
Culture of bacteria associated with colonic tissue.
The number of bacteria associated with colonic tissue was determined by serial dilution plating of tissue homogenates. Mice were euthanized by CO2 inhalation followed by cervical dislocation. The distal colon was dissected under sterile conditions and a small ring was washed twice by vigorous shaking in sterile brain-heart infusion (BHI) broth medium (EMD Chemicals). Tissues were then transferred to new sterile tubes, weighed, and homogenized in 1 ml of BHI broth medium. Serial tenfold dilutions were prepared and 0.1 ml of each dilution was cultured on BHI agar plates (Becton-Dickinson, San Jose, CA). Plates were incubated at 37°C for 24 or 48 h to quantify the aerobic and anaerobic microflora, respectively. Anaerobic cultures were incubated in AnaeroGen atmosphere generation system containers (Oxoid, Basingstoke, UK). After incubation colony counts were performed and results were expressed as colony forming units per milligrams of colon tissue.
Statistical analysis.
Unpaired Student's t-test or ANOVA followed by post hoc Fisher's protected least significant difference test were used for all comparisons, with P ≤ 0.05 considered significant. Data are expressed as means ± SD. Statistical analysis of microarray data was performed as described above.
RESULTS
Clinical symptoms.
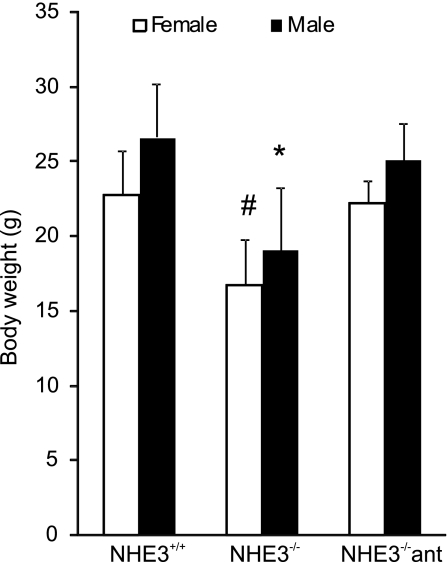
In accord with the original report of Slc9a3 gene targeting (39), NHE3−/− mice, housed in a conventional facility, exhibited phenotypic features including lower body weight, mild diarrhea, and intestinal distention with accumulation of alkaline fluid. Both male and female NHE3-deficient mice had reduced body weight (∼30%, Fig. 1) and dramatically decreased amounts of visceral/omental fat. The clinical symptoms varied considerably among the NHE3−/− mice, presumably because of the uncontrolled allele segregation in mice on a mixed genetic background. A relatively small subset of NHE3−/− mice displayed more severe symptoms such as rectal prolapse, rectal bleeding, rough coat, and lethargy.
Fig. 1.
Difference in body weight between age-matched and sex-matched wild-type (n = 35), NHE3−/− mice (n = 31), and NHE3−/− mice treated with antibiotics (ant; 200 mg/l ciprofloxacin and 500 mg/l metronidazole) for 10 days (n = 22). Bars represent means ± SD. Statistical analysis was performed with ANOVA followed by Fisher protected least significant difference (PLSD) post hoc test. *Statistically significant (P < 0.0001) difference among the males, #statistically significant (P < 0.0001) difference among the females.
Changes in colonic gene expression in NHE3−/− mice.
Woo et al. (43) have previously investigated changes in gene expression in the small intestine of NHE3-deficient mice and reported elevated expression of IFN-γ and IFN-γ-inducible genes without histological evidence of inflammation. Although NHE3 is abundantly expressed in the colonic surface epithelium, the molecular consequences of Slc9a3 gene ablation in the large intestine have not been systematically investigated to date. We utilized Affymetrix MOE430 2.0 microarray offering genomewide coverage, with RNA obtained from colonic mucosa obtained from wild-type and NHE3−/− mice. Data were obtained from three biological replicates per genotype with each sample obtained from RNA pooled from three randomly selected mice and were analyzed via GeneSpring GX 7.3.1 software (Agilent) as described above.
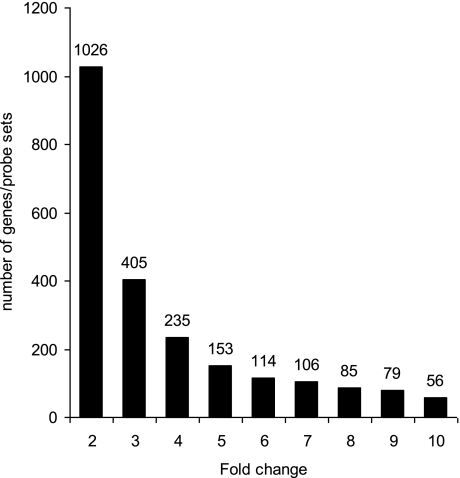
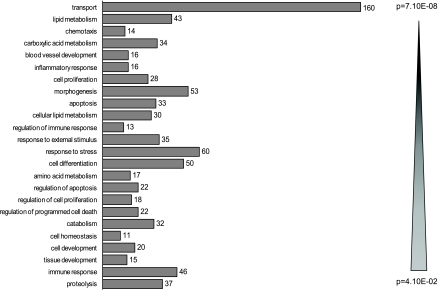
We observed profound differences in gene expression profiles of wild-type and NHE3-deficient mice with 1,026 genes/probe sets indicating greater than or equal to twofold change (up- or downregulated; P < 0.05), with the number of dysregulated genes decreasing with increasing stringency of analysis (Fig. 2). More detailed results of the analyses, including raw and normalized expression values, can be viewed at the National Center for Biotechnology Information Gene Expression Omnibus microarray depository web site (http://www.ncbi.nlm.nih.gov/geo/; GEO accession no. GSE10740). The subset of 1,026 genes/probe sets (≥2-fold difference between genotypes; P < 0.05) was taken for further analysis with the Functional Annotation Tool and the Database Annotation, Visualization, and Integrated Discovery (DAVID; http://david.abcc.ncifcrf.gov) developed and maintained by the National Institute of Allergy and Infectious Diseases (12). The 1,026 genes were categorized based on their biological process and sorted according to the EASE (Expression Analysis Systematic Explorer) score, a modified Fisher exact P value, ranging from 4.1 × 10⁻² to 7.1 × 10⁻⁸ (Fig. 3).
Fig. 2.
Histogram depicting the number of genes/probe sets in which expression was increased or reduced at P < 0.05 in NHE3−/− mice relative to their wild-type littermates (Student's t-test with Benjamini and Hochberg false discovery rate as multiple testing correction). Increasing stringency of analysis (2- to 10-fold change on x-axis) demonstrates the magnitude of change in colonic gene expression profile in NHE3−/− mice.
Fig. 3.
Gene ontology analysis using DAVID Functional Annotation Tool (http://david.abcc.ncifcrf.gov/) of the 1,026 gene/probe sets, which indicated >2-fold change at P < 0.05 (Student t-test with Benjamini and Hochberg false discovery rate as multiple testing correction). Genes categorized based on biological process were grouped and ranked (threshold of 5, P < 0.05). Categories were sorted according to the EASE score, a modified Fisher exact P value.
As anticipated, a large subset (160) of the genes was classified as involved in cellular transport processes (Fig. 3). This subset of genes was further analyzed according to the molecular process and genes with ion transporter, ion channel, and water transporter activity are presented in Table 2. Among the genes involved in membrane transport, a significant group of upregulated genes represents Na+-dependent transporters including Slc6a19 (coding for a neutral amino-acid transporter), Slc6a4 (serotonin transporter), Slc20a1 and Slc24a2 (Pit1 and NaPi-IIb, phosphate transporters), Slc6a8 (creatinine transporter), and Slc28a2 and Slc28a3 (nucleoside transporters). Increased expression and activity of these transport proteins may in part counteract the loss of Na+ absorptive capacity due to loss of NHE3 and the major pathway for electroneutral Na+ absorption. A number of genes with ion channel activity were also upregulated, particularly β and γ subunits of the epithelial non-voltage-gated Na+ channel, which were induced 5.8- and 245-fold in NHE3−/− mice, respectively. Another adaptive response is likely represented by increased expression of Slc26a6 and Slc26a3 genes coding for anion exchangers (PAT-1 and DRA), which would presumably result in increased transepithelial net Cl− flux. Twofold upregulation of aquaporin 8, expressed at the subapical site of absorptive epithelial cells and corresponding downregulation of aquaporin 1, which is predominantly expressed on the endothelial cells of capillaries and small vessels, could also be considered a compensatory response regulating net water flux across the colonic epithelium.
Table 2.
Genes involved in cellular transport differentially expressed in the colon of wild-type and NHE3−/− mice
| Gene | Description | Fold Change | ||
|---|---|---|---|---|
| Ion transporter activity | ||||
| SLC6A19 | Solute carrier family 6 (neutral amino acid transporter), member 19 | 12.4 | ||
| ATP12A | Atpase, H+/K+ transporting, nongastric, alpha polypeptide | 11.4 | ||
| SLC2A4 | Solute carrier family 2 (facilitated glucose transporter), member 4 | 6.6 | ||
| SLC36A1 | Solute carrier family 36 (proton/amino acid symporter), member 1 | 4.53 | ||
| TFRC | Transferrin receptor (p90, CD71) | 4.05 | ||
| SLC11A2 | Solute carrier family 11 (proton-coupled divalent metal ion transporters), member 2 | 3.82 | ||
| SLC6A4 | Solute carrier family 6 (neurotransmitter transporter, serotonin), member 4 | 3.62 | ||
| SLC20A1 | Solute carrier family 20 (phosphate transporter), member 1 | 2.69 | ||
| ATP6V1E2 | Atpase, H+ transporting, lysosomal 31 kda, V1 subunit E2 | 2.69 | ||
| SLC6A8 | Solute carrier family 6 (neurotransmitter transporter, creatinine), member 8 | 2.64 | ||
| SLC28A2 | Solute carrier family 28 (sodium-coupled nucleoside transporter), member 2 | 2.54 | ||
| LOC381417 | Similar to solute carrier family 28 (sodium-coupled nucleoside transporter), member 2 | 2.52 | ||
| SLC26A6 | Solute carrier family 26, member 6 | 2.4 | ||
| SLC28A3 | Solute carrier family 28 (sodium-coupled nucleoside transporter), member 3 | 2.39 | ||
| COX7A1 | Cytochrome c oxidase subunit viia polypeptide 1 (muscle) | 2.28 | ||
| ATP1A1 | Atpase, Na+/K+ transporting, alpha 1 polypeptide | 2.19 | ||
| SLC26A3 | Solute carrier family 26, member 3 | 2.17 | ||
| OCA2 | Oculocutaneous albinism II | 2.15 | ||
| SLC34A2 | Solute carrier family 34 (sodium phosphate), member 2 | 2.05 | ||
| SLC30A1 | Solute carrier family 30 (zinc transporter), member 1 | 2.00 | ||
| SLC13A3 | Solute carrier family 13 (sodium-dependent dicarboxylate transporter), member 3 | 1.79 | ||
| ATP11A | Atpase, class VI, type 11A | 0.47 | ||
| SLC8A1 | Solute carrier family 8 (sodium/calcium exchanger), member 1 | 0.47 | ||
| SLC39A10 | Solute carrier family 39 (zinc transporter), member 10 | 0.46 | ||
| CMAH | Cytidine monophosphate-N-acetylneuraminic acid hydroxylase (CMP-N-acetylneuraminate monooxygenase) pseudogene | 0.43 | ||
| Ion channel activity | ||||
| SCNN1G | Sodium channel, nonvoltage-gated 1, gamma | 245.1 | ||
| FXYD4 | FXYD domain containing ion transport regulator 4 | 39.5 | ||
| CLCA6 | Chloride channel, calcium activated, family member 6 | 32.6 | ||
| SCNN1B | Sodium channel, nonvoltage-gated 1, beta | 5.84 | ||
| BEST2 | Bestrophin 2 | 4.43 | ||
| KCNB2 | Potassium voltage-gated channel, Shab-related subfamily, member 2 | 4.31 | ||
| TMEM37 | Transmembrane protein 37 | 3.77 | ||
| CLIC5 | Chloride intracellular channel 5 | 3.19 | ||
| TRPM6 | Transient receptor potential cation channel, subfamily M, member 6 | 2.99 | ||
| KCNMB4 | Potassium large conductance calcium-activated channel, subfamily M, beta member 4 | 2.63 | ||
| CLCA4 | Chloride channel, calcium activated, family member 4 | 2.09 | ||
| PLLP | Plasma membrane proteolipid (plasmolipin) | 2.08 | ||
| CLIC4 | Chloride intracellular channel 4 | 0.48 | ||
| KCNN4 | Potassium intermediate/small conductance calcium-activated channel, subfamily N, member 4 | 0.44 | ||
| KCTD14 | Potassium channel tetramerisation domain containing 14 | 0.43 | ||
| CLIC1 | Chloride intracellular channel 1 | 0.39 | ||
| Water transport activity | ||||
| AQP8 | Aquaporin 8 | 2.08 | ||
| AQP1 | Aquaporin 1 | 0.47 | ||
Genes were up- or downregulated ≥2-fold; n = 3 groups per genotype, each group comprised of 3 mice; P ≤ 0.05. Genes were selected based on their biological process (transport) and further assigned to functional subcategories according to their molecular function. Genes are sorted according to fold change within the subcategories.
Interestingly, two genes involved in Zn2+ absorption were reciprocally regulated in NHE3-deficient mice. Slc30a1 coding for the Znt1 protein that inhibits Zn2+ permeation through the L-type Ca2+ channel was induced twofold, whereas the Slc39a10 transcript, coding for Zip10 zinc carrier was inhibited by >50% (Table 2). These observation may indicate impaired Zn2+ absorption in the absence of NHE3. The relationship of the two transport processes or zinc status in NHE3−/− mice has not been investigated.
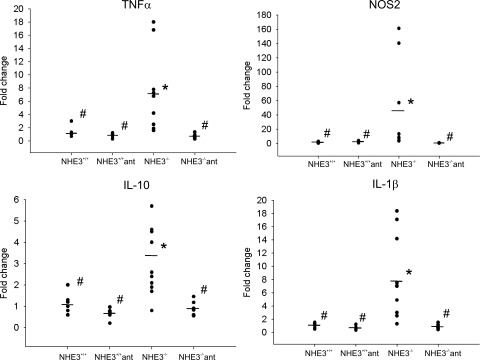
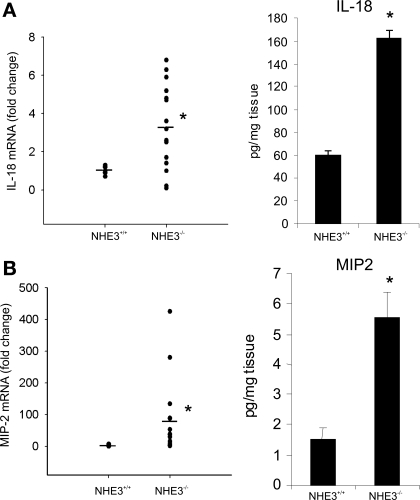
Perhaps the most intriguing observation was a relatively large number of dysregulated genes categorized as involved in response to stress, response to external stimulus, immune/inflammatory response, and chemotaxis, with genes partially overlapping within those categories. Forty-six well-annotated genes from these functional ontological categories are presented in Table 3 and include (but are not limited to) genes coding for acute phase proteins such as serum amyloids A1, A2, and A3; complement factors H, B, and C3; IL-1β; and MIP-2, as well as other chemokines/small cytokines from the CCL and CXCL classes (Table 3). The two genes with the highest induction in this functional category were DEFB1 coding for defensin β1 and NOS2 (iNOS), which were elevated in NHE3−/− mice by 37.5- and 19.6-fold, respectively. Genes with known involvement in the pathogenesis of experimental colitis and IBDs selected from Table 3, as well as selected genes that expression may have been too low to detect by hybridization-based microarray, were chosen to confirm the results with more accuracy and sensitivity by real-time RT-PCR. Figure 4 depicts the results of real-time RT-PCR analysis of TNF-α (6-fold increase), NOS2 (38-fold increase), IL-10 (3-fold increase), and IL-1β (7-fold). Colonic expression of IL-6 and IL-23p19 increased approximately twofold, although without reaching statistical significance (data not shown). The level of the IFN-γ transcript in the colon of NHE3−/− mice did not change, whereas IL-12/IL-23p40 remained undetectable in the colonic mucosa in both microarray and real-time RT-PCR analysis (data not shown). Both microarray and real-time RT-PCR analysis demonstrated a significant increase in expression of IL-18, a proinflammatory cytokine implicated in the pathogenesis of experimental colitis, IBD, and CD in particular (25, 30), where it plays a pivotal role in Th1 immune response and upregulates the expression of IL-1β and TNF-α. This increase was corroborated at the protein level by ELISA in colonic tissue extracts (Fig. 5A). Similarly, significantly elevated expression of MIP-2, a potent neutrophil chemoattractant, was demonstrated by microarray, real-time RT-PCR, and ELISA (Table 3, Fig. 5B).
Table 3.
Well-annotated genes involved in immune/inflammatory response differentially expressed in wild-type and NHE3−/− mice
| Gene Name | Description | Fold Change |
|---|---|---|
| DEFB1 | Defensin beta 1 | 37.50 |
| NOS2A* | Nitric oxide synthase 2, inducible, macrophage | 19.60 |
| CHF | Complement factor h | 10.08 |
| ADA | Adenosine deaminase | 9.16 |
| CXCL16 | Chemokine (C-X-C motif) ligand 1 (melanoma growth stimulating activity, alpha) | 5.66 |
| CXCL2 (MIP2)* | Chemokine (C-X-C motif) ligand 2 | 5.05 |
| SAA2 | Serum amyloid A 2 | 5.04 |
| SAA3 | Serum amyloid A 3 | 4.25 |
| IL1RN | Interleukin 1 receptor antagonist | 3.35 |
| POU2F2 | POU class 2 homeobox 2 | 3.31 |
| CD14 | CD14 molecule | 3.19 |
| C3 | Complement component 3 | 3.06 |
| LTIRB3 | Leukocyte immunoglobulin-like receptor, subfamily B (with TM and ITIM domains), member 3 | 3.05 |
| OLR1 | Oxidized low density lipoprotein (lectin-like) receptor 1 | 2.91 |
| CCL20 | Chemokine (C-C motif) ligand 20 | 2.85 |
| GZMA | Granzyme A (granzyme 1, cytotoxic T-lymphocyte-associated serine esterase 3) | 2.81 |
| TNFRSF1B | Tumor necrosis factor receptor superfamily, member 1b | 2.75 |
| MAF | Avian musculoaponeurotic fibrosarcoma (v-maf) AS42 oncogene homolog | 2.71 |
| OTUB1 | OTU domain, ubiquitin aldehyde binding 1 | 2.71 |
| INDO | Indoleamine-pyrrole 2,3 dioxygenase | 2.70 |
| FCER1G | Fc receptor, IgE, high affinity I, gamma polypeptide | 2.63 |
| CFB | Complement factor B | 2.62 |
| CCL8 | Chemokine (C-C motif) ligand 8 | 2.57 |
| PGLYRP1 | Peptidoglycan recognition protein 1 | 2.55 |
| IL1B* | Interleukin 1 beta | 2.30 |
| SAA1 | Serum amyloid A 1 | 2.30 |
| C3AR1 | Complement component 3a receptor 1 | 2.26 |
| FCER1A | Fc fragment of IgE, high affinity I, receptor for; alpha polypeptide | 2.26 |
| CCL28 | Chemokine (C-C motif) ligand 28 | 2.23 |
| IL2RA | Interleukin 2 receptor, alpha | 2.21 |
| CLEC2H | C-type lectin domain family 2, member h | 2.20 |
| SYK | Spleen tyrosine kinase | 2.19 |
| ICOSLG | Inducible T-cell co-stimulator ligand | 2.09 |
| CXCL16 | Chemokine (C-X-C motif) ligand 16 | 2.05 |
| CDKN1A | Cyclin-dependent kinase inhibitor 1A (p21, Cip1) | 2.02 |
| H2-T23 | Histocompatibility 2, T region locus 23 | 2.01 |
| IL18* | Interleukin 18 (interferon-gamma-inducing factor) | 2.01 |
| PAG1 | Phosphoprotein associated with glycosphingolipid microdomains 1 | 1.95 |
| CCL6 | Chemokine (C-C motif) ligand 6 | 0.47 |
| CCL9 | Chemokine (C-C motif) ligand 9 | 0.46 |
| DDX58 | DEAD (Asp-Glu-Ala-Asp) box polypeptide 58 | 0.44 |
| CD1d1 | CD1d1 antigen | 0.44 |
| THBS1 | Thrombospondin 1 | 0.40 |
| FABP4 | Fatty acid binding protein 4, adipocyte | 0.12 |
| PNLIPRP2 | Pancreatic lipase-related protein 2 | 0.12 |
| ANG4 | Angiogenin, ribonuclease A family, member 4 | 0.04 |
These 46 genes were up- or downregulated ≥2-fold; n = 3; P ≤ 0.05. Asterisks next to the gene symbol indicate genes selected and confirmed by real-time RT-PCR and/or ELISA analysis. Fold change was calculated relative to normalized gene expression in wild-type littermates.
Fig. 4.
Scattergraph of the results of real-time RT-PCR analysis of colonic expression of TNF-α, NOS2, IL-10, and IL-1β in wild-type (NHE3+/+) and NHE3−/− mice untreated or treated with a combination of antibiotics ciprofloxacin and metronidazole (200 and 500 mg/l, respectively, in drinking water). The results were analyzed with TATA box-binding protein as an internal control by the ΔΔCt method, with wild-type mice used as a calibrator. Statistical analysis was performed with ANOVA followed by Fisher PLSD post hoc test. *Statistically significant differences (P ≤ 0.05) between wild-type mice and the remaining groups; #statistically significant differences (P ≤ 0.05) between NHE3−/− mice and the remaining groups. Dots represent individual mice and horizontal dashes indicate the mean values for a respective genotype/treatment group.
Fig. 5.
Real-time RT-PCR and ELISA analysis of mRNA and protein expression of IL-18 (A) and MIP-2 (B). Statistical analysis was performed with unpaired Student's t-test. *Statistically significance (P ≤ 0.05) between groups. Dots represent individual mice; horizontal dashes represent mean values for respective analytes and genotypes. Bars represent the ELISA results (means ± SD).
Colonic histology.
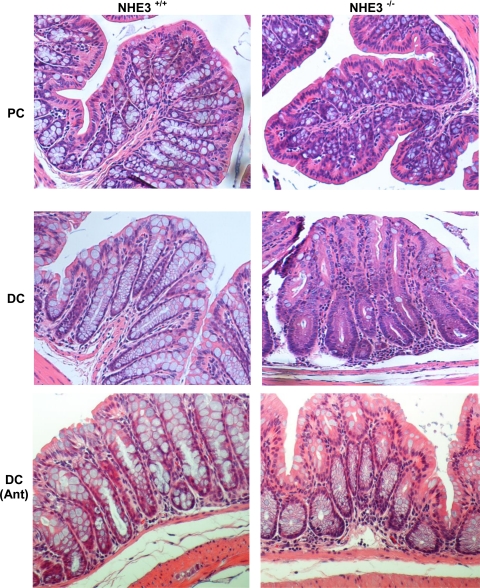
The gene expression profile of the colonic mucosa of NHE3-deficient mice was highly representative of stress and ongoing inflammation. Therefore, we investigated potential changes in colonic histology that could substantiate the observed changes in gene expression. Histological analysis of H&E-stained colonic specimens showed architectural alterations between control and knockout mice such as crypt hyperplasia, apparent loss of goblet cells, mild submucosal edematous changes, and diffuse, primarily granulocytic infiltrate (Fig. 6). These changes were observed exclusively in the distal colon, with the proximal segment essentially unaltered, with minimal or no changes in mucosal architecture.
Fig. 6.
Histological evaluation of colonic mucosal morphology in the proximal (PC) and distal colon (DC) of untreated and antibiotic-treated wild-type and NHE3−/−. Mice in the antibiotic-treated groups (Ant) received ciprofloxacin and metronidazole (200 and 500 mg/l, respectively, in drinking water). Representative hematoxylin-and-eosin-stained specimens demonstrate relatively mild but easily noticeable alterations in the mucosal architecture of the distal colon of NHE3-deficient mice, manifested primarily by apparent goblet cell depletion, granulocytic lamina propria cellular infiltration, and mild edematous changes. Treatment for 10 days with antibiotics ameliorated the histopathological changes observed in NHE3−/− mice.
PAS staining.
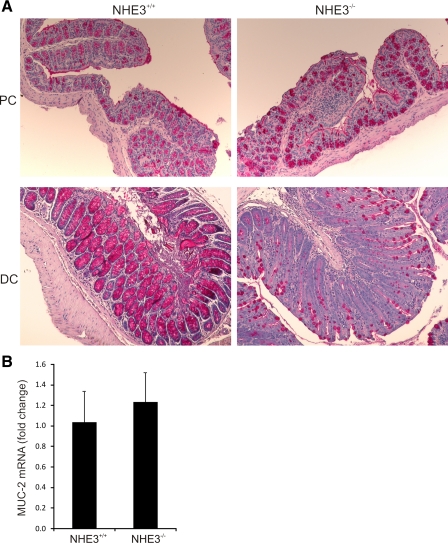
Apparent goblet cell depletion is one of the hallmarks of IBDs resulting from hypersecretion (13) or autoimmunity (5). To confirm the histological observations, we stained tissue sections taken from the proximal and distal colon of wild-type and NHE3−/− mice with the PAS technique. We did not observe any differences in PAS staining in the proximal colon (Fig. 7A). However, a dramatic reduction of PAS-positive goblet cells was observed in the distal colon (Fig. 7A). Real-time RT-PCR analysis of Muc2 mRNA expression, a major core intestinal mucin, demonstrated no difference between wild-type and NHE3−/− mice (Fig. 7B), thus suggesting that the apparent loss of PAS-positive goblet cells is driven by hypersecretion rather than changes in actual goblet cells number.
Fig. 7.
Depletion of mucus-containing goblet cells in the distal colon of NHE3−/− mice. Periodic-acid Schiff (PAS) staining of proximal and distal colon of wild-type and NHE3−/− mice showed a decreased number of PAS-positive cells restricted to the distal segment. Real-time RT-PCR analysis showed no changes in MUC2 gene expression, thus suggesting mucus depletion due to hypersecretion rather than lower goblet cell numbers in NHE3−/− mice.
Neutrophilic infiltration.
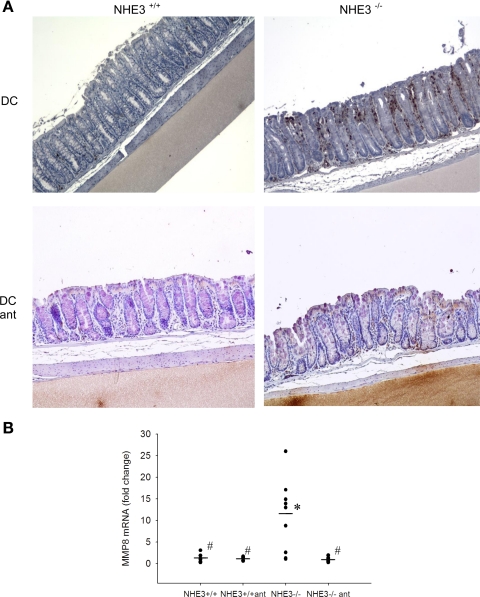
To further confirm our conclusions from the H&E-stained specimens, we performed immunohistochemical staining with the MCA771FA antibody specific to the 40-kDa antigen expressed by polymorphonuclear cells but absent on resident tissue macrophages. The colonic epithelium demonstrated significant neutrophilic infiltration in the distal colon of NHE3-deficient mice compared with their wild-type littermates (Fig. 8A). This observation was further confirmed by real-time RT-PCR with primers specific to matrix metalloproteinase 8 (MMP8), a neutrophil-specific collagenase. MMP8 mRNA expression in the distal colon of NHE3−/− mice was augmented 8.7-fold (P < 0.005) over the levels observed in wild-type mice (Fig. 8B), thus verifying histological and immunohistochemical evidence for granulocyte infiltration in a quantitative fashion.
Fig. 8.
Increased neutrophilic infiltration in the distal colon of NHE3−/− mice. A: neutrophil-specific immunohistochemistry staining with MCA771GA antibody recognizing a polymorphic 40-kDa antigen expressed by murine polymorphonuclear (PMN) cells (brown dots). Distal colon of untreated or antibiotic-treated wild-type (NHE3+/+) and NHE3-deficient mice was analyzed. B: quantitative assessment of PMN infiltration by real-time RT-PCR analysis of MMP8, a neutrophil collagenase, in the mucosa of untreated or antibiotic-treated wild-type and NHE3−/− mice. Statistical analysis was performed with ANOVA followed by Fisher PLSD post hoc test. *Statistically significant differences (P ≤ 0.05) between wild-type mice and the remaining groups; #statistically significant differences (P ≤ 0.05) between NHE3−/− mice and the remaining groups. Dots represent individual mice and dashes depict the mean values for respective genotypes.
Activation of NF-κB in the distal colon of NHE3−/− mice.
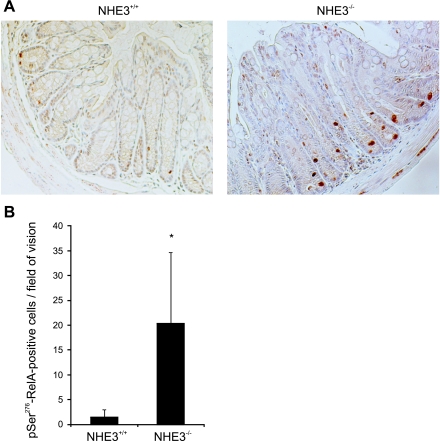
NF-κB has been known as a proinflammatory nuclear transcription factor and is considered to be the central mediator of the immune and inflammatory response, e.g., through regulation of expression proinflammatory cytokines (24) as well as through regulation of epithelial cell proliferation and modulation of the death pathway (19). Although the roles of NF-κB activation in the epithelial and immune cells in colonic homeostasis and during colitis appear to be divergent, its activation is considered a hallmark of inflammation in both IBDs and mouse models of colitis. Considering the crucial role of p65 (RelA) subunit in the NF-κB signaling pathway, we investigated RelA phosphorylation at Ser276 using immunohistochemistry. Significantly more pSer276-RelA-positive cells were observed in the distal colonic mucosa of NHE3−/− mice compared with wild-type control (Fig. 9A), with the average number of stained cells per field of vision nearly 10 times greater in NHE3 knockout mice (Fig. 9B).
Fig. 9.
NF-κB transcription factor is activated in the distal colon of NHE3-deficient mice. A: representative immunohistochemistry staining for pSer276-RelA. B: summary graph representing average number of pSer276-RelA-positive cells per field of vision. Bars represent average counts (±SD) obtained from 10 slides randomly selected from 10 mice. Statistical analysis was performed with unpaired Student's t-test. *Statistically significant differences (P = 0.028) between NHE3+/+ and NHE3−/−.
BrdU incorporation into colonic epithelial cells.
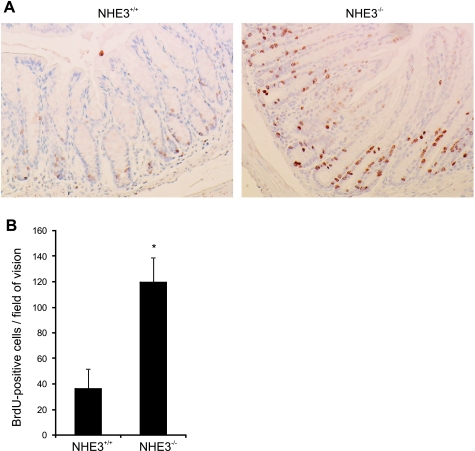
Colonic crypt elongation and increased cellular proliferation are additional features of an active and persistent inflammatory response. Although the proliferative zone of the colonic epithelium is usually limited to the bottom third of crypts, in the absence of NHE3, the proliferative zone was expanded, with proliferating cells identified in the midregions of crypts (Fig. 10A) with general increase in the number of BrdU-positive cells per field of vision (Fig. 10B).
Fig. 10.
Absence of NHE3 and ensuing inflammation promotes crypt proliferation. NHE3−/− mice or their wild-type littermates were injected intraperitoneally with 5-bromo-2′-deoxyuridine (BrdU; 50 mg/kg body wt) 60 min before tissue collection. A: representative BrdU immunostaining in the distal colon of wild-type and NHE3−/− mice. B: summary graph depicting the average numbers (±SD) of BrdU-positive cells per field of vision (n = 9). Statistical analysis was performed with unpaired Student's t-test. *Statistically significant differences (P < 0.001) between NHE3+/+ and NHE3−/−.
Bacterial association with distal colonic epithelium.
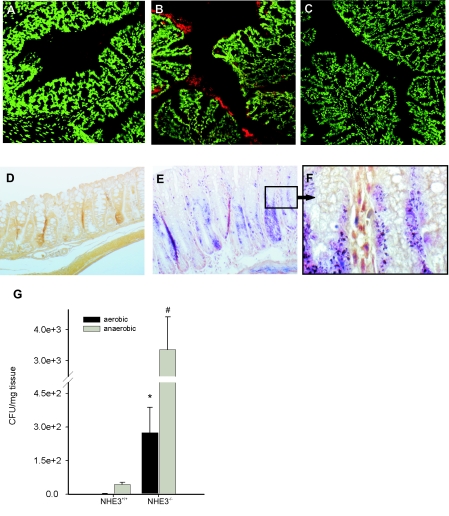
Because of the reduced active proton outflux, intestinal content in NHE3−/− is significantly more alkaline than in wild-type littermates (39). It has been documented that Na+ removal or amiloride inhibition elevates the pH of the cell surface in perfused rat jejunum (18), indicating that the apical Na+/H+ exchange is intimately involved in the maintenance of the acidic pH of the intestinal surface. The alkalinization of the normally acidic microclimate immediately adjacent to the brush-border surface layer may very likely aid bacterial adhesion and further facilitate microbial-epithelial interactions and translocation, thus contributing to the observed inflammatory changes. We therefore performed fluorescent in situ hybridization with frozen sections of the colonic tissues from wild-type and NHE3−/− mice and the ribosomal 16S Cy3-labeled pan-bacterial EUB338 probe to assess bacterial adhesion to the colonic epithelium. Consistent with our hypothesis, increased staining for bacterial 16S RNA was observed in the mucous layer of NHE3−/− mice (Fig. 11, A–C). Also, tissue Gram staining demonstrated significantly greater numbers of bacteria both associated with the colonic epithelial surface and translocating into the submucosa (Fig. 11, D–F). Serial dilution cultures of aerobic and anaerobic flora from distal colonic homogenates confirmed these morphological observations in a quantitative fashion (Fig. 11G).
Fig. 11.
Bacterial association with distal colonic mucosa. A–C: fluorescent in situ hybridization was performed with Cy3-labeled probe specific to 16S ribosomal RNA region highly conserved in the domain of Bacteria (Cy3-GCTGCCTCCCGTAGGAGT) from cryosections from NHE3+/+ (A) or NHE−/− mice (B) (depicted as red staining). C: negative control with NON338 probe (Cy3-ACTCCTACGGGAGGCAGC). Slides were counterstained with SytoxGreen (Molecular Probes), which at this concentration stains primarily mouse nuclei and not bacterial DNA. D–F: tissue Gram staining of paraffin sections of the distal colon obtained from wild-type (D) and NHE3−/− mice (E and F). D and E represent images taken at ×200 magnification. F represents an enlarged (×1,000) section from E (black frame). Slides were counterstained with tartrazine to provide yellow background. G: homogenized tissues from distal colon of wild-type (n = 4) and NHE3-deficient mice (n = 5) were plated and cultured in aerobic (solid bars) or anaerobic (shaded bars) conditions. Bars represent mean values of colony forming units (CFU) (± SE) calculated per mg of tissue. Statistical analysis was performed with unpaired Student's t-test. Statistically significant differences between NHE3+/+ and NHE3−/− mice for aerobic (*; P = 0.009) and anaerobic conditions (#; P = 0.03).
Antibiotic treatment results in resolution of distal colitis.
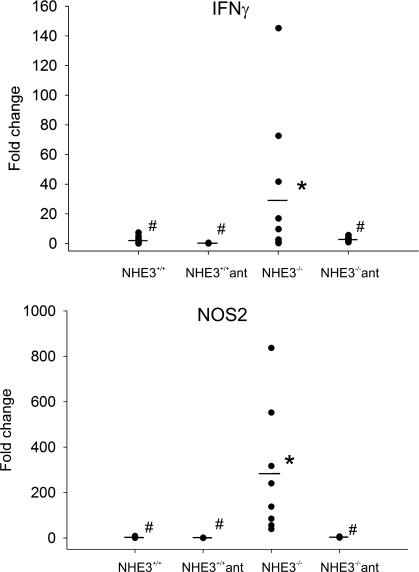
Since the observed distal colitis correlated with increased association of the commensal microflora with the colonic epithelium, we reasoned that oral administration of antibiotics should reduce or alleviate the symptoms. We administered the mice metronidazole and ciprofloxacin, two broad-spectrum antibiotics frequently used in the treatment of IBD patients, primarily with CD or pouchitis. The otherwise underweight NHE3-deficient mice quickly gained body weight and caught up with their wild-type littermates during the 10-day treatment regimen (Fig. 1). Colonic expression of TNF-α, NOS2, IL-1β, and IL-10 mRNA, elevated in untreated NHE3−/− mice, was reduced by the antibiotic administration to levels observed in the wild-type littermates (Fig. 4). Histological and immunohistochemical analysis also indicated that the two oral antibiotics alleviated the symptoms of colitis, with a noticeable improvement of the mucosal architecture (Fig. 6) and a decreased number of infiltrating neutrophils, as demonstrated by immunostaining and real-time RT-PCR for MMP8 (Fig. 8). Interestingly, antibiotic treatment also greatly reduced the elevated expression of IFN-γ and NOS2 (iNOS) in the small intestine of NHE3−/− mice (Fig. 12). Although we did not observe any changes in liquid accumulation and the distension of the small intestine or cecum, antibiotic-treated NHE3−/− mice had well-formed fecal pellets. These findings suggest that the reported increase in small intestinal expression of IFN-γ and iNOS (43) is bacterially mediated, although the small intestinal absorptive defect in NHE3−/− mice is likely primary and not related to the inflammatory response, and that the elimination of colitis with antibiotics may have improved the absorptive compensatory mechanism in the distal colon.
Fig. 12.
Effects of oral antibiotics on the small intestinal expression of IFN-γ and NOS2. Wild-type (NHE3+/+) and NHE3−/− mice were left untreated or administered ciprofloxacin and metronidazole (200 and 500 mg/l, respectively, in drinking water) for 10 days. Small intestinal mucosal scrapings were used to purify total RNA and real-time RT-PCR analysis of IFN-γ and NOS2 gene expression.
DISCUSSION
In an adult human, the average daily luminal load of water and sodium in the gastrointestinal tract amounts to ∼9 liters and 800 meq of Na+. Healthy gut is capable of absorbing more than 98% of this load, resulting in ∼200 g of daily stool output. Daily ileocecal flow is ∼2 liters of electrolyte-rich fluid, and the vast majority of this amount (1.5–1.9 liters) is absorbed in the colon. However, the maximal capacity of the human large intestine to absorb fluids may be as high as 5–6 l/day (11). Therefore, there is a large margin within which a healthy colon can compensate for increased ileocecal flow resulting in small intestinal absorptive defects. Exceeding the maximal capacity will result in diarrhea. On the other hand, in colonic disease, relatively small changes in water and electrolyte absorption will produce a significant increase in stool water output, emphasizing the relevance of fine tuning of the colonic transport processes.
The bulk of the colonic electrolyte absorption occurs via electroneutral NaCl transport and takes place in both the crypts and surface epithelium of the proximal and distal colon. This electroneutral absorption is mediated by coupled luminal Na+/H+ and Cl−/HCO3− exchange. On the basis of defective Na+ absorption in NHE3-deficient animals, NHE3 appears to be the major Na+ transporter in the mouse proximal colon (39), contributing ∼70% of basal net Na+ absorption (7). Although NHE3−/− mice exhibit severe distension and fluid accumulation in the small intestine and cecum, they develop only mild diarrhea, in most instances not easily appreciated, thus suggesting that significant compensatory mechanisms are induced in the descending colon. These mechanisms include increased absorptive surface through increased colonic length and epithelial thickness of the distal colon (39), as well as adaptive changes in expression of other key transport genes, colonic H+,K+-ATPase and the non-voltage-gated sodium channel (39). The comprehensive microarray analysis provided by the Affymetrix MOE430 2.0 chips demonstrated a profound and very broad spectrum of changes in the colonic gene expression profile of NHE3-deficient mice (Fig. 2). Not surprisingly, ontology analysis identified genes involved in transport processes as the most prominent functional group.
Among the identified transport genes, we confirmed a dramatic upregulation of the β and γ subunits of the non-voltage-gated sodium channel (SCNN1B, 5.8-fold; and SCNN1G, 245-fold) in addition to a number of other Na+-dependent solute transporters. Contrary to the renal epithelium (8), NHE3-deficient mice had 2.2-fold elevated expression of the α1 subunit of Na+/K+ ATPase in the colonic mucosa. Expression of a number of transporters participating in K+ uptake were also significantly affected, presumably in an effort to limit the loss of K+ secreted during electrogenic Na+ absorption. These include the α subunit of H+/K+ ATPase (ATP12A, 11.4-fold increase), K+ voltage-gated channel (KCNB2, 4.3-fold increase), and the large-conductance, calcium-activated potassium channel (KCNMB4, 2.6-fold increase). However, two other genes involved in K+ channel assembly, KCNN4 and KCTD14, were downregulated in the colonic mucosa of NHE3−/− mice by 56% and 57%, respectively. This decrease appears to be insufficient to mitigate K+ absorption since serum K+ concentration in NHE3−/− mice is nonetheless elevated (39).
To increase systemic NaCl retention, complementary mechanisms for absorbing Cl− are also necessary, especially since the chloride remaining in the lumen limits the amount of Na+, K+, and water that can be absorbed. Consistent with previously published observations (27), NHE3-deficient mice had 2.17-fold increased expression of Slc26a3 Cl−/HCO3− exchanger (DRA). Interestingly, another means of compensation may be provided by a 2.4-fold elevated expression of Slc26a6 (PAT1), a Cl−/HCO3− exchanger normally expressed in the colon at a relatively low level (42). In addition, increased expression of two poorly characterized calcium-activated chloride channels, CLCA6 (32.6-fold induction in NHE3−/− mice) and bestrophin 2 (4.4-fold increase), may provide additional and previously undescribed route for Cl− absorption in the absence of NHE3.
We also observed a significant, twofold upregulation of aquaporin 8 expression in the colon of NHE3−/− mice and a corresponding decrease in expression of aquaporin 1 (53% decrease). Their expression pattern (subapical site of absorptive epithelial cells and the endothelial cells of capillaries and small vessels, respectively) (26) suggests that these reciprocal response to the NHE3 could also be considered as a compensatory response regulating net water flux across the colonic epithelium.
The most striking observation from the microarray analysis of the colonic gene expression was, however, identification of a large group of genes related to the immune/inflammatory response whose expression was significantly elevated in NHE3-deficient mice (Table 3). These included acute phase reaction genes such as serum amyloid A1, A2, and A3; complement factor H, B, and C3; IL-1β; and other chemokines/small cytokines from CCL and CXCL classes, as well as NOS2. These gene expression changes correlated with relatively mild, but noticeable changes in mucosal architecture consistent with low-grade colitis. These changes were limited to the distal segment of the colon. Elevated expression of chemokines, including CXCL2 (MIP-2), a functional homologue of human IL-8, which expression was induced 48.5-fold by real-time PCR analysis, correlated with diffuse, but marked granulocytic infiltration as evidenced by H&E staining, immunohistochemistry, and colonic expression of MMP8 mRNA.
Elevated expression of IL-18, confirmed by real-time PCR and ELISA is also likely to be of pathogenic importance in NHE3−/− mice. IL-18 plays pleiotropic roles in the colonic inflammation (35) where it is produced primarily by epithelial cells, dendritic cells, and macrophages (28, 33). Although initially described as a Th1-polarizing cytokine capable of inducing IFN-γ production, IL-18 is able to mediate both Th1- and Th2-driven immune responses (31), serves to enhance neutrophil infiltration (9), induces neutrophil activation and degranulation (14), and stimulates the production of IL-8, TNF-α, and IL-1β (34). Strikingly, although expression of the latter three genes were elevated in the distal colon of NHE3−/−, elevated expression of IL-18 did not result in increased IFN-γ mRNA in the distal colon or caudal mesenteric lymph nodes (MLN; data not shown). This may be due to the lack of detectable expression of IL-12/23p40 in these tissues in NHE3-deficient mice, a factor known to potentiate the effects of IL-18 on IFN-γ production by effector T cells (23). In general, analysis of expression of cytokines characteristic for the Th1/Th17 or Th2 response in NHE3-deficient mice yielded somewhat inconclusive results. IL-23p19 expression was slightly elevated in the colon (without reaching statistical significance) and showed no change in the MLN (not shown), whereas expression of IL-4 mRNA in the caudal MLN showed 50% reduction (P = 0.01; data not shown).
Because of the elevated expression of IFN-γ, Woo et al. (43) examined the differences in anaerobic flora of the small intestine of wild-type and NHE3−/− mice and found no disparity in overall bacterial growth in the two genotypes, with the exception of increased numbers of cultured Bacteroides fragilis in NHE3 knockout mice. Colonic flora was not investigated in this report. Since NHE3 is the major antiporter contributing to the acidification of the luminal content and the apical microenvironment in the gut, the changes in the mucosal pH along with the potential influence of altered epithelial cell gene expression may be critical in facilitating microbial adhesion to the mucosal surfaces in NHE3−/− mice. Indeed, we found that microbial-epithelial interactions were enhanced in the distal colon of NHE3-deficient mice, as demonstrated by in situ hybridization, tissue Gram staining, and serial dilution cultures of both aerobic and anaerobic flora. Moreover, since the microbial component is a well-established contributor to the pathogenesis of IBD (38), we tested whether the effects of orally administered wide-spectrum antibiotics (metronidazole and ciprofloxacin) can reduce the colonic inflammation in NHE3−/− mice. We observed a dramatic improvement in terms of body weight gain, colonic histology, granulocytic infiltration, and cytokine expression profile, thus providing evidence that colonic microflora is the precipitating factor in the pathogenesis of colitis in the absence of NHE3.
Collectively, the data from morphological, immunohistochemical, and gene expression analyses indicate that NHE3-deficient mice develop an atypical colitis, not only restricted spatially to the distal colon, but also limited to a bacterially mediated exacerbated innate response without engagement of the adaptive immune system. The etiology of this phenomenon may be complex and may be secondary to the combined effects of the elevated systemic IFN-γ level, bacterial load in the descending colon, metabolic stress related to a compensatory response to the absence of NHE3 activity, and increased association of the microflora with the colonic mucosa. This novel finding may be of great importance to the pathogenesis of IBD or infectious colitis, in which the degree of inhibition of NHE3 expression and/or activity, combined with genetic predisposition of the host, may influence the degree and extent of inflammation and/or mucosal restitution.
GRANTS
This work was supported by National Institute of Diabetes and Digestive and Kidney Diseases Grant 2R01 DK-041274 (to F. K. Ghishan).
The costs of publication of this article were defrayed in part by the payment of page charges. The article must therefore be hereby marked “advertisement” in accordance with 18 U.S.C. Section 1734 solely to indicate this fact.
REFERENCES
- 1.Allan R, Steinberg DM, Dixon K, Cooke WT. Changes in the bidirectional sodium flux across the intestinal mucosa in Crohn's disease. Gut 16: 201–204, 1975. [DOI] [PMC free article] [PubMed] [Google Scholar]
- 2.Amann RI, Krumholz L, Stahl DA. Fluorescent-oligonucleotide probing of whole cells for determinative, phylogenetic, and environmental studies in microbiology. J Bacteriol 172: 762–770, 1990. [DOI] [PMC free article] [PubMed] [Google Scholar]
- 3.Amin MR, Dudeja PK, Ramaswamy K, Malakooti J. Involvement of Sp1 and Sp3 in differential regulation of human NHE3 promoter activity by sodium butyrate and IFN-γ/TNF-α. Am J Physiol Gastrointest Liver Physiol 293: G374–G382, 2007. [DOI] [PubMed] [Google Scholar]
- 4.Amin MR, Malakooti J, Sandoval R, Dudeja PK, Ramaswamy K. IFN-gamma and TNF-alpha regulate human NHE3 gene expression by modulating the Sp family transcription factors in human intestinal epithelial cell line C2BBe1. Am J Physiol Cell Physiol 291: C887–C896, 2006. [DOI] [PubMed] [Google Scholar]
- 5.Ardesjo B, Portela-Gomes GM, Rorsman F, Gerdin E, Loof L, Grimelius L, Kampe O, Ekwall O. Immunoreactivity against goblet cells in patients with inflammatory bowel disease. Inflamm Bowel Dis 14: 652–661, 2008. [DOI] [PubMed] [Google Scholar]
- 6.Bachmanov AA, Reed DR, Beauchamp GK, Tordoff MG. Food intake, water intake, and drinking spout side preference of 28 mouse strains. Behav Genet 32: 435–443, 2002. [DOI] [PMC free article] [PubMed] [Google Scholar]
- 7.Barmeyer C, Harren M, Schmitz H, Heinzel-Pleines U, Mankertz J, Seidler U, Horak I, Wiedenmann B, Fromm M, Schulzke JD. Mechanisms of diarrhea in the interleukin-2-deficient mouse model of colonic inflammation. Am J Physiol Gastrointest Liver Physiol 286: G244–G252, 2004. [DOI] [PubMed] [Google Scholar]
- 8.Beck FX, Neuhofer W, Dorge A, Giebisch G, Wang T. Intracellular Na concentration and Rb uptake in proximal convoluted tubule cells and abundance of Na/K-ATPase alpha1-subunit in NHE3−/− mice. Pflügers Arch 446: 100–105, 2003. [DOI] [PubMed] [Google Scholar]
- 9.Canetti CA, Leung BP, Culshaw S, McInnes IB, Cunha FQ, Liew FY. IL-18 enhances collagen-induced arthritis by recruiting neutrophils via TNF-alpha and leukotriene B4. J Immunol 171: 1009–1015, 2003. [DOI] [PubMed] [Google Scholar]
- 10.Clayburgh DR, Musch MW, Leitges M, Fu YX, Turner JR. Coordinated epithelial NHE3 inhibition and barrier dysfunction are required for TNF-mediated diarrhea in vivo. J Clin Invest 116: 2682–2694, 2006. [DOI] [PMC free article] [PubMed] [Google Scholar]
- 11.Debongnie JC, Phillips SF. Capacity of the human colon to absorb fluid. Gastroenterology 74: 698–703, 1978. [PubMed] [Google Scholar]
- 12.Dennis G, Sherman BT, Hosack DA, Yang J, Gao W, Lane HC, Lempicki RA. DAVID: Database for Annotation, Visualization, and Integrated Discovery. Genome Biol 4: P3, 2003. [PubMed] [Google Scholar]
- 13.Deplancke B, Gaskins HR. Microbial modulation of innate defense: goblet cells and the intestinal mucus layer. Am J Clin Nutr 73: 1131S–1141S, 2001. [DOI] [PubMed] [Google Scholar]
- 14.Gracie JA, Forsey RJ, Chan WL, Gilmour A, Leung BP, Greer MR, Kennedy K, Carter R, Wei XQ, Xu D, Field M, Foulis A, Liew FY, McInnes IB. A proinflammatory role for IL-18 in rheumatoid arthritis. J Clin Invest 104: 1393–1401, 1999. [DOI] [PMC free article] [PubMed] [Google Scholar]
- 15.Hawker PC, McKay JS, Turnberg LA. Electrolyte transport across colonic mucosa from patients with inflammatory bowel disease. Gastroenterology 79: 508–511, 1980. [PubMed] [Google Scholar]
- 16.Hayashi H, Szaszi K, Coady-Osberg N, Furuya W, Bretscher AP, Orlowski J, Grinstein S. Inhibition and redistribution of NHE3, the apical Na+/H+ exchanger, by Clostridium difficile toxin B. J Gen Physiol 123: 491–504, 2004. [DOI] [PMC free article] [PubMed] [Google Scholar]
- 17.Hecht G, Hodges K, Gill RK, Kear F, Tyagi S, Malakooti J, Ramaswamy K, Dudeja PK. Differential regulation of Na+/H+ exchange isoform activities by enteropathogenic E. coli in human intestinal epithelial cells. Am J Physiol Gastrointest Liver Physiol 287: G370–G378, 2004. [DOI] [PubMed] [Google Scholar]
- 18.Ikuma M, Hanai H, Kaneko E, Hayashi H, Hoshi T. Effects of aging on the microclimate pH of the rat jejunum. Biochim Biophys Acta 1280: 19–26, 1996. [DOI] [PubMed] [Google Scholar]
- 19.Inan MS, Tolmacheva V, Wang QS, Rosenberg DW, Giardina C. Transcription factor NF-kappaB participates in regulation of epithelial cell turnover in the colon. Am J Physiol Gastrointest Liver Physiol 279: G1282–G1291, 2000. [DOI] [PubMed] [Google Scholar]
- 20.Kiela PR, Guner YS, Xu H, Collins JF, Ghishan FK. Age- and tissue-specific induction of NHE3 by glucocorticoids in the rat small intestine. Am J Physiol Cell Physiol 278: C629–C637, 2000. [DOI] [PubMed] [Google Scholar]
- 21.Kiela PR, Hines ER, Collins JF, Ghishan FK. Regulation of the rat NHE3 gene promoter by sodium butyrate. Am J Physiol Gastrointest Liver Physiol 281: G947–G956, 2001. [DOI] [PubMed] [Google Scholar]
- 22.Ledoussal C, Lorenz JN, Nieman ML, Soleimani M, Schultheis PJ, Shull GE. Renal salt wasting in mice lacking NHE3 Na+/H+ exchanger but not in mice lacking NHE2. Am J Physiol Renal Physiol 281: F718–F727, 2001. [DOI] [PubMed] [Google Scholar]
- 23.Li Q, Carr AL, Donald EJ, Skitzki JJ, Okuyama R, Stoolman LM, Chang AE. Synergistic effects of IL-12 and IL-18 in skewing tumor-reactive T-cell responses towards a type 1 pattern. Cancer Res 65: 1063–1070, 2005. [PubMed] [Google Scholar]
- 24.Li Q, Verma IM. NF-kappaB regulation in the immune system. Nat Rev Immunol 2: 725–734, 2002. [DOI] [PubMed] [Google Scholar]
- 25.Lochner M, Forster I. Anti-interleukin-18 therapy in murine models of inflammatory bowel disease. Pathobiology 70: 164–169, 2002. [DOI] [PubMed] [Google Scholar]
- 26.Matsuzaki T, Tajika Y, Ablimit A, Aoki T, Hagiwara H, Takata K. Aquaporins in the digestive system. Med Electron Microsc 37: 71–80, 2004. [DOI] [PubMed] [Google Scholar]
- 27.Melvin JE, Park K, Richardson L, Schultheis PJ, Shull GE. Mouse down-regulated in adenoma (DRA) is an intestinal Cl(−)/HCO(3)(−) exchanger and is up-regulated in colon of mice lacking the NHE3 Na(+)/H(+) exchanger. J Biol Chem 274: 22855–22861, 1999. [DOI] [PubMed] [Google Scholar]
- 28.Monteleone G, Trapasso F, Parrello T, Biancone L, Stella A, Iuliano R, Luzza F, Fusco A, Pallone F. Bioactive IL-18 expression is up-regulated in Crohn's disease. J Immunol 163: 143–147, 1999. [PubMed] [Google Scholar]
- 29.Musch MW, Clarke LL, Mamah D, Gawenis LR, Zhang Z, Ellsworth W, Shalowitz D, Mittal N, Efthimiou P, Alnadjim Z, Hurst SD, Chang EB, Barrett TA. T cell activation causes diarrhea by increasing intestinal permeability and inhibiting epithelial Na+/K+-ATPase. J Clin Invest 110: 1739–1747, 2002. [DOI] [PMC free article] [PubMed] [Google Scholar]
- 30.Naftali T, Novick D, Gabay G, Rubinstein M, Novis B. Interleukin-18 and its binding protein in patients with inflammatory bowel disease during remission and exacerbation. Isr Med Assoc J 9: 504–508, 2007. [PubMed] [Google Scholar]
- 31.Nakanishi K, Yoshimoto T, Tsutsui H, Okamura H. Interleukin-18 is a unique cytokine that stimulates both Th1 and Th2 responses depending on its cytokine milieu. Cytokine Growth Factor Rev 12: 53–72, 2001. [DOI] [PubMed] [Google Scholar]
- 32.Pardi DS Microscopic colitis: an update. Inflamm Bowel Dis 10: 860–870, 2004. [DOI] [PubMed] [Google Scholar]
- 33.Pizarro TT, Michie MH, Bentz M, Woraratanadharm J, Smith MF Jr, Foley E, Moskaluk CA, Bickston SJ, Cominelli F. IL-18, a novel immunoregulatory cytokine, is up-regulated in Crohn's disease: expression and localization in intestinal mucosal cells. J Immunol 162: 6829–6835, 1999. [PubMed] [Google Scholar]
- 34.Puren AJ, Fantuzzi G, Gu Y, Su MS, Dinarello CA. Interleukin-18 (IFNgamma-inducing factor) induces IL-8 and IL-1beta via TNFalpha production from non-CD14+ human blood mononuclear cells. J Clin Invest 101: 711–721, 1998. [DOI] [PMC free article] [PubMed] [Google Scholar]
- 35.Reuter BK, Pizarro TT. Commentary: the role of the IL-18 system and other members of the IL-1R/TLR superfamily in innate mucosal immunity and the pathogenesis of inflammatory bowel disease: friend or foe? Eur J Immunol 34: 2347–2355, 2004. [DOI] [PubMed] [Google Scholar]
- 36.Rocha F, Musch MW, Lishanskiy L, Bookstein C, Sugi K, Xie Y, Chang EB. IFN-γ downregulates expression of Na+/H+ exchangers NHE2 and NHE3 in rat intestine and human Caco-2/bbe cells. Am J Physiol Cell Physiol 280: C1224–C1232, 2001. [DOI] [PubMed] [Google Scholar]
- 37.Sandle GI, Hayslett JP, Binder HJ. Effect of glucocorticoids on rectal transport in normal subjects and patients with ulcerative colitis. Gut 27: 309–316, 1986. [DOI] [PMC free article] [PubMed] [Google Scholar]
- 38.Sartor RB Microbial influences in inflammatory bowel diseases. Gastroenterology 134: 577–594, 2008. [DOI] [PubMed] [Google Scholar]
- 39.Schultheis PJ, Clarke LL, Meneton P, Miller ML, Soleimani M, Gawenis LR, Riddle TM, Duffy JJ, Doetschman T, Wang T, Giebisch G, Aronson PS, Lorenz JN, Shull GE. Renal and intestinal absorptive defects in mice lacking the NHE3 Na+/H+ exchanger. Nat Genet 19: 282–285, 1998. [DOI] [PubMed] [Google Scholar]
- 40.Seidler U, Lenzen H, Cinar A, Tessema T, Bleich A, Riederer B. Molecular mechanisms of disturbed electrolyte transport in intestinal inflammation. Ann NY Acad Sci 1072: 262–275, 2006. [DOI] [PubMed] [Google Scholar]
- 41.Wallner G, Amann R, Beisker W. Optimizing fluorescent in situ hybridization with rRNA-targeted oligonucleotide probes for flow cytometric identification of microorganisms. Cytometry 14: 136–143, 1993. [DOI] [PubMed] [Google Scholar]
- 42.Wang Z, Petrovic S, Mann E, Soleimani M. Identification of an apical Cl−/HCO3− exchanger in the small intestine. Am J Physiol Gastrointest Liver Physiol 282: G573–G579, 2002. [DOI] [PubMed] [Google Scholar]
- 43.Woo AL, Gildea LA, Tack LM, Miller ML, Spicer Z, Millhorn DE, Finkelman FD, Hassett DJ, Shull GE. In vivo evidence for interferon-gamma-mediated homeostatic mechanisms in small intestine of the NHE3 Na+/H+ exchanger knockout model of congenital diarrhea. J Biol Chem 277: 49036–49046, 2002. [DOI] [PubMed] [Google Scholar]
- 44.Yun CC, Chen Y, Lang F. Glucocorticoid activation of Na(+)/H(+) exchanger isoform 3 revisited. The roles of SGK1 and NHERF2. J Biol Chem 277: 7676–7683, 2002. [DOI] [PubMed] [Google Scholar]


