

Abstract
Objectives
To test an original scale assessing perceived school climate for girls’ physical activity in middle school girls.
Methods
Confirmatory factor analysis (CFA) and structural equation modeling (SEM).
Results
CFA retained 5 of 14 original items. A model with 2 correlated factors, perceptions about teachers’ and boys’ behaviors, respectively, fit the data well in both sixth and eighth graders. SEM detected a positive, significant direct association of the teacher factor, but not the boy factor, with girls’ self-reported physical activity.
Conclusions
School climate for girls’ physical activity is a measurable construct, and preliminary evidence suggests a relationship with physical activity.
Keywords: adolescents, school, physical activity, exercise
Despite considerable evidence that physical activity confers substantial health benefits, many adolescents do not engage in sufficient activity to meet minimum recommended levels.1,2 Physical activity (PA) declines during the transition from childhood to adolescence in both girls and boys.3–6 Boys generally engage in more PA at each age,6 and there is a sharp decline among teenage girls.7,8 Understanding the gender discrepancy can inform interventions promoting PA among girls. One of the few large-scale physical activity intervention studies in middle schools underscores this concern: investigators found that boys were more active than girls both during physical education (PE) classes9 and on school grounds during non-PE times.10 After 2 years of intervention, significant increases in PA were detected among boys but not girls.11
Because adolescents spend a substantial amount of time at school, this environment is of interest for understanding and modifying PA behaviors.12,13 The extent to which the school climate supports girls’ being physically active may be important. School climate has been described as the quality of the overall school environment, comprising 4 domains: physical environment, social system, culture, and aggregated characteristics of members of the school community.14,15 Each of these domains could potentially affect girls’ participation in PA, for example, through adequate PA facilities (physical environment), interpersonal relationships that are respectful of gender differences and social and pubertal development (social system), values and norms that support a physically active lifestyle for all (culture), and the prevalence of PA-related behaviors of other girls and female staff members in the school (aggregated characteristics).
There is some evidence to support the hypothesis that general school climate or functioning affects students’ health behaviors such as use of tobacco, alcohol, or violence.16–18 Research also suggests that school-level norms specifically concerning alcohol or tobacco use are related to individual students’ substance use.19,20 To date, there has been less research into the effects of school climate on physical activity. School-level measures such as the recent School Health Index 21 will help facilitate investigations into the effects of school policies and physical environments on physical activity and other health behaviors. However, the School Health Index does not have an explicit gender focus, nor does it explicitly evaluate students’ perceptions of the culture regarding PA. A computerized literature search yielded no school climate survey measures specific to girls’ or to general PA. Qualitative research, however, supports the idea that girls perceive school climate regarding PA to be relevant to their PA participation both in PE classes22–24 and overall.25
The purpose of this study was to establish the factorial validity, factorial invariance, and construct validity of an original scale assessing perceived school climate for girls’ physical activity in a sample of sixth- and eighth-grade girls. The measure was developed as part of the Trial of Activity for Adolescent Girls (TAAG), a multicenter intervention study to promote PA in middle school girls. The candidate items for the school climate measure were developed through a review of qualitative research with adolescent girls including formative assessment conducted as part of the developmental phase of TAAG, as well as resources designed for school-level assessments, such as the CDC’s School Health Index21 and the National Association of School Physical Educators’ PE Program Improvement and Self-Study Guide for middle schools.26 After developing the scale items, we used standard confirmatory factor analytic procedures27,28 to establish the factorial validity and the multigroup and longitudinal factorial invariance of the school climate measure in samples of sixth- and eighth-grade girls. After the factorial validity and invariance of the measure were established, structural equation modeling was used to assess construct validity of the school climate measure by testing its relationship with physical activity, as well as the equivalence of that relationship between the 2 groups of girls (sixth and eighth graders), using standard procedures.29
METHOD
Participants
Participants (N=605) were adolescent girls in the sixth (n=309) and eighth (n=296) grades recruited from communities in or near the 6 TAAG field centers: Baltimore, MD; Columbia, SC; New Orleans, LA; Minneapolis, MN; San Diego, CA; and Tucson, AZ. Nearly 80% of the sixth- (n=250) and eighth- (n=226) grade girls completed the measures both the initial time and again 2 weeks later, permitting an examination of the stability of the measurement instruments. The sixth-grade girls had a mean age of 11.5 (SD=0.6) years with racial/ethnic proportions of 45.6% white, 19.7% black, 14.2% Hispanic, 3.2% Asian/Pacific Islander, 1.9% American Indian, and 3.9% other; 11.3% of the sixth-grade girls did not report race/ethnicity. The eighth-grade girls had a mean age of 13.5 (SD=0.6) years with racial/ethnic proportions of 51.0% white, 17.6% black, 13.9% Hispanic, 3.0% Asian/Pacific Islander, 1.0% American Indian, and 3.0% other; 10.5% of the eighth-grade girls did not report race/ethnicity. There was not a statistically significant difference between sixth-and eighth-grade girls in the distribution of race/ethnicity, χ2 (5, N=539) = 2.5, P=0.78. All participating schools were public schools, with a mean total enrollment of 872 (SD=448) students. The proportion of students receiving free or reduced-price lunch varied across schools, from a low of 31.8% to a high of 89.7% (mean = 43.5%, SD=12.8%).
Measures
School climate for girls’ PA
Fourteen candidate items were developed with a focus on school social systems and culture as they relate to girls’ PA. These items were pretested with convenience samples of approximately 25 sixth- and eighth-grade girls in Baltimore, MD and Columbia, SC. Based on feedback from the pretesters, modifications were made to the wording and formatting of the items, and the revised 14 items were included in the test-retest administration described above. Example items were “In my school, PE teachers act like they think it is more important for boys to be physically active than girls,” “In my school, the PE teachers like girls even if they aren’t good athletes,” and “In my school, boys make rude comments around girls who are being physically active.” Items were rated on a 5-point scale ranging from (1) disagree at lot to (5) agree a lot. Items were reverse coded prior to analysis so higher scores represented more favorable perceptions of school climate.
Physical activity
A modified version of the Physical Activity Questionnaire for Older Children (PAQ-C) reported elsewhere30,31 was used. This measure was chosen because it has been validated for use with children of ages similar to the present sample. Also, its length and format minimized participant burden, which was a concern in this pilot study because all questions had to be answered by the students within a single class period. The original instrument used 9 questions to assess the level of participation in physical activity, which was defined as “sports, games, or dance that make you breathe hard, make your legs feel tired, or make you sweat.” Each item is scored on a 5-point scale, and the sum of the item scores is used as the indicator of physical activity. Internal consistency coefficients (Cronbach alpha) ranged from 0.79 to 0.89, and the test-retest stability coefficients across 2 weeks were 0.75 for boys and 0.82 for girls.30 We used 5 original items that specifically assess activity in physical education classes, during the lunch period, right after school, in the evenings, and on the weekend. We removed an item pertaining to recess that was not relevant to our sample30,31 and 3 other items that lacked specificity and were too time-consuming: an activity checklist, an item about general physical activity each day, and an item about overall physical activity. The 5-item measure of PA conformed to a single-factor model, and this model demonstrated factorial invariance between groups and across time in our previous analyses.
Procedure
The study procedure was approved by the university institutional review board at each of the 6 study centers. Written informed consent was provided by a parent or guardian, and each participant provided written assent at the time of survey administration. Testing was conducted in the spring of 2002, on 2 occasions separated by 2 weeks. Survey administration settings varied slightly across sites: some were in classrooms and others in cafeterias or other group settings. Survey data collectors participated in a centralized training to ensure that standardized procedures, scripts, and protocols were employed when collecting responses to the scales.
Data Analysis
Confirmatory factor analysis and structural equation modeling were used to test the factorial validity, factorial invariance, and construct validity of the measure of school climate. The analyses were performed using full-information maximum likelihood (FIML) estimation in AMOS 4.0 (SmallWaters Corp., Chicago, IL).32 FIML was selected because there were missing responses to items on the school climate questionnaire, ranging from 2.1 to 3.9% of missing responses per item. FIML is an optimal method for the treatment of missing data in SEM32 that has yielded accurate fit indices and parameter estimates with simulated missing data.33,34
Model fit was assessed using multiple indices. The χ2 statistic assesses absolute fit of the model to the data, and a nonsignificant χ2 supports the perfect fit of the model.35–37 Two recognized limitations of the χ2 statistic are sensitivity to sample size and the assumption of the correct model.35–37 Therefore, no restrictive model with positive degrees of freedom is able to fit real data, and such models often will be rejected by a formal significance test with a sufficiently large sample.38,39 Accordingly, other fit indices must be used for judging model fit. The root mean square error of approximation (RMSEA) represents closeness of fit, and values approximating 0.06 and zero demonstrate close and exact fit of the model.38,40 The 90% confidence interval (CI) around the RMSEA point estimate also should contain 0.06 or zero to indicate the possibility of close or exact fit. The comparative fit index (CFI) and non-normed fit index (NNFI) test the proportionate improvement in fit by comparing the target model with the independence model.41,42 Minimally acceptable fit was based on CFI and NNFI values of 0.90;41,42 values approximating 0.95 indicate good fit.40 The parameter estimates, standard errors, z-statistics, and squared multiple correlations (SMCs) were inspected for sign and/or magnitude. Parameters with nonsignificant z-statistics and/or a sign opposite of expected direction have no substantively meaningful interpretation.36 Large standard errors provide an indication that the parameter estimate is not reliable.43
The test of factorial validity was performed with standard confirmatory factor analytic procedures. The procedures involved testing the fit of a measurement model for the items on the school climate scale. Standard procedures were used to establish the parameters in the factor loading, factor variance-covariance, and item uniqueness matrices for the measurement model.
The tests of factorial invariance (across grades and over the 2-week test-retest period) were performed with confirmatory factor analysis. The tests involved comparing models that imposed successive restrictions on model parameters for the equality of the overall structure, factor loadings, item uniquenesses, and factor variances and covariances.35 The comparison of nested models was based on chi-square difference tests and changes in the values of the RMSEA, CFI, and NNFI. The criterion of −0.01 for a change in the CFI (CFIconstrained model − CFIunconstrained model), for example, has been reported to be robust for testing the multigroup invariance44 and has been employed in analyses of longitudinal factorial invariance.29
Construct validity of the school climate measure was evaluated using structural equation modeling. We adopted a structural equation modeling approach because it provides a test of the relationship between school climate and physical activity that is not biased by measurement error. Moreover, we could test the direction and magnitude of the association between school climate and physical activity for equivalence between sixth- and eighth-grade students with the structural equation modeling approach. The measure of effect produced by the structural equation models reported here, standardized gamma (γ), represents the association of an exogenous variable (school climate) with an endogenous variable (self-reported physical activity) and is interpreted as the amount of change in the endogenous variable associated with a 1-unit change in the exogenous variable.
RESULTS
Factorial Validity
Initial tests with the sample of sixth-grade students indicated that the fit of a single-factor model to the 14 school climate items was not acceptable (χ2 = 583.64, df=77, P<0.001, RMSEA=0.15 [90% CI=0.14–0.16], CFI=0.50, NNFI=0.41). Four items were identified as potentially problematic due to interpretation difficulties and possible redundancy with other items. Those items were removed, and the fit of the single-factor model remained unacceptable among the sixth graders (χ2 = 204.66, df=35, P<0.001, RMSEA=0.13 [90% CI=0.11 – 0.14], CFI=0.66, NNFI=0.57). Items with nonsignificant factor loadings were then removed sequentially until 5 items remained that all had significant factor loadings, but the 5 items were still not represented by a single factor among the sixth graders (χ2 = 70.18, df=5, P<0.001, RMSEA=0.21 [90% CI = 0.17–0.25], CFI=0.84, NNFI=0.67). Based on item content, 2 conceptually distinct, but correlated factors were identified: 1 pertaining to teachers (2 items) and 1 pertaining to boys (3 items). This 2-factor, correlated model provided an excellent fit in the sixth-grade girls (χ2 = 2.04, df=4, P=0.73, RMSEA = 0.00 [90% CI = 0.00 – 0.06], CFI = 1.00, NNFI=1.01) and a good fit in the eighth-grade girls (χ2 = 14.28, df=4, P=0.006, RMSEA=0.09 [90% CI=0.04 – 0.15], CFI = 0.97, NNFI = 0.93). The interfactor correlations were 0.57 and 0.33 in the samples of sixth- and eighth-grade girls, respectively. Table 1 presents the items retained in the final 2-factor solution, and the standardized factor loadings for both samples.
Table 1.
Items and Factor Loadings of the School Climate Measure in a Sample of Sixth and Eighth Gradersa
| Factor Loading for Sixth-grade Students | Factor Loading for Eighth-grade Students | |
|---|---|---|
| Factor 1: Teachers | ||
| In my school, PE teachers act like they think it is more important for boys to be physically active than girls | .825 | .809 |
| In my school, most teachers think it is more important for boys to be physically active than girls. | .876 | .964 |
| Factor 2: Boys | ||
| In my school, boys make rude comments around girls who are being physically active. | .491 | .545 |
| In my school, being physically active around boys makes me uncomfortable. | .591 | .489 |
| In my school, boys stare too much at girls who are being physically active. | .795 | .702 |
Note. Response Options: 1=Disagree a lot, 2=Disagree a little, 3=Neither agree nor disagree, 4=Agree a little, 5=Agree a lot. Items were reverse coded for analysis so higher scores reflected more favorable perceived school climate.
Factorial Invariance
The 2-factor, correlated model demonstrated strong invariance of the factor structure, factor loadings, and item uniquenesses, and acceptable invariance of the factor variances and covariance, between the sixth- and eighth-grade samples. The model demonstrated strong invariance of the factor structure, factor loadings, and factor variances and covariances, but not item uniqueness across 2 weeks within the combined sample of sixth- and eighth-grade girls based on the longitudinal invariance analysis. The stability coefficients for the factors pertaining to teachers and boys across 2 weeks were 0.59 and 0.56, respectively.
Construct Validity
Sixth-grade girls
The model specifying direct associations of the 2 correlated factors pertaining to teachers and boys with physical activity is displayed in Figure 1 and provided a perfect fit in the sample of sixth-grade girls (χ2 = 38.81, df=32, P=0.19, RMSEA [90% CI]=0.03 [0.00–0.05], CFI=0.97, NNFI=0.96). There was a statistically significant direct association of the teacher factor with physical activity (γ11 = 0.17), but not a significant association of the boy factor (γI2 = −0.06).
Figure 1.
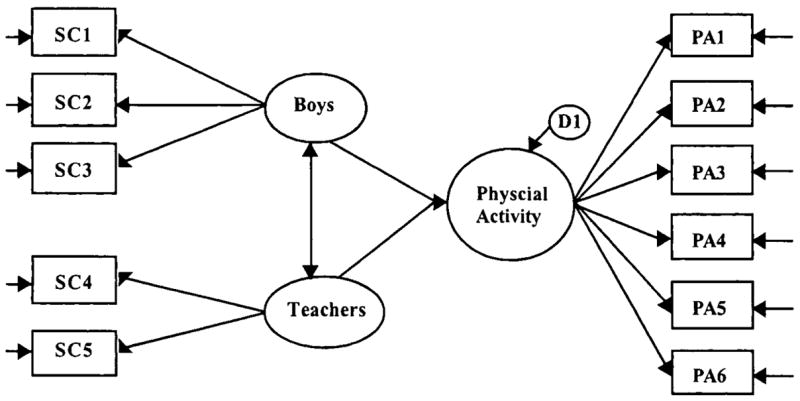
Structural Equation Model Fit in Sixth- and Eighth-grade Girls
Note. Abbreviations: SC=school climate, PA=physical activity, D=disturbance term
Eighth-grade girls
The model specifying direct associations of the two correlated factors pertaining to teachers and boys with physical activity is displayed in Figure 1 and provided a good fit in the sample of eighth-grade girls (χ2 = 59.02, df=32, P=0.003, RMSEA [90% CI]=0.05 [0.03–0.08], CFI=0.95, NNFI=0.94). There was a statistically significant direct association of the teacher factor with physical activity (γ11 = 0.24), but not a significant association of the boy factor (γ12 = −0.15).
Multigroup invariance analysis
We tested a final model that constrained the direct associations of the 2 correlated factors pertaining to teachers and boys on physical activity to be equal between the sixth- and eighth-grade girls. This enabled a statistical test of possible differences in the magnitude of those paths between age groups. The first model did not constrain the 2 paths to be equal between groups, and provided a good fit (χ2 = 97.83, df=64, P=0.004, RMSEA [90% CI] = 0.03 [0.02–0.04], CFI=0.97, NNFI=0.96). The second model constrained the 2 paths to be equal between groups, and this model provided a good fit (χ2 = 98.12, df=66, P=0.006, RMSEA [90% CI] = 0.03 [0.02–0.04], CFI=0.97, NNFI=0.96). There was not a statistically significant difference in fit between the 2 nested models (χ2diff = 0.29, df=2, P=0.87). Therefore, the paths were similar in direction and magnitude between groups of sixth- and eighth-grade girls.
DISCUSSION
Our data support the hypothesis that perception of the school climate for girls’ physical activity is a construct that is measurable, factorially invariant, and related to physical activity among adolescent girls. The best fitting model consisted of 5 items that were represented by 2 correlated factors. The 2 correlated factors described girls’ perceptions of teachers and boys, respectively, in relation to girls’ being physically active. The school climate measure demonstrated factorial invariance across the 2 grade levels (sixth and eighth) and across a 2-week time window, allowing for valid comparisons of scores from the measure between grades and across time. The teacher factor, but not the boy factor, had a significant direct association with self-reported physical activity in both sixth- and eighth-grade girls. The direct association of the teacher factor with self-reported physical activity was of similar direction and magnitude across both grades.
The work reported here provides preliminary support for continuing to explore the role of school climate in girls’ PA behaviors. The TAAG main trial, currently in progress, will provide a stronger test of the school climate measure in several areas: (1) variability in school climate is expected to increase with 36 schools in the main trial compared with the 6 pilot schools represented in the present study; (2) precision will be increased with a substantially larger sample size than used in the current study; and (3) assessment of validity of the climate variable will be improved as physical activity will be measured objectively with accelerometers rather than with the PAQ-C used in the present study. Additionally, 3-day PA recalls using a modified version of the 3-day physical activity recall (3DPAR) will provide details concerning when, where, and with whom girls participated in PA.45 Nevertheless, this preliminary test of a brief measure of a novel construct, school climate for girls’ PA, provides support for further investigation. Our hope in reporting these results is to encourage the testing of this construct in other settings as a step in further learning how school climate and girls’ PA are related. Interest in the school environment for PA, eating, and other health-related behaviors is increasing,11,13,21 and measures such as this one could help provide insights for intervention, such as possible needs for marketing girls’ PA not only to girls themselves, but also to important secondary audiences such as teachers and boys, whose attitudes and behaviors may be influential.
Like many other school climate measures, 14,46,47 the measure reported here assesses individuals’ perceptions rather than higher-level institutional characteristics. It would be of interest to conduct a parallel investigation of school climate for girls’ PA by exploring observable characteristics of the school environment, such as bulletin boards and displays, school publications and website, or interactions among teachers, boys, and girls. Such factors could contribute to the perceptions of school climate reported here, and might reveal promising strategies for school-level interventions to promote PA among adolescent girls.
Acknowledgments
This research was supported by the National Heart, Lung, and Blood Institute grants U01HL-66845, 66852, 66853, 66855, 66856, 66857, 66858.
References
- 1.U. S. Department of Health and Human Services. The Surgeon General’s call to action to prevent and decrease overweight and obesity. Rockville: U. S. Department of Health and Human Services, Public Health Service, Office of the Surgeon General; 2001. pp. 1–13. [PubMed] [Google Scholar]
- 2.Grunbaum JA, Kann L, Kinchen S, et al. Youth Risk Behavior Surveillance - United States, 2001. J Sch Health. 2002;72(8):313–328. doi: 10.1111/j.1746-1561.2002.tb07917.x. [DOI] [PubMed] [Google Scholar]
- 3.Aaron DJ, Storti KL, Roberston RJ, et al. Longitudinal study of the number and choice of leisure time physical activities from mid to late adolescence. Arch Pediatr Adolesc Med. 2002;156:1075–1080. doi: 10.1001/archpedi.156.11.1075. [DOI] [PubMed] [Google Scholar]
- 4.Bradley CB, McMurray RG, Harrell JS, et al. Changes in common activities of 3rd through 10th graders: the CHIC study. Med Sci Sports Exerc. 2000;32(12):2071–2078. doi: 10.1097/00005768-200012000-00017. [DOI] [PubMed] [Google Scholar]
- 5.Sallis JF, Prochaska JJ, Taylor WC, et al. Correlates of physical activity in a national sample of girls and boys in grades 4 through 12. Health Psycho. 1999;18(4):410–415. doi: 10.1037//0278-6133.18.4.410. [DOI] [PubMed] [Google Scholar]
- 6.Trost SG, Pate RR, Sallis JF, et al. Age and gender differences in objectively measured physical activity in youth. Med Sci Sports Exerc. 2002;34(2):350–355. doi: 10.1097/00005768-200202000-00025. [DOI] [PubMed] [Google Scholar]
- 7.Goran MI, Gower BA, Nagy TR, et al. Developmental changes in energy expenditure and physical activity in children: evidence for a decline in physical activity in girls before puberty. Pediatrics. 1998;101:887–891. doi: 10.1542/peds.101.5.887. [DOI] [PubMed] [Google Scholar]
- 8.Kimm SY, Glynn NW, Kriska AM, et al. Decline in physical activity in black girls and white girls during adolescence. N Engl J Med. 2002;347(10):709–715. doi: 10.1056/NEJMoa003277. [DOI] [PubMed] [Google Scholar]
- 9.McKenzie TL, Marshall SJ, Sallis JF, et al. Student activity levels, lesson context, and teacher behavior during middle school physical education. Res Q Exerc Sport. 2000;71(3):249–259. doi: 10.1080/02701367.2000.10608905. [DOI] [PubMed] [Google Scholar]
- 10.Sallis JF, Conway TL, Prochaska JJ, et al. The association of school environment with youth physical activity. Am J Pub Health. 2001;91(4):618–620. doi: 10.2105/ajph.91.4.618. [DOI] [PMC free article] [PubMed] [Google Scholar]
- 11.Sallis JF, McKenzie TL, Conway TL, et al. Environmental interventions for eating and physical activity: a randomized controlled trial in middle schools. Am J Prev Med. 2003;24:209–217. doi: 10.1016/s0749-3797(02)00646-3. [DOI] [PubMed] [Google Scholar]
- 12.Centers for Disease Control and Prevention. Guidelines for school and community programs to promote lifelong physical activity among young people. MMWR. 1997;46:RR-6. [PubMed] [Google Scholar]
- 13.Wechsler H, Devereaux RS, Davis M, et al. Using the school environment to promote physical activity and healthy eating. Prev Med. 2000;31(2):S121–S137. [Google Scholar]
- 14.Anderson CS. The search for school climate: a review of the research. Review of Educational Research. 1982;52(3):368–420. [Google Scholar]
- 15.Tagiuri R. The concept of organizational climate. In: Tagiuri R, Litwin GH, editors. Organizational Climate: Exploration of a Concept. Boston: Harvard University; pp. 11–32. [Google Scholar]
- 16.Birnbaum AS, Lytle LA, Hannan PJ, et al. School functioning and violent behavior among young adolescents: a contextual analysis. Health Educ Res. 2003;18(3):389–403. doi: 10.1093/her/cyf036. [DOI] [PubMed] [Google Scholar]
- 17.McBride CM, Curry SJ, Cheadle A, et al. School-level application of a social bonding model to adolescent risk-taking behavior. J Sch Health. 1995;65(2):63–68. doi: 10.1111/j.1746-1561.1995.tb03347.x. [DOI] [PubMed] [Google Scholar]
- 18.Maes L, Lievens J. Can the school make a difference? A multilevel analysis of adolescent risk and health behavior. Soc Sci Med. 2003;56:517–529. doi: 10.1016/s0277-9536(02)00052-7. [DOI] [PubMed] [Google Scholar]
- 19.Kumar R, O’Malley PM, Johnston LD, et al. Effects of school-level norms on student substance use. Prev Sci. 2002;3(2):105–124. doi: 10.1023/a:1015431300471. [DOI] [PubMed] [Google Scholar]
- 20.Roski J, Perry CL, McGovern PG, et al. School and community influences on adolescent alcohol and drug use. Health Educ Res. 1997;12(2):255–266. doi: 10.1093/her/12.2.255. [DOI] [PubMed] [Google Scholar]
- 21.Centers for Disease Control and Prevention. School Health Index for Physical Activity, Healthy Eating, and a Tobacco-Free Lifestyle. Atlanta, GA: 2002. pp. 1–12. [Google Scholar]
- 22.Derry JA. Single-sex and coeducation physical education: perspectives of adolescent girls and female physical education teachers. Melpomene Journal. 2002;21(3):21–28. [Google Scholar]
- 23.Leslie J, Yancy A, McCarthy W, et al. Development and implementation of a school-based nutrition and fitness promotion program for ethnically diverse middle-school girls. J Am Diet Assoc. 1999;99(8):967–970. doi: 10.1016/S0002-8223(99)00230-8. [DOI] [PubMed] [Google Scholar]
- 24.Olafson L. “I hate phys. ed. ”: adolescent girls talk about physical education. Physical Educator. 2002;59(2):67–73. [Google Scholar]
- 25.Neumark-Sztainer D, Story M. Recommendations from overweight youth regarding school-based weight control programs. J Scn Health. 1997;67(10):428–433. doi: 10.1111/j.1746-1561.1997.tb01289.x. [DOI] [PubMed] [Google Scholar]
- 26.National Association for Sport and Physical Education (NASPE) Middle and Secondary School Physical Education Council. Physical Education Program Improvement and Self-Study Guide: Middle School. Oxon Hill: AAHPERD Publications; 1998. pp. 1–15. [Google Scholar]
- 27.Dishman RK, Motl RW, Saunders RP, et al. Factorial invariance and latent mean structure of questionnaires measuring social-cognitive determinants of physical activity among black and white adolescent girls. Prev Med. 2002;34(1):100–108. doi: 10.1006/pmed.2001.0959. [DOI] [PubMed] [Google Scholar]
- 28.Motl RW, Dishman RK, Trost SG, et al. Factorial validity and invariance of questionnaires measuring social-cognitive determinants of physical activity in adolescent girls. Prev Med. 2000;31:584–594. doi: 10.1006/pmed.2000.0735. [DOI] [PubMed] [Google Scholar]
- 29.Motl RW, DiStefano C. Longitudinal invariance of self-esteem and method effects associated with negatively worded items. Structural Equation Modeling. 2002;9:562–578. [Google Scholar]
- 30.Crocker PRE, Bailey DA, Faulkner RA, et al. Measuring general levels of physical activity: Preliminary evidence for the physical activity questionnaire for older children. Med Sci Sports Exerc. 1997;29:1344–1349. doi: 10.1097/00005768-199710000-00011. [DOI] [PubMed] [Google Scholar]
- 31.Kowalski KC, Crocker PRE, Faulkner RA. Validation of the physical activity questionnaire for older children. Pediatric Exercise Science. 1997;9:174–186. [Google Scholar]
- 32.Arbuckle JL, Wothke W. Amos 4.0 User’s Guide. Chicago, IL: SmallWaters Corporation; 1999. [Google Scholar]
- 33.Arbuckle JL. Full information estimation in the presence of incomplete data. In: Marcoulides GA, Schumacker RE, editors. Advanced Structural Equation Modeling: Issues and Techniques. Mahwah, NJ: Lawrence Erlbaum; 1996. pp. 243–277. [Google Scholar]
- 34.Enders CK, Bandalos DL. The relative performance of full information maximum likelihood estimation for missing data in structural equation models. Structural Equation Modeling. 2001;8:430–457. [PubMed] [Google Scholar]
- 35.Bollen KA. Structural Equations with Latent Variables. New York, NY: John Wiley & Sons; 1989. pp. 1–514. [Google Scholar]
- 36.Jöreskog KG. Testing structural equation models. In: Bollen KA, Long JS, editors. Testing Structural Equation Models. Newbury Park: Sage Publications; 1993. pp. 294–316. [Google Scholar]
- 37.Jöreskog KG, Sörbom D. LISREL 8: User’s Reference Guide. Chicago: Scientific Software International; 1996. [Google Scholar]
- 38.Browne MW, Cudeck R. Alternative ways of assessing model fit. In: Bollen KA, Long JS, editors. Testing Structural Equation Models. Newbury Park: Sage Publications; 1993. pp. 136–162. [Google Scholar]
- 39.Cudeck R, Browne MW. Cross- validation of covariance structures. Multivariate Behavioral Research. 1983;18:147–167. doi: 10.1207/s15327906mbr1802_2. [DOI] [PubMed] [Google Scholar]
- 40.Hu L, Bentler PM. Cutoff criteria for fit indices in covariance structure analysis: Conventional criteria versus new alternatives. Structural Equation Modelin. 1999;6:1–55. [Google Scholar]
- 41.Bentler PM. Comparative fit indices in structural models. Psychol Bull. 1990;107:238–246. doi: 10.1037/0033-2909.107.2.238. [DOI] [PubMed] [Google Scholar]
- 42.Bentler PM, Bonett DG. Significance tests and goodness of fit in the analysis of covariance structures. Psychol Bull. 1980;88:588–606. [Google Scholar]
- 43.Raykov T, Marcoulides GA. A first course in structural equation modeling. Mahwah, NJ: Lawrence Erlbaum; 2000. p. 35. [Google Scholar]
- 44.Cheung GW, Rensvold RB. Evaluating goodness-of-fit indices for testing measurement invariance. Structural Equation Modeling. 2002;9:233–255. [Google Scholar]
- 45.Pate RR, Ross R, Dowda M, et al. Validation of a 3-day physical activity recall instrument in female youth. Pediatric Exercise Science. 2003;15:257–265. [Google Scholar]
- 46.Hoy WK, Hoffman J, Sabo D, et al. The organizational climate of middle schools: The development and test of the OCDQ-RM. Journal of Educational Administration. 1996;34:41–59. [Google Scholar]
- 47.Moos RH. Evaluating Educational Environments: Procedures, Measures, Findings, and Policy Implications. San Francisco: Jossey-Bass; 1979. pp. 1–334. [Google Scholar]