

Abstract
The task of maintaining energy balance involves not only making sure that the number of calories ingested equals the number of calories burned but also involves ensuring nutrient balance. This means that over time, the quantity of carbohydrate, fat and protein consumed equals the amount of each oxidized. While the body has the ability to convert protein to carbohydrate and carbohydrate to fat, over long periods of time the body establishes nutrient balance with a high degree of accuracy storing excess nutrients as fat. To make decisions about food intake, the brain must assimilate information about the quantity of nutrients ingested and their disposition through the body over time. This is a very complex time ordered process as different tissues may be in different states of energy balance at different intervals following food ingestion. The fundamental task for the brain is to assess the influx of nutrients relative to stored pools of those nutrients and the rate at which they are being oxidized. It has been suggested that this task is particularly difficult for dietary fat because the stored pool of lipid is quite large compared to either the stored pools of carbohydrate and protein or the quantity of fat ingested per day. It is clear that some organisms resist weight gain even in the face of highly palatable diets. In fact most individuals eat less on any given day than they could given their maximal capacity for consumption. A central question then is: what restrains food intake in the setting of widely available highly palatable food? In this paper we will discuss the evidence that the movement of dietary fat between tissues may play an important role in the fidelity of nutrient sensing and as a result, resistance or susceptibility to obesity. In particular, the relative metabolism of dietary fat favoring oxidation over storage may be associated with more robust signaling of positive energy balance and resistance to dietary induced obesity in both humans and rats.
Keywords: Dietary fat, appetite, obesity, thinness, humans, rat models
Introduction
Obesity is clearly a growing public health problem in the United States and around the world (45). Many have suggested that this is due to the increased availability of highly palatable food and reduced levels of habitual physical activity. However, some individuals are able to maintain a normal body weight in the face of an environment that seems to promote obesity in most. How do these constitutively thin individuals accomplish this? Are there lessons to be learned from understanding their physiology that have relevance to the more common biology underlying progressive weight gain? While it is clear that hedonic aspects of food consumption seem to drive intake in excess of that needed to maintain energy stores, this should not be taken to mean that the maintenance of energy balance is not a critical function of ingestive behavior. In fact, most individuals eat far less at any given meal than they are physically capable of doing. Flatt has suggested that determining what restrains food intake on most days below the level of maximal consumption is one of the central questions in understanding the regulation of food intake (17). While many studies have focused on hunger, (the physiological drive to eat more in the face of reduced energy stores), given the current epidemic of obesity, it may be more helpful to understand the physiological factors that restrain food intake in the setting of positive energy balance.
If one thinks more deeply about the energy balance equation, it becomes clear that the currency of energy balance is the flow of nutrients between tissues. Not only does the body maintain energy balance as expressed in calories ingested and calories expended, the body must maintain a balance between ingested macronutrients: carbohydrate, fat and protein, and the amounts of these nutrients oxidized. To accomplish this goal, the brain must get reliable information on the amount of these nutrients ingested, the amounts stored in tissues like liver, skeletal muscle and fat, and the amount of each nutrient oxidized. The complexity of this task becomes apparent when one realizes that the state of energy balance may be quite different in different tissues in the minutes and hours following food intake. At any particular time relative to the ingestion of a meal, some tissues may be in positive energy (nutrient) balance while other tissues might be in negative energy (nutrient) balance. Therefore, the brain must acquire information about the time ordered distribution of nutrients between tissues. Just before a meal is ingested, most tissues are in a state of negative carbohydrate and fat balance. Insulin is low, counter-regulatory hormones are high, lipolysis is increased and the liver is producing glucose. By the end of the meal when food intake stops, the gastrointestinal (GI) tract is in markedly positive nutrient balance. Yet ingested nutrients have not been distributed to skeletal muscle, liver and adipose tissue (perhaps brain) which remain in “negative energy balance”. Two to 3 hours after meal ingestion, long after food intake has ceased, a substantial portion of the meal nutrients have been distributed to the liver and skeletal muscle. Insulin is high, counter regulatory hormones are low, ghrelin is low and PYY is high. At this point, food intake is a low behavioral priority for the animal or person. Eventually, a tipping point is reached when the body goes from a state of positive energy balance, working to assimilate the last meal, to a state of negative energy balance requiring the mobilization of stored nutrients from liver, muscle and adipose tissue.
Through these meal cycles, how is energy balance regulated and maintained? Some have suggested that key signals come from the energy state of liver or muscle (18; 19). Others have suggested that glycogen levels within these tissues may be important (16). Others have suggested that adipose tissue mass is the key stored nutrient pool that is regulated. Data also supports an important role for nutrient sensing in the hypothalamus (33; 44). Another possibility is that the key parameter being regulated is the transitional point between positive (assimilation of exogenous nutrients) and negative energy balance (mobilization of endogenous fuels) as perceived by the brain. Positive energy balance is characterized by rising plasma concentrations of triglyceride, glucose and amino acids, falling levels of free fatty acids (FFA), high insulin levels, low ghrelin levels, and high levels of PYY. Conversely, a state of negative energy balance is characterized by rising levels of FFA, low levels of insulin, high levels of glucagon and rising levels of ghrelin to name just a few parameters. The GI tract, liver, skeletal muscle and adipose tissue work coordinately to assimilate ingested nutrients during periods of positive energy balance and liberate stored nutrients during periods of negative energy balance. It seems likely that the key role of the brain in maintaining energy balance is to anticipate this transition and make decisions about ingestive behavior that are appropriate for nutrient availability and the projected energy needs of the body. The term ‘trafficking’ best describes the distribution and redistribution of ingested nutrients between tissues over time. It may be that differences in the trafficking of dietary nutrients especially fat may promote or protect against weight gain by altering the fidelity of nutrient sensing.
Differences between carbohydrate, protein and fat
A central challenge in regulating energy balance is the determination of the relative amount of ingested nutrient as compared to the size of the stored nutrient pools. The pool sizes of stored nutrients are quite different for carbohydrate, protein and fat. These differences likely have implications for the regulation of nutrient balance with these three nutrient classes. For dietary carbohydrate a typical level of daily intake is 150 to 300 grams while whole body glycogen stores are only 400–800 grams, much of which is in muscle and not directly available to the circulation as glucose. The plasma compartment of glucose is quite small roughly only 5 grams. This means that the amount of carbohydrate in each meal is large relative to the plasma compartment and the daily intake is only a bit smaller than the total body storage capacity. The implication of these numbers is that carbohydrate trafficking/balance needs to be closely regulated.
Protein ingestion on a daily basis is roughly 60–100 grams, somewhat less than carbohydrate. There is no ‘storage’ pool of protein in the body whose only purpose is to be available in periods of negative energy balance. Proteins play critical roles in virtually all body functions as enzymes, immunoglobulins, hormones and structural components of all cells. The daily turnover of protein within the body is quite high being 3–400 grams per day. In addition, the need to move nitrogen between tissues and remove it from the body when amino acids are used as gluconeogenic precursors creates special issues for monitoring and maintaining protein balance. The implication of these special features of amino acid metabolism is that protein balance is also tightly regulated.
One challenge with sensing energy from dietary fat is that the energy density of fat (9 kcal/gram) is much greater than carbohydrate or protein and as a result a good deal of energy can be ingested with a relatively small mass of the nutrient. Daily fat intake might range from 60–90 grams, smaller than either carbohydrate or protein intake. The plasma compartment of triglyceride is also quite small being 5–10 grams in a normal individual, and unlike dietary carbohydrate, dietary fat is slowly absorbed and the post meal excursion of triglyceride through the plasma compartment per hour is less than that for carbohydrate. Most importantly however, is the large capacity of adipose tissue for storing triglyceride. A 70 kilogram individual with 25% body fat has 17.5 kilograms of lipids stored as triglyceride in adipose tissue. This represents over 150,000 calories of stored energy. Flatt has suggested that the intake of dietary fat is poorly regulated because of the ratio of dietary fat ingested daily over the stored lipid pool in the body (16). The ratio of carbohydrate ingested daily compared to the body stores is roughly 0.25. The ratio of fat ingested daily compared to the body stores is close to 0.005, almost 50 times smaller. Put another way, dietary carbohydrate ingested at a meal has the potential to make a substantial change in body carbohydrate content. This change can generate a strong regulatory signal such as a rise in insulin and a fall in glucagon for example. In contrast, the amount of fat ingested per day is quite small relative to the stored pool of lipid in the body. As a result one might think that dietary fat would not generate much of a signal following ingestion because the change in total body lipid content produced by the fat contained in a meal is quite small.
This is a compelling argument. However, it raises questions as to how any organism would be able to regulate fat balance in the face of a high fat, highly palatable diet. One might think that all animals would gain weight on a high fat diet (HFD). Yet this is clearly not the case. Some rodents and humans maintain a very stable body weight in the face of wide changes in diet composition including the introduction of a HFD. How do these individuals accomplish this task? Are there lessons to be learned from these individuals that would have relevance to the treatment of obese individuals who seem to have an inadequate ability to sense positive energy/fat balance? A central hypothesis of the work our group has been doing for the last several years is that a greater delivery of dietary fat to liver and skeletal muscle will facilitate more robust sensing of dietary fat because of the greater ratio of ingested nutrient to stored pool size in these tissues. Conversely animals that tend to deliver dietary fat to adipose tissue may not sense fat balance very well and be predisposed to positive fat balance. These differences in the trafficking of dietary fat between tissues may explain why lower levels of fat oxidation have been associated with a propensity for weight gain.
Fat “Partitioning” and Obesity
A large number of studies have examined the relationship between fat oxidation and the development and maintenance of obesity. The central idea is that if fat oxidation is reduced, then dietary fat tends to be stored promoting weight gain and obesity. This idea was first suggested by Greenwood who hypothesized that the lipolytic enzyme lipoprotein lipase (LPL) expressed by adipose tissue and skeletal muscle and functioning locally to facilitate triglyceride uptake, plays a central role (23). The idea was that triglyceride derived fatty acids are “partitioned” to either storage in adipose tissue or oxidation in muscle. Our group measured LPL in adipose tissue and cardiac muscle obtained from lean, obese and weight reduced Zucker rats. These measurements supported Greenwood’s hypothesis (3). However, we wondered if the disposition of dietary fat actually followed what would be predicted from the observed changes in LPL levels in adipose tissue and muscle. To test this idea we used a 14C labeled fat tracer placed in a test meal to follow the metabolic fate of dietary fat in lean and obese male Zucker rats, and a group of obese Zucker rats placed on a hypocaloric diet designed to produce and maintain a significant weight loss (4). The test meal in this study was a small piece of bread that had 100 μl of olive oil containing 10 μCi of 1-14C oleate on it that was spontaneously consumed by previously fasted rats. The oxidation (figure 1) of the dietary fat tracer was then followed over the 6 hours following the test meal. The lean rats oxidized significantly more of the dietary fat tracer than the obese who oxidized more than the reduced obese (p<0.001). However, there was late appearance of the tracer in CO2 in the obese and moreso the reduced obese groups. Where was this tracer coming from? The tissue uptake by adipose tissue was greater in obese than lean with tracer accumulating between 2 and 6 hours following the meal. However, in the reduced obese group tracer did not accumulate between 2 and 6 hours consistent with the idea that following initial uptake, meal fat quickly was released through the process of lipolysis to be oxidized and appear in CO2 at the later time points. Measures of tracer content in skeletal muscle were consistent with this idea as well. These results suggested that dietary fat is not “partitioned” between oxidation or storage, but rather moves between tissues over time in a manner that is associated with the weight phenotype of the animal.
Figure 1.
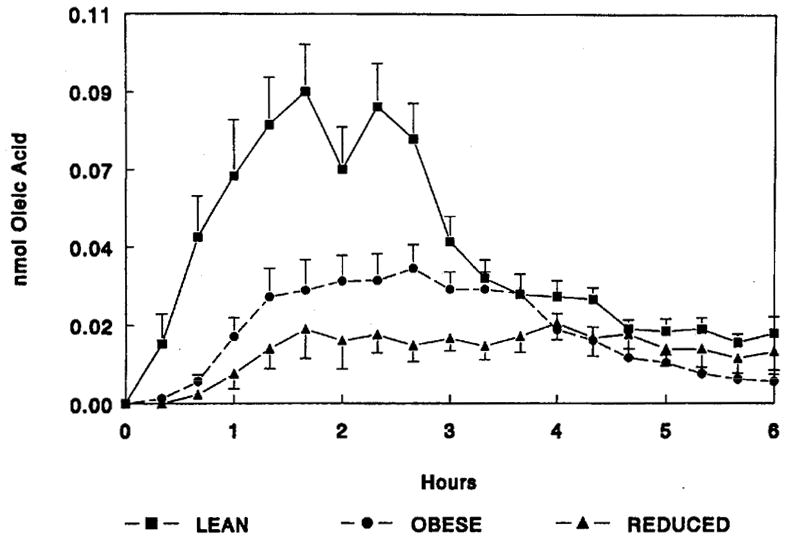
Oxidation of Dietary Fat in Lean, Obese and Reduced Obese Zucker Rats. The oxidation of an oleic acid tracer placed in a test meal over the 6 hours following the meal was determined from the appearance of 14CO2 (previously published in ref. 4).
A number of others have also found evidence of a reduction in fat oxidation of in obese rodents and humans. Most previous studies in human stubjects have used indirect calorimetry to measure fat oxidation. This method cannot identify the source of the fat being oxidized. There are 3 potential sources of lipid that could be oxidized by liver and muscle. These include free fatty acids (FFA) released principally by adipose tissue through lipolysis, circulating triglyceride fatty acids (TGFA), and intracellular or intramuscular triglyceride (IMTG). In obese subjects, a few studies have used tracers to examine the oxidation of specific types of fat and even fewer studies have used tracers to examine details of fat metabolism in reduced obese subjects. Studies in rodent models of obesity have consistently shown a defect in dietary fat (TGFA) oxidation in pre-obese rats (28; 31; 32). A number of investigators have performed dietary fat tracer studies in humans (25; 27; 51; 52; 55–58). However, few studies in humans have examined dietary fat oxidation in obesity (30; 53). Rather, studies in human subjects that have used metabolic tracers have typically examined FFA turnover and oxidation. These studies in general suggest that FFA release is greater in obese than lean but FFA availability declines with weight loss. FFA and TGFA typically represent very different metabolic states. FFA are high and TGFA low in a fasting state while TGFA predominate during the day following food intake. The most difficult fat fuel source to study using tracers has been the IMTG pool (24) and little is known about the relative contribution of this fat source to net fat oxidation.
There is a growing consensus that a defect in fat oxidation is present in obese adults that are predisposed to the development of obesity (48; 59) and that this reduction in fat oxidation may be worse following weight loss predisposing to weight regain (1; 49). Many investigators now suggest that this is due to an oxidative defect at the level of mitochondria (40–42; 50). However, not all studies show a reduction in fat oxidation in obese subjects as compared to lean controls, some even show an increase in fat oxidation in obese subjects compared to lean perhaps due to the increased availability of FFA (7; 22). Some studies that have found a defect in fat oxidation have found mitochondrial function and fatty acid binding proteins to be normal in obese as compared to lean (2; 26; 43). These studies have begun to suggest that it is the changes in the fuel environment of skeletal muscle in the setting of obesity and insulin resistance (increased FFA delivery, increased intracellular lipid, increased malonyl Co-A) that produces a functional defect in fat oxidation, not an intrinsic defect. Perhaps more importantly, a reduction in fat oxidation will not cause weight gain if fat intake is appropriate for that level of oxidation. The real importance of the observed differences in fat trafficking in obesity may relate to what they say about nutrient sensing; specifically the sensing of fat balance.
Fat Trafficking in Lean Rats
What then is the time course of dietary fat trafficking in normal lean rats? Our group addressed this question using a design similar to that used in obese rats. Previously fasted Sprague Dawley rats were fed a test meal containing 14C oleate and the tissue distribution to the GI tract, serum, liver, skeletal muscle and adipose tissue were followed over the subsequent 30 days (5). Figure 2 depicts the results of this study. There are several striking findings. First, the tracer content within the GI tract is greater than any other tissue until almost 24 hours after the meal. This highlights how slow the GI absorption of fat is as compared to dietary carbohydrate. Second, over the first 24 hours, liver and skeletal muscle contain more tracer than adipose tissue. This suggests that in fasted lean male rats, oxidation in metabolically active tissues not storage is the predominate site of disposition for dietary fat. These studies reinforced the idea that differences in dietary fat trafficking were associated with different weight phenotypes, and that the delivery of dietary fat to liver and skeletal muscle was associated with resistance to obesity.
Figure 2.
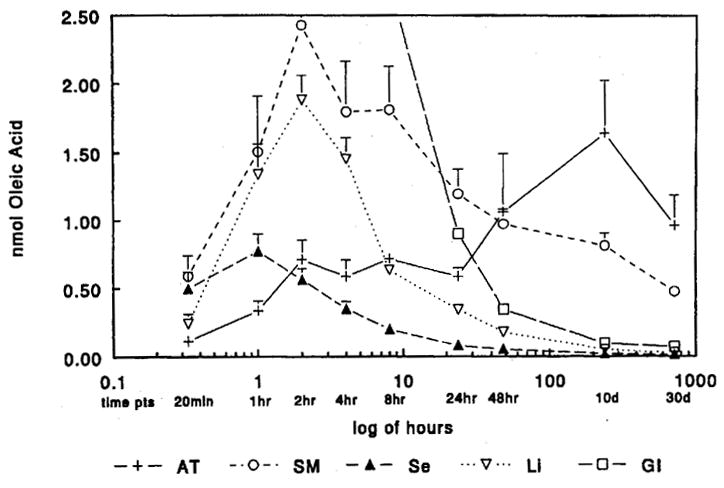
Tissue distribution of a dietary fat tracer in Adipose Tissue (AT), Skeletal Muscle (SM), Serum (Se), Liver (Li) and Gastrointestinal tract (GI) in previously fasted lean male Sprague Dawley rats. A test meal containing 14C oleate was administered at time 0 and the metabolic fate followed over 30 days. Each point represents data from 4–6 rats (previously published in ref. 5).
Subsequent studies examined the effect of nutritional state and fat type on the trafficking of dietary fat (6). Figure 3 depicts the tissue distribution over time of an oleate tracer in rats that were either previously fasted or previously fed. As had been seen previously, liver and muscle were the predominant sites of dietary fat clearance in the hours immediately following the test meal if rats were in the fasted state. However, if rats were previously fed, adipose tissue became the predominant site of clearance. This result emphasizes the importance of feeding and fasting in the trafficking of a dietary fat tracer. In addition the type of fat ingested has a significant impact on the tissue distribution and oxidation. Figure 4 depicts the oxidation of dietary stearic, linolenic and oleic acid tracers administered as part of test meals to rats in either the fasted or fed states. The results demonstrate that saturated fat is oxidized to a significantly lesser degree than unsaturated fat. Tissue tracer content data suggest that this is due to longer retention of the saturated fat tracer in metabolically active tissues. These results are consistent with other studies that show greater oxidation of fats that are of shorter chain length, and more highly unsaturated (15; 39). In summary, studies in lean and obese rats support the notion that obesity is associated with greater trafficking of dietary fat to storage in adipose tissue, while thinness is associated with greater oxidation of dietary fat. One concern though is with the use of different strains of rats to test this idea and the fact that obese rats were already obese at the time that studies were done making it difficult to establish cause and effect. Subsequent studies attempted to address these shortcomings.
Figure 3.
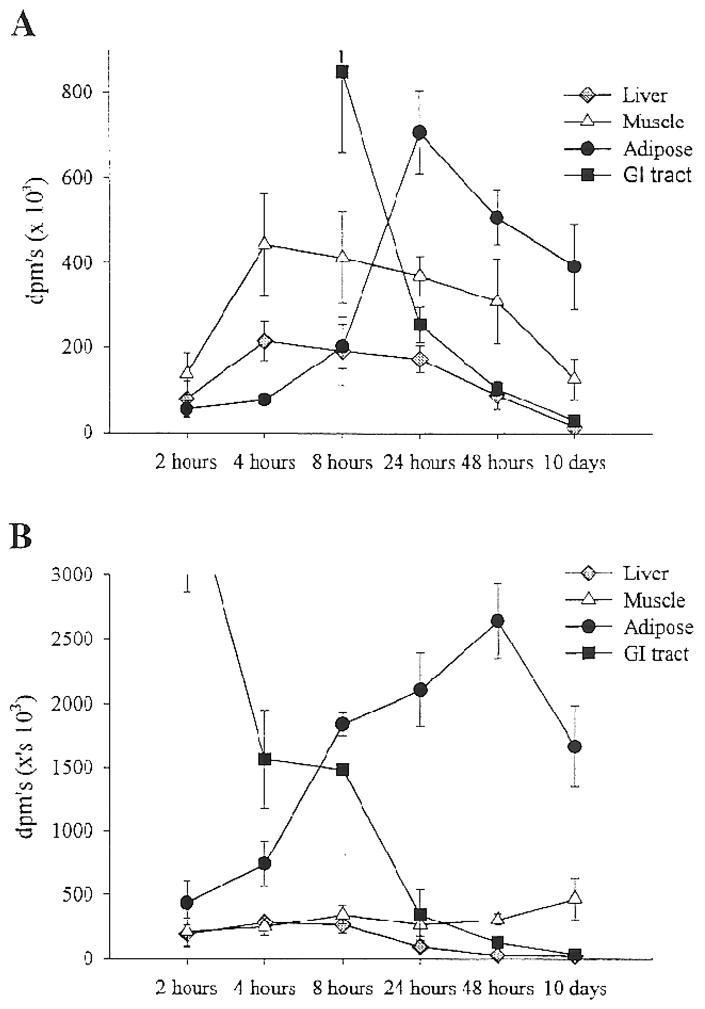
The tissue distribution of a dietary oleate tracer in the 10 days following the administration of a test meal in either the fasted (panel A) or previously fed (panel B) states (previously published in ref. 6).
Figure 4.
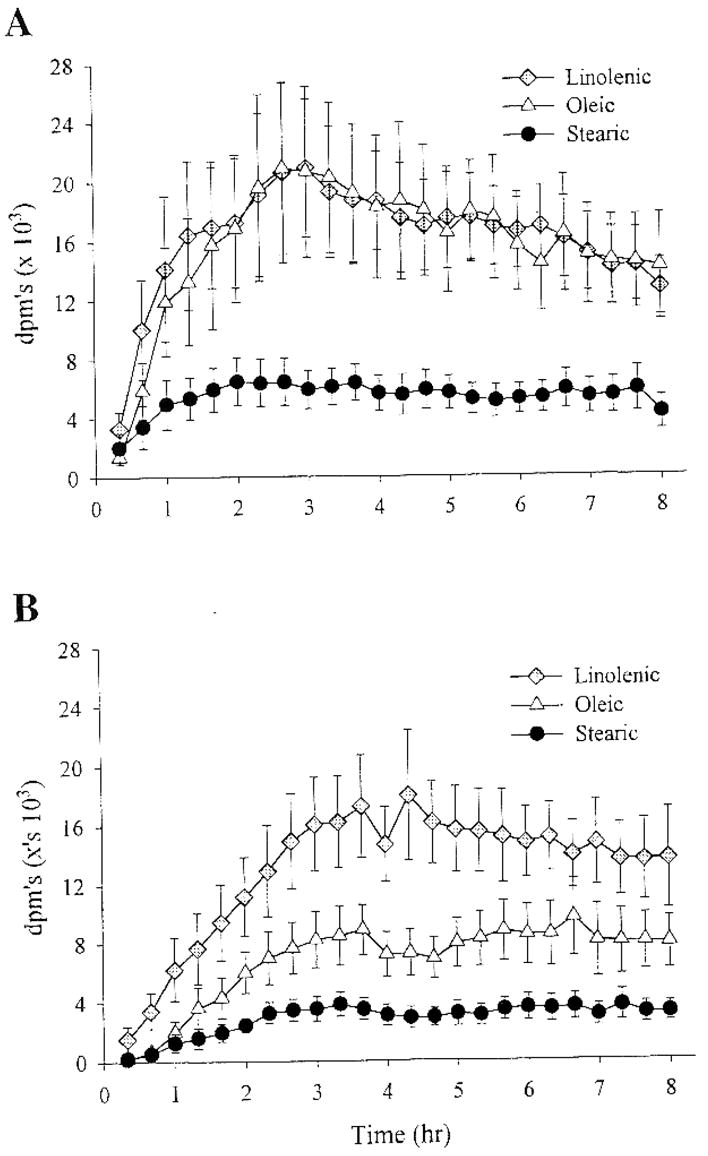
The oxidation of dietary Linolenic, Oleic and Stearic acid tracers placed in a test meal administered to male Sprague Dawley rats that were previously either fasted (panel A) or Fed (panel B) (previously published in ref. 6).
Obesity Prone vs. Obesity Resistant Rats
One of the key experimental design issues in an animal study of weight regulation is the model used. There are a large number of animal models that have been used for studies of the factors that promote obesity. In general, less attention has been paid to models of thinness or obesity resistance. Even within a single strain of rodents that are genetically homogeneous individual animals have a greater or lesser propensity to gain weight when placed on a HFD. This variability in response has been used by a number of investigators to explore factors that predispose to or protect against weight gain (10; 11; 20; 46; 47). One problem with this approach however is that the investigator does not know with a high degree of certainty which animals are likely to gain weight or not prior to the introduction of the HFD. Some investigators have tried to determine factors that improve the ability to predict the phenotype however, these approaches have not been widely used (32).
Another approach is to selectively breed rats based on their weight change following the introduction of a HFD. This was done by Levin and Keesey (37). They selected rats that gained the most weight after be placed on HFD and bred them together and in another group, selected animals with the least weight gain on a HFD. After several generations of applying this selective breeding strategy, they had 2 groups of rats; one that was resistant to weight gain on a HFD (obesity resistant or OR), and another that was prone to weight gain on a HFD (obesity prone or OP). The advantage of this model is that an animal’s likely weight response to a HFD is known prior to the introduction of the HFD. On a high carbohydrate diet (HCD) OP and OR rats have a similar phenotype, yet their weights diverge following the introduction of an HFD. This model allows an examination of the early adaptive responses that occur following the introduction of a HFD. Levin has conducted a wide range of studies characterizing this model (34–36; 38).
Our group has examined a number of early responses that occur in these OP and OR rats following the introduction of a HFD including changes in energy intake, energy expenditure and dietary fat oxidation. Energy intake is similar in OP and OR rats consuming a HCD. On the first day following the introduction of a HFD, all rats overeat substantially. However, over the next 4 days, OR rats gradually reduce their food intake while OP rats continue to overconsume and progressively gain weight. The trafficking of a dietary fat tracer was examined in male and female OP and OR rats before and 5 days after the introduction of the HFD (29). The oxidation of the dietary fat tracer in these groups before and after the introduction of a HFD is depicted in figure 5. Female rats of each phenotype oxidized significantly more of the dietary fat tracer than their male counterparts on both diets (p<0.001). OR rats of each sex oxidized significantly more of the tracer than did OP rats following the introduction of the HFD (p<0.03). Tissue tracer content suggested that this was due to increased delivery of dietary fat to skeletal muscle and liver in OR rats. This pattern was not seen when rats were consuming a HCD. The principal effect of the HFD was to reduce the oxidation of the dietary fat tracer in OP rats. These results suggested that the OR phenotype was characterized by the recruitment of comprehensive adaptive responses to the introduction of a HFD; responses that promoted weight maintenance. In particular, OR rats responded to a brief period of HFD overfeeding by reducing food intake and maintaining fat oxidation. Together these responses were associated with minimal increases in fat mass. The results suggested that the OR phenotype was associated with more accurate nutrient sensing and that this characteristic was associated with greater delivery of a dietary fat tracer to metabolically active tissues such as liver and muscle.
Figure 5.
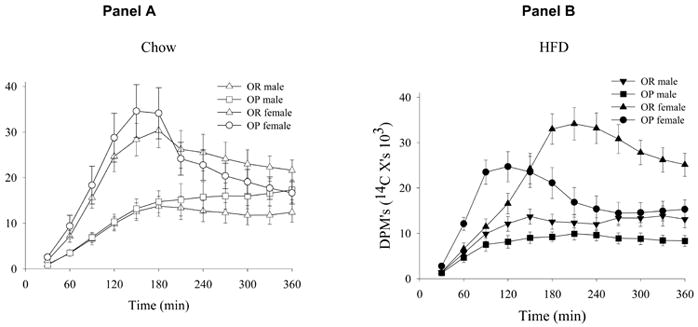
The oxidation of a dietary fat tracer in male and female Obesity Prone (OP) and Obesity Resistant (OR) rats consuming a high carbohydrate Chow diet (panel A) and 5 days after the introduction of a high fat diet (HFD) (panel B) (previously published in ref. 29)
Obesity Prone and Obesity Resistant Humans
Our group then wondered if these findings in OP and OR rats were relevant to body weight regulation in humans. Would OP and OR humans respond differently to a brief period of overfeeding in a manner that would either promote or protect against weight gain? How might ‘OR’ humans be defined? A number of terms have been suggested for this OR phenotype in humans. Some have use have used the term “lean”. However, this implies some knowledge of body composition which is often unavailable in epidemiological studies. Others have used the term “thinness”, a term favored by epidemiologists (9). Some have used the term “constitutional thinness” to describe individuals who are thin through no conscious action on their part (8; 21; 54). This is in distinction to individuals with eating disorders such as anorexia nervosa or those individuals whose weight is reduced due to a chronic illness. Individuals with constitutional thinness often self-describe difficulty gaining weight. Some of these individuals actually wish to weigh more than they do, and others say that they have tried to gained weight in the past but have been unable to do so. A number of human studies have examined the genetics of thinness (9). These studies have reached the conclusion that in a modern environment, thinness is at least as genetically determined as is obesity. Our group wondered if studies of constitutionally thin individuals who came from thin families might shed light on the differences in body weight regulation in these individuals as compared to those individuals who come from families where obesity is a problem.
But what criteria should be used to select OR as oppose to OP individuals? Our group has selected OR subjects as those with a BMI of 19–23 kg/m2, no first degree relative with a BMI>30, no history of dieting and self reported resistance to weight gain. A number of approaches have been used to identifying OP subjects. The initial approach was to select reduced obese individuals as a model of obesity proneness. While these individuals have a high likelihood of gaining weight over the next 6–12 months, the biology of the reduced obese individual may be different than that of a pre-obese individual. Reduced obese individuals likely had an expansion of their fat cell mass prior to losing weight making the physiology of the adipose organ different as compared to a pre-obese person. However, given these limitations this was the group that was initially chosen.
Our group measured effects of short-term overfeeding on insulin action (12), self reported hunger, satiety and subsequent food intake in OP and OR subjects defined in this manner (13). The OP subjects had a BMI of 30–35 kg/m2, were reduced by 8–10% of their initial body weight and maintained in a weight-stable state for at least 1 month. Studies were performed to measure insulin action following 3 days of a controlled eucaloric diet and again following 3 days of overfeeding by 50% above basal energy needs. Appetite and satiety were measured in these same subjects with VASs before and after each meal. Data on hunger and satiety are shown in figure 6. Overfeeding resulted in a significant reduction in pre-meal hunger as measured by visual analogue scores (VAS) in OR individuals (68±6 to 41±6 mm, p<0.0001) but not in OP (63±7 to 65±7 mm, p=0.67). Overfeeding also resulted in a significantly greater increase (p=0.0016) in post-meal satiety scores in OR (65±4 to 88±4 mm, p<0.0001) compared to OP subjects (72±5 to 80±5 mm, p=0.04).
Figure 6.
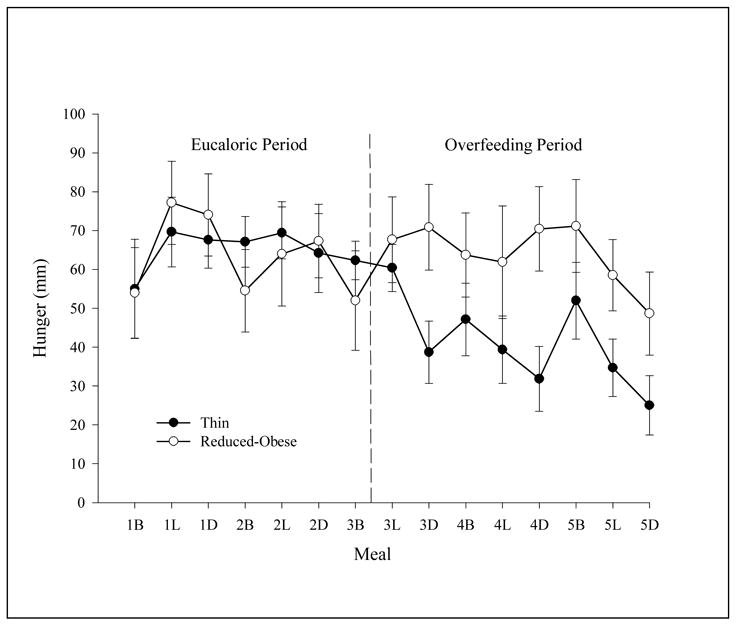
The effects of overfeeding on hunger as measured with visual analogue scores (VAS) in thin (OR) subjects and reduced obese (OP) subjects. Hunger was measured with VAS on a PDA before Breakfast (B), Lunch (L) and Dinner (D) during a 3 day baseline eucaloric period and for 3 days during which subjects were overfed 50% above basal energy needs (previously published in ref. 13)
We followed subject weights over a mean follow up of 14 months. Mean weight gain in OR individuals was 0.68±0.80 kg as compared to 4.48±2.85 kg in OP individuals, although the difference was not significant given the small numbers and large range of weight change. Changes in pre-meal hunger following overfeeding were inversely associated with prospectively determined weight gain (r = −0.58, p<0.05). Insulin and leptin concentrations increased by 13% and 22% respectively with overfeeding in thin individuals, while these levels remained unchanged following overfeeding in the reduced obese individuals.
To begin to examine the mechanisms underlying these significant differences in behavioral responses to overfeeding between thin and reduced obese subjects, we have done studies examining regional brain activation by functional magnetic resonance imaging (fMRI) in response to food related stimuli in these same groups (14). For these studies, subjects were examined on two occasions, once in a eucaloric condition and once following 2 days of overfeeding at 30% above basal energy in a randomized cross-over design. fMRI measurements were performed after an overnight fast using a GE 3.0 T MR system equipped with high speed gradients (300μs rise time and maximum gradient strength 24mT/m) and echoplanar (EPI) capability. Anatomical imaging was first performed. fMRI data was then acquired using EPI T2* BOLD (Blood Oxygen Level Dependent) contrast technique. Functional imaging was performed while the subjects were presented visual stimuli using a projector and screen system. Visual stimuli consisted of three different categories: neutral control objects (O), foods of high hedonic value (H), and foods of neutral hedonic or utilitarian value (U).
Regional brain activation in thin (OR) subjects who were in energy balance and shown images of foods with high hedonic value as compared to foods of lower hedonic value are shown in figure 7. In figure 8 the results of the same stimuli are shown for the same subjects following the 2 days of overfeeding. Images of foods of neutral hedonic value or utilitarian foods as compared to neutral nonfood objects (EU, U > O) resulted in modest activation of left insula and left dorsolateral prefrontal cortex. When visual stimuli of foods of high hedonic value were compared to utilitarian foods (EU, H > U) however, dramatic differences in neuronal activation were seen as shown. Robust activation of bilateral inferior temporal visual cortices, right posterior parietal cortex, and premotor cortex was observed, as well as activation of the left hippocampus. In addition, there was significant activation of the hypothalamus in response to the images of foods with high hedonic value. Overfeeding significantly attenuated the regional neuronal activation that had been seen in these brain regions in the eucaloric state. In particular, overfeeding was associated with a significant reduction in hypothalamic activity (EU > OF, H > U). The robust visual/attention response to the hedonic food stimuli was also diminished with overfeeding. In preliminary results from similar studies performed in reduced obese subjects, similar brain regions were activated by food images with high hedonic value, but overfeeding failed to attenuate the activation seen in these areas. These findings emphasize the important role of external visual cues in the regulation of energy intake and suggest that there is an interaction between external visual sensory inputs, energy balance status, and brain regions important in the homeostatic regulation of energy intake.
Figure 7.
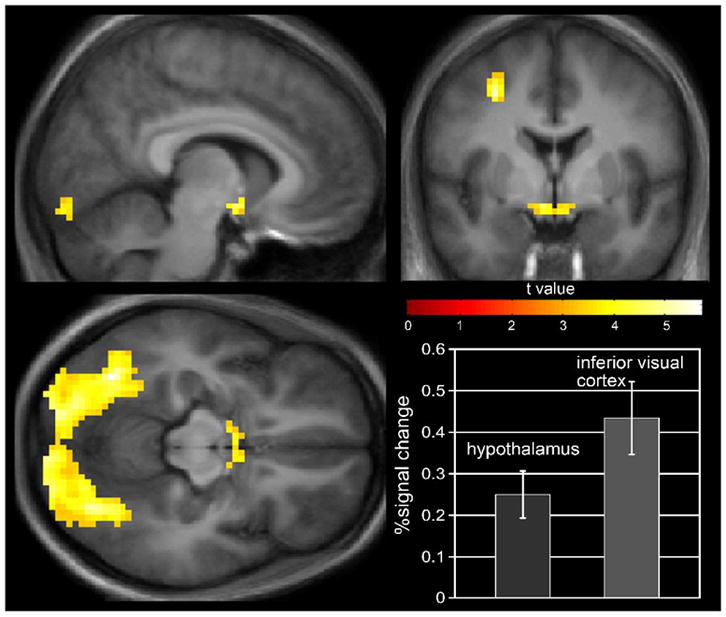
Regional brain activation by fMRI in response to visual food stimuli of high hedonic value in thin (OR) subjects consuming a eucaloric diet. The results demonstrate significant activation of the inferior visual cortex, and hypothalamus.
Figure 8.
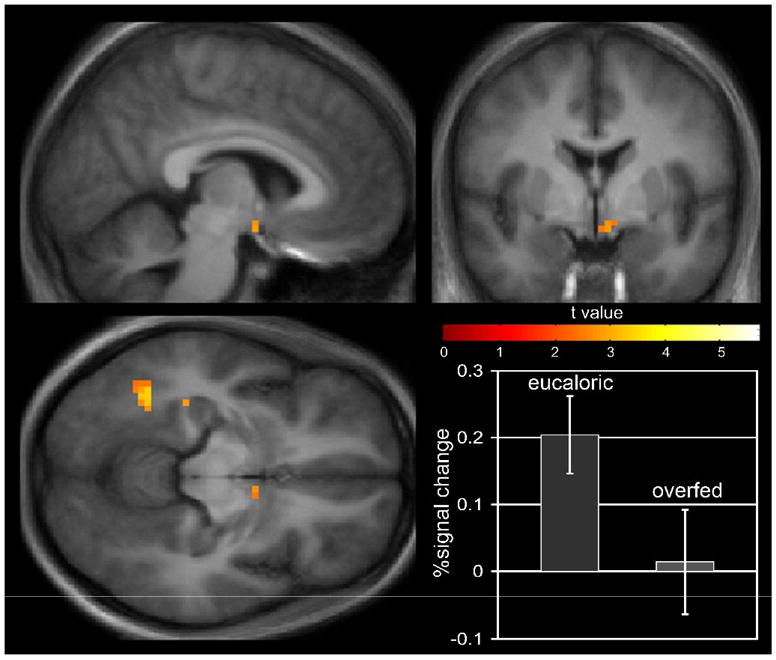
Regional brain activation by fMRI in response to visual food stimuli of high hedonic value in thin (OR) subjects following 2 days of overfeeding at 30% above basal energy requirements. The results demonstrate a marked attenuation of the stimulation seen in a eucaloric state (these results were previously published in ref. 14).
In summary, thin individuals, who are screened to be resistant to obesity appear to sense positive energy balance appropriately as evidenced by changes in hunger and satiation along with reductions in subsequent energy intake following short term overfeeding. On the other hand, individuals at high risk for weight gain (reduced-obese) do not seem to sense the excess calories associated with overfeeding appropriately.
Studies of Physiological Factors Involved in Weight Gain in Human Subjects
More recently, we began a longitudinal prospective cohort study examining the relationship between responses to short term overfeeding and subsequent weight gain. The cohort consists of “OR” subjects defined as described above and “OP” subjects who have a BMI of 23–27 and at least one first degree relative with a BMI>30 kg/m2. Half of the subjects are women, half are men and all were 25–35 years of age when initially enrolled. A large number of variables were examined in a total of 58 subjects including the oxidation of a dietary fat tracer in a test meal, the post meal excursion of a number of relevant hormones and metabolites including triglyceride, FFA, insulin, ghrelin, PYY and leptin. Energy expenditure was measured in a whole room calorimeter, hunger and satiety were estimated with VAS and physical activity was directly measured. Most relevant for this discussion is the data on the oxidation of dietary fat ingested during a test meal. In these studies, subjects were fed a controlled diet for three days prior to a three day dietary intervention consisting of either a eucaloric diet or overfeeding at 40% above basal energy. All food consumed by subjects during these periods was prepared by the metabolic kitchen of the general clinical research center (GCRC). On the third day of the experimental diet, subjects were admitted to the GCRC in the morning after fasting overnight. They consumed a test meal of defined energy and composition containing 20 μCi of [1-14C] oleic acid. Subjects then entered the whole room calorimeter for 23 hours. During this time total energy expenditure, nutrient oxidation and CO2 production were measured. A number of breath samples were obtained over the 23 hour period for measurement of tracer oxidation. 14CO2 content in breath samples was multiplied by CO2 production rates determined by calorimetry to calculate tracer oxidation. In a preliminary analysis of the first 22 subjects, overfeeding was found to result in a reduction in dietary fat oxidation expressed either as fraction of meal fat or grams of fat. In the male subjects this was largely due to a reduction in dietary fat oxidation in OP subjects. As had been seen in OR rats following the introduction of a HFD, OR male subjects maintained baseline levels of dietary fat oxidation following overfeeding. This group of subjects will be followed for the next several years in an effort to correlate baseline responses to short term overfeeding with directly measured changes in weight. It may be that the ability of some individuals to maintain fat oxidation in the face of overfeeding will correlate with resistance to weight gain over time.
Summary
Despite dramatic advances in our understanding of the neurochemistry that underlies appetitive behavior, the mechanisms by which the body maintains energy balance are not clear. To maintain energy balance, the brain must obtain and respond to information about the distribution and redistribution of dietary nutrients between tissues over time between ingesitve events. This is the process of nutrient trafficking. Among the dietary macronutrients, the metabolism of dietary fat poses special problems for nutrient sensing systems because of its high energy density, relatively slow absorption and small daily flux as compared to the large storage capacity. However, some rodents and humans are able to maintain a stable body weight in the face of dramatic changes in diet composition and following periods of overfeeding that test the fidelity of the systems that control energy balance. It may be that a preferential delivery of dietary fat to metabolically active tissues including liver and skeletal muscle allows more accurate sensing of dietary fat in a manner that promotes more accurate coupling between dietary fat intake and oxidation. Conversely, preferential delivery of dietary fat to adipose tissue may impair nutrient sensing and promote weight gain. Perhaps important lessons can be learned from studies of the adaptive strategies that allow obesity resistant rodents and humans to maintain a stable body weight in the face of environmental challenges that promote weight gain in most.
Acknowledgments
The work described this paper was supported in part by the following grants from the National Institutes of Health: DK02935, DK62874 and DK47311.
Footnotes
Publisher's Disclaimer: This is a PDF file of an unedited manuscript that has been accepted for publication. As a service to our customers we are providing this early version of the manuscript. The manuscript will undergo copyediting, typesetting, and review of the resulting proof before it is published in its final citable form. Please note that during the production process errors may be discovered which could affect the content, and all legal disclaimers that apply to the journal pertain.
Reference List
- 1.Astrup A, Buemann B, Christensen NJ, Toubro S. Failure to increase lipid oxidation in response to increasing dietary fat content in formerly obese women. Am J Physiol. 1994;266:E592–E599. doi: 10.1152/ajpendo.1994.266.4.E592. [DOI] [PubMed] [Google Scholar]
- 2.Bandyopadhyay GK, Yu JG, Ofrecio J, Olefsky JM. Increased malonyl-CoA levels in muscle from obese and type 2 diabetic subjects lead to decreased fatty acid oxidation and increased lipogenesis; thiazolidinedione treatment reverses these defects. Diabetes. 2006;55:2277–2285. doi: 10.2337/db06-0062. [DOI] [PubMed] [Google Scholar]
- 3.Bessesen DH, Robertson AD, Eckel RH. Weight reduction increases adipose but decreases cardiac LPL in reduced-obese Zucker rats. Am J Physiol. 1991;261:E246–E251. doi: 10.1152/ajpendo.1991.261.2.E246. [DOI] [PubMed] [Google Scholar]
- 4.Bessesen DH, Rupp CL, Eckel RH. Dietary fat is shunted away from oxidation, toward storage in obese Zucker rats. Obes Res. 1995;3:179–189. doi: 10.1002/j.1550-8528.1995.tb00134.x. [DOI] [PubMed] [Google Scholar]
- 5.Bessesen DH, Rupp CL, Eckel RH. Trafficking of dietary fat in lean rats. Obes Res. 1995;3:191–203. doi: 10.1002/j.1550-8528.1995.tb00135.x. [DOI] [PubMed] [Google Scholar]
- 6.Bessesen DH, Vensor SH, Jackman MR. Trafficking of dietary oleic, linolenic, and stearic acids in fasted or fed lean rats. Am J Physiol Endocrinol Metab. 2000;278:E1124–E1132. doi: 10.1152/ajpendo.2000.278.6.E1124. [DOI] [PubMed] [Google Scholar]
- 7.Blaak EE, Hul G, Verdich C, Stich V, Martinez A, Petersen M, Feskens EF, Patel K, Oppert JM, Barbe P, Toubro S, Anderson I, Polak J, Astrup A, Macdonald IA, Langin D, Holst C, Sorensen TI, Saris WH. Fat oxidation before and after a high fat load in the obese insulin-resistant state. J Clin Endocrinol Metab. 2006;91:1462–1469. doi: 10.1210/jc.2005-1598. [DOI] [PubMed] [Google Scholar]
- 8.Bossu C, Galusca B, Normand S, Germain N, Collet P, Frere D, Lang F, Laville M, Estour B. Energy expenditure adjusted for body composition differentiates constitutional thinness from both normal subjects and anorexia nervosa. Am J Physiol Endocrinol Metab. 2007;292:E132–E137. doi: 10.1152/ajpendo.00241.2006. [DOI] [PubMed] [Google Scholar]
- 9.Bulik CM, Allison DB. The genetic epidemiology of thinness. Obes Rev. 2001;2:107–115. doi: 10.1046/j.1467-789x.2001.00030.x. [DOI] [PubMed] [Google Scholar]
- 10.Commerford SR, Pagliassotti MJ, Melby CL, Wei Y, Gayles EC, Hill JO. Fat oxidation, lipolysis, and free fatty acid cycling in obesity-prone and obesity-resistant rats. Am J Physiol Endocrinol Metab. 2000;279:E875–E885. doi: 10.1152/ajpendo.2000.279.4.E875. [DOI] [PubMed] [Google Scholar]
- 11.Commerford SR, Pagliassotti MJ, Melby CL, Wei Y, Hill JO. Inherent capacity for lipogenesis or dietary fat retention is not increased in obesity-prone rats. Am J Physiol Regul Integr Comp Physiol. 2001;280:R1680–R1687. doi: 10.1152/ajpregu.2001.280.6.R1680. [DOI] [PubMed] [Google Scholar]
- 12.Cornier MA, Bergman BC, Bessesen DH. The effects of short-term overfeeding on insulin action in lean and reduced-obese individuals. Metabolism. 2006;55:1207–1214. doi: 10.1016/j.metabol.2006.05.003. [DOI] [PubMed] [Google Scholar]
- 13.Cornier MA, Grunwald GK, Johnson SL, Bessesen DH. Effects of short-term overfeeding on hunger, satiety, and energy intake in thin and reduced-obese individuals. Appetite. 2004;43:253–259. doi: 10.1016/j.appet.2004.06.003. [DOI] [PubMed] [Google Scholar]
- 14.Cornier MA, Von Kaenel SS, Bessesen DH, Tregellas JR. Effects of overfeeding on the neuronal response to visual food cues. Am J Clin Nutr. 2007;86:965–971. doi: 10.1093/ajcn/86.4.965. [DOI] [PubMed] [Google Scholar]
- 15.DeLany JP, Windhauser MM, Champagne CM, Bray GA. Differential oxidation of individual dietary fatty acids in humans. Am J Clin Nutr. 2000;72:905–911. doi: 10.1093/ajcn/72.4.905. [DOI] [PubMed] [Google Scholar]
- 16.Flatt JP. McCollum Award Lecture, 1995: diet, lifestyle, and weight maintenance. Am J Clin Nutr. 1995;62:820–836. doi: 10.1093/ajcn/62.4.820. [DOI] [PubMed] [Google Scholar]
- 17.Flatt JP. What do we most need to learn about food intake regulation? Obes Res. 1998;6:307–310. doi: 10.1002/j.1550-8528.1998.tb00354.x. [DOI] [PubMed] [Google Scholar]
- 18.Friedman MI. Fuel partitioning and food intake. Am J Clin Nutr. 1998;67:513S–518S. doi: 10.1093/ajcn/67.3.513S. [DOI] [PubMed] [Google Scholar]
- 19.Friedman MI. Obesity and the hepatic control of feeding behavior. Drug News Perspect. 2007;20:573–578. doi: 10.1358/dnp.2007.20.9.1162243. [DOI] [PubMed] [Google Scholar]
- 20.Gayles EC, Pagliassotti MJ, Prach PA, Koppenhafer TA, Hill JO. Contribution of energy intake and tissue enzymatic profile to body weight gain in high-fat-fed rats. Am J Physiol. 1997;272:R188–R194. doi: 10.1152/ajpregu.1997.272.1.R188. [DOI] [PubMed] [Google Scholar]
- 21.Germain N, Galusca B, Le Roux CW, Bossu C, Ghatei MA, Lang F, Bloom SR, Estour B. Constitutional thinness and lean anorexia nervosa display opposite concentrations of peptide YY, glucagon-like peptide 1, ghrelin, and leptin. Am J Clin Nutr. 2007;85:967–971. doi: 10.1093/ajcn/85.4.967. [DOI] [PubMed] [Google Scholar]
- 22.Goodpaster BH, Wolfe RR, Kelley DE. Effects of obesity on substrate utilization during exercise. Obes Res. 2002;10:575–584. doi: 10.1038/oby.2002.78. [DOI] [PubMed] [Google Scholar]
- 23.Greenwood MR. The relationship of enzyme activity to feeding behavior in rats: lipoprotein lipase as the metabolic gatekeeper. Int J Obes. 1985;9 Suppl 1:67–70. 67–70. [PubMed] [Google Scholar]
- 24.Guo Z, Jensen MD. Intramuscular fatty acid metabolism evaluated with stable isotopic tracers. J Appl Physiol. 1998;84:1674–1679. doi: 10.1152/jappl.1998.84.5.1674. [DOI] [PubMed] [Google Scholar]
- 25.Higgins JA, Higbee DR, Donahoo WT, Brown IL, Bell ML, Bessesen DH. Resistant starch consumption promotes lipid oxidation. Nutr Metab (Lond) 2004;1:8. doi: 10.1186/1743-7075-1-8. [DOI] [PMC free article] [PubMed] [Google Scholar]
- 26.Holloway GP, Thrush AB, Heigenhauser GJ, Tandon NN, Dyck DJ, Bonen A, Spriet LL. Skeletal muscle mitochondrial FAT/CD36 content and palmitate oxidation are not decreased in obese women. Am J Physiol Endocrinol Metab. 2007;292:E1782–E1789. doi: 10.1152/ajpendo.00639.2006. [DOI] [PubMed] [Google Scholar]
- 27.Horton TJ, Commerford SR, Pagliassotti MJ, Bessesen DH. Postprandial leg uptake of triglyceride is greater in women than in men. Am J Physiol Endocrinol Metab. 2002;283:E1192–E1202. doi: 10.1152/ajpendo.00164.2002. [DOI] [PubMed] [Google Scholar]
- 28.Jackman MR, Kramer RE, MacLean PS, Bessesen DH. Trafficking of dietary fat in obesity-prone and obesity-resistant rats. Am J Physiol Endocrinol Metab. 2006;291:E1083–E1091. doi: 10.1152/ajpendo.00159.2006. [DOI] [PubMed] [Google Scholar]
- 29.Jackman MR, Kramer RE, MacLean PS, Bessesen DH. Trafficking of dietary fat in obesity-prone and obesity-resistant rats. Am J Physiol Endocrinol Metab. 2006;291:E1083–E1091. doi: 10.1152/ajpendo.00159.2006. [DOI] [PubMed] [Google Scholar]
- 30.Jensen MD, Sarr MG, Dumesic DA, Southorn PA, Levine JA. Regional uptake of meal fatty acids in humans. Am J Physiol Endocrinol Metab. 2003;285:E1282–E1288. doi: 10.1152/ajpendo.00220.2003. [DOI] [PubMed] [Google Scholar]
- 31.Ji H, Friedman MI. Reduced capacity for fatty acid oxidation in rats with inherited susceptibility to diet-induced obesity. Metabolism. 2007;56:1124–1130. doi: 10.1016/j.metabol.2007.04.006. [DOI] [PMC free article] [PubMed] [Google Scholar]
- 32.Ji H, Friedman MI. Fasting plasma triglyceride levels and fat oxidation predict dietary obesity in rats. Physiol Behav. 2003;78:767–772. doi: 10.1016/s0031-9384(03)00078-7. [DOI] [PubMed] [Google Scholar]
- 33.Lam TK, Schwartz GJ, Rossetti L. Hypothalamic sensing of fatty acids. Nat Neurosci. 2005;8:579–584. doi: 10.1038/nn1456. [DOI] [PubMed] [Google Scholar]
- 34.Levin BE, Dunn-Meynell AA. Defense of body weight against chronic caloric restriction in obesity-prone and -resistant rats. Am J Physiol Regul Integr Comp Physiol. 2000;278:R231–R237. doi: 10.1152/ajpregu.2000.278.1.R231. [DOI] [PubMed] [Google Scholar]
- 35.Levin BE, Dunn-Meynell AA. Defense of body weight depends on dietary composition and palatability in rats with diet-induced obesity. Am J Physiol Regul Integr Comp Physiol. 2002;282:R46–R54. doi: 10.1152/ajpregu.2002.282.1.R46. [DOI] [PubMed] [Google Scholar]
- 36.Levin BE, Dunn-Meynell AA. Chronic exercise lowers the defended body weight gain and adiposity in diet-induced obese rats. Am J Physiol Regul Integr Comp Physiol. 2004;286:R771–R778. doi: 10.1152/ajpregu.00650.2003. [DOI] [PubMed] [Google Scholar]
- 37.Levin BE, Dunn-Meynell AA, Balkan B, Keesey RE. Selective breeding for diet-induced obesity and resistance in Sprague-Dawley rats. Am J Physiol. 1997;273:R725–R730. doi: 10.1152/ajpregu.1997.273.2.R725. [DOI] [PubMed] [Google Scholar]
- 38.Levin BE, Keesey RE. Defense of differing body weight set points in diet-induced obese and resistant rats. Am J Physiol. 1998;274:R412–R419. doi: 10.1152/ajpregu.1998.274.2.R412. [DOI] [PubMed] [Google Scholar]
- 39.Leyton J, Drury PJ, Crawford MA. Differential oxidation of saturated and unsaturated fatty acids in vivo in the rat. Br J Nutr. 1987;57:383–393. doi: 10.1079/bjn19870046. [DOI] [PubMed] [Google Scholar]
- 40.Lowell BB, Shulman GI. Mitochondrial dysfunction and type 2 diabetes. Science. 2005;307:384–387. doi: 10.1126/science.1104343. [DOI] [PubMed] [Google Scholar]
- 41.Menshikova EV, Ritov VB, Ferrell RE, Azuma K, Goodpaster BH, Kelley DE. Characteristics of skeletal muscle mitochondrial biogenesis induced by moderate-intensity exercise and weight loss in obesity. J Appl Physiol. 2007;103:21–27. doi: 10.1152/japplphysiol.01228.2006. [DOI] [PubMed] [Google Scholar]
- 42.Menshikova EV, Ritov VB, Toledo FG, Ferrell RE, Goodpaster BH, Kelley DE. Effects of weight loss and physical activity on skeletal muscle mitochondrial function in obesity. Am J Physiol Endocrinol Metab. 2005;288:E818–E825. doi: 10.1152/ajpendo.00322.2004. [DOI] [PubMed] [Google Scholar]
- 43.Mogensen M, Sahlin K, Fernstrom M, Glintborg D, Vind BF, Beck-Nielsen H, Hojlund K. Mitochondrial respiration is decreased in skeletal muscle of patients with type 2 diabetes. Diabetes. 2007;56:1592–1599. doi: 10.2337/db06-0981. [DOI] [PubMed] [Google Scholar]
- 44.Obici S, Rossetti L. Minireview: nutrient sensing and the regulation of insulin action and energy balance. Endocrinology. 2003;144:5172–5178. doi: 10.1210/en.2003-0999. [DOI] [PubMed] [Google Scholar]
- 45.Ogden CL, Yanovski SZ, Carroll MD, Flegal KM. The epidemiology of obesity. Gastroenterology. 2007;132:2087–2102. doi: 10.1053/j.gastro.2007.03.052. [DOI] [PubMed] [Google Scholar]
- 46.Pagliassotti MJ, Knobel SM, Shahrokhi KA, Manzo AM, Hill JO. Time course of adaptation to a high-fat diet in obesity-resistant and obesity-prone rats. Am J Physiol. 1994;267:R659–R664. doi: 10.1152/ajpregu.1994.267.3.R659. [DOI] [PubMed] [Google Scholar]
- 47.Pagliassotti MJ, Pan D, Prach P, Koppenhafer T, Storlien L, Hill JO. Tissue oxidative capacity, fuel stores and skeletal muscle fatty acid composition in obesity-prone and obesity-resistant rats. Obes Res. 1995;3:459–464. doi: 10.1002/j.1550-8528.1995.tb00175.x. [DOI] [PubMed] [Google Scholar]
- 48.Raben A, Andersen HB, Christensen NJ, Madsen J, Holst JJ, Astrup A. Evidence for an abnormal postprandial response to a high-fat meal in women predisposed to obesity. Am J Physiol. 1994;267:E549–E559. doi: 10.1152/ajpendo.1994.267.4.E549. [DOI] [PubMed] [Google Scholar]
- 49.Ranneries C, Bulow J, Buemann B, Christensen NJ, Madsen J, Astrup A. Fat metabolism in formerly obese women. Am J Physiol. 1998;274:E155–E161. doi: 10.1152/ajpendo.1998.274.1.E155. [DOI] [PubMed] [Google Scholar]
- 50.Ritov VB, Menshikova EV, He J, Ferrell RE, Goodpaster BH, Kelley DE. Deficiency of subsarcolemmal mitochondria in obesity and type 2 diabetes. Diabetes. 2005;54:8–14. doi: 10.2337/diabetes.54.1.8. [DOI] [PubMed] [Google Scholar]
- 51.Romanski SA, Nelson RM, Jensen MD. Meal fatty acid uptake in adipose tissue: gender effects in nonobese humans. Am J Physiol Endocrinol Metab. 2000;279:E455–E462. doi: 10.1152/ajpendo.2000.279.2.E455. [DOI] [PubMed] [Google Scholar]
- 52.Romanski SA, Nelson RM, Jensen MD. Meal fatty acid uptake in human adipose tissue: technical and experimental design issues. Am J Physiol Endocrinol Metab. 2000;279:E447–E454. doi: 10.1152/ajpendo.2000.279.2.E447. [DOI] [PubMed] [Google Scholar]
- 53.Sonko BJ, Fennessey PV, Donnelly JE, Bessesen D, Sharp TA, Jacobsen DJ, Jones RH, Hill JO. Ingested fat oxidation contributes 8% of 24-h total energy expenditure in moderately obese subjects. J Nutr. 2005;135:2159–2165. doi: 10.1093/jn/135.9.2159. [DOI] [PubMed] [Google Scholar]
- 54.Tounian P, Dumas C, Veinberg F, Girardet JP. Resting energy expenditure and substrate utilisation rate in children with constitutional leanness or obesity. Clin Nutr. 2003;22:353–357. doi: 10.1016/s0261-5614(02)00217-0. [DOI] [PubMed] [Google Scholar]
- 55.Votruba SB, Atkinson RL, Hirvonen MD, Schoeller DA. Prior exercise increases subsequent utilization of dietary fat. Med Sci Sports Exerc. 2002;34:1757–1765. doi: 10.1097/00005768-200211000-00011. [DOI] [PubMed] [Google Scholar]
- 56.Votruba SB, Atkinson RL, Schoeller DA. Prior exercise increases dietary oleate, but not palmitate oxidation. Obes Res. 2003;11:1509–1518. doi: 10.1038/oby.2003.202. [DOI] [PubMed] [Google Scholar]
- 57.Votruba SB, Atkinson RL, Schoeller DA. Sustained increase in dietary oleic acid oxidation following morning exercise. Int J Obes (Lond) 2005;29:100–107. doi: 10.1038/sj.ijo.0802779. [DOI] [PubMed] [Google Scholar]
- 58.Votruba SB, Mattison RS, Dumesic DA, Koutsari C, Jensen MD. Meal Fatty Acid Uptake in Visceral Fat in Women. Diabetes. 2007 doi: 10.2337/db07-0439. [DOI] [PubMed] [Google Scholar]
- 59.Zurlo F, Lillioja S, Esposito-Del PA, Nyomba BL, Raz I, Saad MF, Swinburn BA, Knowler WC, Bogardus C, Ravussin E. Low ratio of fat to carbohydrate oxidation as predictor of weight gain: study of 24-h RQ. Am J Physiol. 1990;259:E650–E657. doi: 10.1152/ajpendo.1990.259.5.E650. [DOI] [PubMed] [Google Scholar]