

Abstract
Orbitofrontal cortex (OFC, Brodmann area 10) gray matter volume reductions and selective reductions in docosahexaenoic acid (DHA, 22:6n-3) are observed in adult patients with major depressive disorder (MDD). OFC gray matter volume also decreases with advancing age in healthy subjects. To examine if OFC gray matter DHA composition decreases during normal aging, we determined age-related changes in OFC gray matter fatty acid composition by gas chromatography in subjects aged 29−80 years (n=30). We additionally determined elongase (HELO1), delta-5 desaturase (FASD1), delta-6 desaturase (FASD2), peroxisomal (PEX19), and stearoyl-CoA desaturase (SCD) mRNA expression in the same tissues. Increasing age was associated with a progressive decline in polyunsaturated fatty acid (PUFA) composition, including DHA and arachidonic acid (AA, 20:4n-6), and transient, apparently compensatory, elevations in elongase and desaturase gene expression. The age-related reduction in PUFA composition was inversely correlated with SCD expression and activity resulting in elevations in monounsaturated fatty acid composition. These dynamic age-related changes in OFC gray matter fatty acid composition and biosynthetic gene expression may contribute to the progressive decline in OFC gray matter volume found with advancing age. The implications of age-related reductions in OFC PUFA composition for affective dysregulation in the elderly are discussed.
Keywords: Aging, orbitofrontal cortex, gray matter, saturated fatty acids, monounsaturated fatty acids, polyunsaturated fatty acids, stearoyl-CoA desaturase (SCD), delta-5 desaturase (FASD1), delta-5 desaturase (FASD2), elongase (HELO1), peroxisome (PEX19)
1. Introduction
Emerging evidence from lesion and imaging studies suggest that the human orbitofrontal cortex (OFC, Brodmann area 10) plays a critical role in both cognitive and affective regulation [1]. Among the different prefrontal cortex subregions, the OFC is particularly vulnerable to age-related reductions in gray matter volume [2-5] and function [6-8] in otherwise healthy subjects. Moreover, reductions in OFC gray matter volume are observed in both young [9,10] and geriatric [11,12] patients with major depressive disorder (MDD) relative to age-matched healthy controls. Although postmortem histological studies suggest that reductions in OFC gray matter volume during normal aging and in MDD are due to neuronal shrinkage rather than neuronal loss [13-15], little is known about the environmental and/or genetic factors that contribute to reductions in OFC gray matter volume and associated affective dysregulation.
Emerging evidence from clinical and preclinical studies suggests that omega-3 polyunsaturated fatty acids (PUFA) play an important role in cortical maturation and function during perinatal development [16]. Dietary-induced deficits in the principal brain omega-3 fatty acid, docosahexaenoic acid (DHA, 22:6n-3), during perinatal development is associated with neuronal shrinkage in the adult rat brain [17], and aged rodents exhibit significant deficits in cortical DHA composition [18-20]. A recent imaging study found that dietary omega-3 fatty acid composition was positively correlated with cortical gray matter volume in healthy adult subjects [21], and we have recently found that adult patients with MDD exhibit significant and selective DHA deficits in the postmortem OFC relative to age-matched controls [22]. Collectively, these data support the hypothesis that the neuronal shrinkage and reductions in gray matter volume observed in the OFC during aging and in MDD may be due in part to reductions in DHA composition.
In the present study, we determined age-related changes in OFC gray matter fatty acid composition by gas chromatography in normal subjects aged 29−80 years (n=30). Our specific prediction was that increasing age would be associated with a progressive decline in DHA composition. Because aged rodents exhibit abnormalities in cortical fatty acid composition despite dietary precursor availability [18-20], we also determined the expression of the principal lipogenic genes that regulate fatty acid biosynthesis in the same tissues by real-time reverse transcriptase polymerase chain reaction (RT-PCR). Principal lipogenic genes include delta-5 desaturase (FASD1)[23], delta-6 desaturase (FASD2)[24], elongase (HELO1 [ELOVL5])[25], the peroxisome assembly gene PEX19 [26], and stearoyl-CoA desaturase (SCD)[27]. It was hypothesized that age-related alterations in fatty acid composition would be associated with parallel changes in lipogenic gene expression. We report that increasing age is associated a progressive decline in PUFA composition, including DHA and arachidonic acid (AA, 20:4n-6), transient, apparently compensatory, elevations in elongase and desaturase gene expression, and associated elevations in SCD expression and activity.
2. Methods and Materials
2.1. Postmortem brain tissue
Frozen, unfixed, postmortem orbitofrontal cortex (Brodmann area 10) gray matter from human subjects aged 29−80 years at time of death was used. Comparison of subject and postmortem tissue variables following stratification into four age subgroups is presented in Table 1. Brain tissue was obtained from the Stanley Research Foundation Neuropathology Consortium and the Harvard Brain Tissue Resource Center. Postmortem human brain tissues were de-identified, and therefore did not require protocol approval by the University of Cincinnati IRB.
Table 1.
Comparison of Subject and Brain Tissue Characteristics
| 29−35 Yrs (n=8) | 41−45 Yrs (n=6) | 52−59 Yrs (n=9) | 65−80 Yrs (n=7) | |
|---|---|---|---|---|
| Patient Characteristics: | ||||
| Age at death, mean ± S.D. (range) | 34.2 ± 2.1 (29−35) | 43.5 ± 1.6 (41−45) | 54.8 ± 2.7 (52−59) | 70.0 ± 6.2 (65−80) |
| Gender | 5M,3F | 5M,1F | 7M,2F | 2M,5F |
| Race1 | 6C,2UN | 3C,1AA,2UN | 7C,2UN | 4C,3UN |
| Cause of death | ||||
| Cardiopulmonary | 6 | 6 | 7 | 3 |
| Accident | 2 | 0 | 1 | 0 |
| Other | 0 | 0 | 1 | 4 |
| Tissue Characteristics: | ||||
| Brain hemisphere | 6L/2R | 3L/3R | 5L/4R | 3L/4R |
| Brain mass (mean grams ± S.D.) | 1433 ± 69 | 1508 ± 118 | 1527 ± 66 | 1226 ± 222 |
| Postmortem interval (mean hours ± S.D.) | 26.8 ± 9.5 | 19.3 ± 7.5 | 23.7 ± 6.2 | 16.1 ± 5.9 |
| Tissue pH (mean ± S.D.) | 6.3 ± 0.3 | 6.5 ± 0.3 | 6.2 ± 0.3 | 6.4 ± 0.2 |
C = Caucasian, AA = African American, UN = Unknown
2.2. Gas chromatography
The gas chromatography (GC) procedure has been described in detail previously [22,28]. Frozen cortical gray matter samples were analyzed with a Shimadzu GC-17A GC (Shimadzu Scientific Instruments Inc., Columbia MD). The column was a DB-23 (123−2332): 30 m (length), I.D. (mm) 0.32 wide bore, film thickness of 0.25 μM (J&W Scientific, Folsom CA). The GC conditions were: column temperature ramping by holding at 120°C for one minute followed by an increase of 5°C/min from 120−240°C. The temperature of the injector and flame ionization detector was 250°C. A split (8:1) injection mode was used. The carrier gas was helium with a column flow rate of 2.5 ml/min. Analysis of fatty acid methyl esters was conducted with Shimadzu Class VP 4.3 software. Fatty acid identification was based on retention times of authenticated fatty acid methyl ester standards (Matreya LLC Inc., Pleasant Gap PA). Fatty acid composition data is expressed as weight percent of total fatty acids (mg fatty acid/100 mg fatty acids). We have previously demonstrated that wt % total data are highly correlated with total mass data (nmol/g)(r=0.995, p≤0.0001)(McNamara et al., 2008). Fatty acid class changes were assessed by summing individual compositions of principal saturated fatty acids (∑14:0, 16:0, 18:0), monounsaturated fatty acids (∑16:1n-7, 18:1n-7, 18:1n-9, 20:1n-9), and polyunsaturated fatty acids (∑18:2n-6, 20:3n-6, 20:4n-6, 22:4n-6, 22:5n-6, 22:6n-3).
2.3. RT-PCR
The real-time reverse transcriptase polymerase chain reaction (RT-PCR) procedure has been described in detail previously [29]. Primers and fluorogenic probes (Midland Certified Reagent Company, Midland, TX) were designed using Primer Express v.2.0 software (Applied Biosystems, Foster City, CA) based on the human mRNA sequence. Primer and probe sequences are presented in Table 2. Each probe was conjugated to a FAM reporter at the 5’ end and a TAMRA quencher at the 3’ end. The reverse primer for probes spanned an exon-intron junction to obviate genomic DNA contamination. Each primer pair yielded a single band on agarose gels for HELO1 (123 bp), FASD1 (80 bp), FASD2 (88 bp), PEX19 (159 bp), and SCD (150 bp). Reverse transcription was performed using the 9600 GeneAmp thermocycler (Perkin-Elmer, Norwalk, CT). The relative quantities for mRNA were normalized to GAPDH mRNA values obtained from the same tissue sample.
Table 2.
RT-PCR Primer and Probe Sequences
| Gene (Accession number) | Primer and Probe Sequences1 | |
|---|---|---|
| HELO1 (NM_021814) | F | 5′-CACACTGCTGTCTCTGTATATGTTCTG-3′ |
| R | 5′-AGGACACGGATAATCTTCATATCTGAT-3′ | |
| P | 5′-TCAGGGCACACGCACCGCAG-3′ | |
| FADS1 (NM_013402) | F | 5′-TCCGCAAAGACCCAGACATC-3′ |
| R | 5′-CTGTTTCCCAAGCTCCACAGA-3′ | |
| P | 5′-TGCATCCCTTCTTCTTTGCCTTGGG-3′ | |
| FADS2 (NM_004265) | F | 5′-TTACAACATCACCAAATGGTCCAT-3′ |
| R | 5′-GAAGGCATCCGTTGCATCTT-3′ | |
| P | 5′-CCAGCGGGTCATCGGGCACTAC-3′ | |
| PEX19 (NM_002857) | F | 5′-GATCACAGAAAAGTATCCAGAATGGTT-3′ |
| R | 5′-CGAGCCTTTTGAGTGGTTTCAC-3′ | |
| P | 5′-CAGTTTGAGGCAGAGACCCCCACAGAC-3′ | |
| SCD (NM_005063) | F | 5′-CATAATTCCCGACGTGGCTTT-3′ |
| R | 5′-AGGTTTGTAGTACCTCCTCTGGAACA-3′ | |
| P | 5′-TTCTTCTCTCACGTGGGTTGGCTGCTT-3′ | |
| GAPDH (NM_002046) | F | 5′-CCACCCATGGCAAATTCC-3′ |
| R | 5′-TGGGATTTCCATTGATGACAAG-3′ | |
| P | 5′-CGTTCTCAGCCTTGACGGTGCCA-3′ |
Forward primer (F), Reverse primer (R), Probe (P)
2.4. Statistical analysis
Parametric linear regression analyses were used to determine the relationship between age at death, fatty acid compositions, and mRNA gene expression. Additionally, subjects were segregated into four age subgroups (29−35 yrs, 41−45 yrs, 52−59 yrs, and 65−80 yrs), and a one-way ANOVA was used to assess subgroup differences in postmortem tissue variables. Pairwise comparisons of continuous variables were performed using unpaired t-tests (2-tailed), and exact p-values reported. All statistical analyses were performed with GB-STAT software (Dynamic Microsystems, Inc., Silver Springs MD).
3. Results
3.1. Postmortem tissue variables
Age at death was not correlated with brain pH (r = +0.01, p=0.921), and a one-way ANOVA found that brain pH did not differ among the four age subgroups, F(3,26)=1.12, p=0.357. Age was inversely correlated with whole brain weight (g) (r = −0.39, p=0.035), and a one-way ANOVA found that brain weight differed among the four age subgroups, F(3,26)=4.97, p=0.007. Brain weight in the 65−80 year subgroup was significantly lower than the 41−45 year (p≤0.05) and 52−59 year (p≤0.01) subgroups. Regression analyses found that brain weight was not significantly correlated with the composition of any fatty acid class (SFA, MUFA, PUFA), individual fatty acid, fatty acid ratio, or mRNA expression level (p≥0.05). Age at death was inversely correlated with postmortem interval (PMI)(r = −0.45, p=0.012), and a one-way ANOVA found that PMI differed among the four age subgroups, F(3,26)=3.01, p=0.048. The 29−35 year age subgroup had a longer PMI relative to the 65−80 year age subgroup (p=0.023). PMI was not significantly correlated with the composition of fatty acid class (SFA, MUFA, PUFA), individual fatty acid, fatty acid ratio, or mRNA expression level (p≥0.05).
3.2. Gender
Neuroimaging studies have found that male and female OFC volumes decline with age at a similar rate [3], and we have found that OFC fatty acid composition does not differ in normal age-matched male and female subjects (McNamara et al., 2007, 2008). Comparison of the fatty acid composition in male (n=19, mean age: 48.3±12.1 S.D.) and female (n=11, mean age: 54.8±16.6 S.D., p=0.226) subjects did not find significant gender differences in ∑SFA composition (p=0.101), ∑MUFA composition (p=0.117), or ∑PUFA composition (p=0.154). Males and females also exhibited similar age-related changes in ∑SFA composition (male: r = −0.46, female: r = −0.35), ∑MUFA composition (male: r = +0.49, female: r = +0.43), and ∑PUFA composition (male: r = −0.46, female: r = −0.38). Similarly, males and females also exhibited comparable age-related changes in oleic acid (18:1n-9)(male: r = +0.49, female: r = +0.38), AA (20:4n-6)(male: r = −0.42, female: r = −0.37), and DHA (22:6n-3) (male: r = −0.33, female: r = −0.41) compositions. There also no gender differences for HELO1 (p=0.678), FASD1 (p=0.308), FASD2 (p=0.854), PEX19 (p=0.298), or SCD (p=0.655) mRNA expression. Genders were therefore combined for subsequent analyses.
3.3. Fatty acid composition
Age-related changes in SFA, MUFA, and PUFA compositions are illustrated in Figure 1A. Age was inversely correlated with ∑SFA composition (r = −0.45, p=0.013) and ∑PUFA composition (r = −0.45, p=0.012), and positively correlated with ∑MUFA composition (r = +0.49, p=0.005). ∑SFA composition declined by 9% (p=0.002), ∑PUFA composition declined by 15% (p=0.005), and ∑MUFA composition increased by 21% (p=0.002) in the oldest (65−80 years) versus the youngest (29−35 years) subgroup. ∑PUFA was positively correlated with ∑SFA (r = +0.96, p≤0.0001), and inversely correlated with ∑MUFA (r = −0.95, p≤0.0001), and ∑SFA and ∑MUFA were inversely correlated (r = −0.95, p≤0.0001). Accordingly, age at death was positively correlated with ∑MUFA:∑SFA (r = +0.47, p=0.009), ∑SFA:∑PUFA (r = +0.39, p=0.031) and ∑MUFA:∑PUFA (r = +0.45, p=0.011) ratios (Fig. 1B). The ∑SFA:∑PUFA ratio (+7%, p=0.02), the ∑MUFA:∑PUFA ratio (+34%, p=0.002), and the ∑MUFA:∑SFA ratio (+29%, p=0.002) increased in the oldest versus the youngest subgroup.
Figure 1.
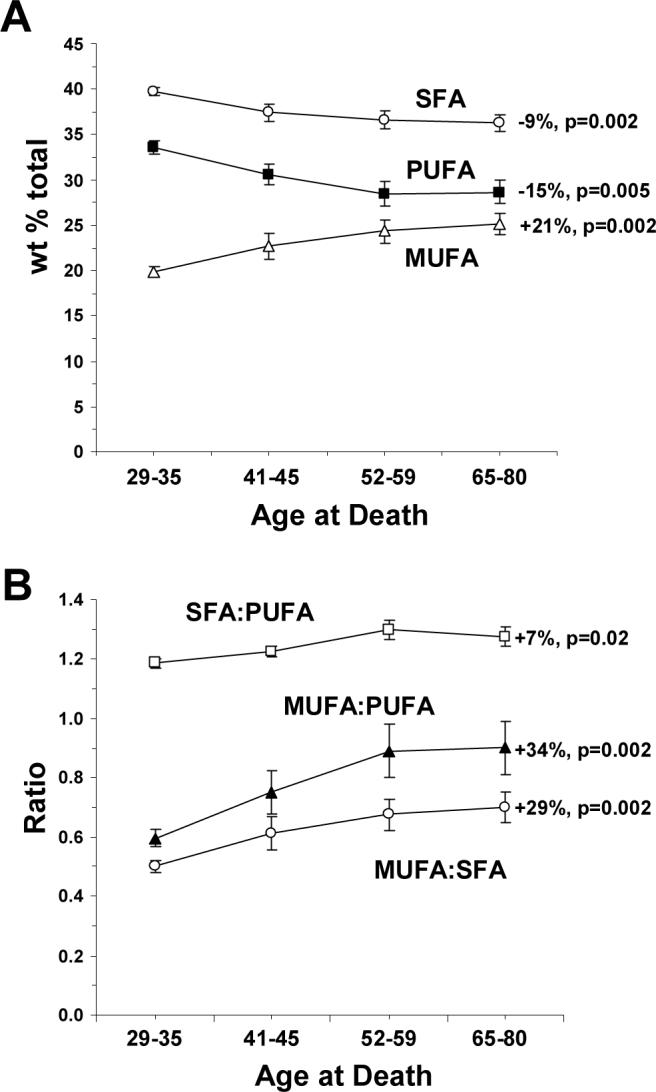
Age-related changes in fatty acid class composition (wt % total) in the four age subgroups (29−35 yrs, 41−45 yrs, 52−59 yrs, and 65−80 yrs): (A) Age-related changes in saturated fatty acid (SFA) composition (∑14:0, 16:0, 18:0), monounsaturated fatty acid (MUFA) composition (∑16:1n-7, 18:1n-7, 18:1n-9, 20:1n-9), and polyunsaturated fatty acid (PUFA) composition (∑18:2n-6, 20:3n-6, 20:4n-6, 22:4n-6, 22:5n-6, 22:6n-3). (B) Age-related changes in the ∑MUFA:∑SFA ratio, the ∑SFA:∑PUFA ratio, and the ∑MUFA:∑PUFA ratio in the four age subgroups. Data are expressed as mean ± S.E.M. Percent change in the oldest versus the youngest subgroup and associated p-values (unpaired t-test, two-tailed) are presented.
Among individual SFAs, age was inversely correlated with stearic acid (18:0) composition (r = −0.74, p≤0.0001) but not myristic acid (14:0)(r = +0.34, p=0.064) or palmitic acid (16:0)(r = −0.29, p=0.117) compositions (Fig. 2A). Palmitic acid (19%, p=0.042) and stearic acid (110%, p=0.001) compositions, but not myristic acid (14:0)(+21%, p=0.129), decreased in the oldest versus youngest subgroups. Among individual MUFAs, age was positively correlated with oleic acid (18:1n-9)(r = +0.47, p=0.008), palmitioleic acid (16:1n-7)(r = +0.57, p=0.0009), cis-vaccenic acid (18:1n-7)(r = +0.52, p=0.003), and eicosenoic acid (20:1n-9)(r = +0.38, p=0.039)(Fig. 2B). Palmitioleic acid (+18%, p=0.021), eicosenoic acid (+47%, p=0.004), cis-vaccenic acid (+19%, p=0.004), and oleic acid (+28%, p=0.004) increased in the oldest versus the youngest subgroup. Age was positively correlated with 18:1/18:0 (r = +0.54, p=0.002) and 16:1/16:0 (r = +0.61, p=0.0003) ratios, and the 18:1/18:0 (+28%, p=0.0007)(Fig. 2C) and 16:1/16:0 (+26%, p=0.004)(Fig. 2E) ratios increased significantly in the oldest versus the youngest subgroup. Age was not significantly correlated with 20:1n-9/18:1n-9 (r = +0.35, p=0.056) or 18:1n-7/16:1n-7 (r = −0.12, p=0.527) ratios, and the 20:1n-9/18:1n-9 ratio increased by 34% (p=0.004)(Fig. 2E), and the 18:1n-7/16:1n-7 ratio by 2% (p=0.796)(Fig. 2F)
Figure 2.

Age-related changes in individual SFA and MUFA compositions (wt % total) in the four age subgroups (29−35 yrs, 41−45 yrs, 52−59 yrs, and 65−80 yrs): (A) myristic acid (14:0), heptadecanoic acid (17:0), palmitic acid (16:0) and stearic acid (18:0) compositions, (B) palmitioleic acid (16:1n-7), eicosenoic acid (20:1n-9), cis-vaccenic acid (18:1n-7), and oleic acid (18:1n-9) compositions, (C) the 18:1n-9/18:0 ratio, (D) the 20:1n-9/18:1n-9 ratio, (E) the 16:1n-7/16:0 ratio, and (F) the 18:1n-7/16:1n-7 ratio. Data are expressed as mean ± S.E.M. Percent change in the oldest versus the youngest subgroup and associated p-values (unpaired t-test, two-tailed) are presented.
Omega-6 PUFA composition (∑18:2n-6, 20:3n-6, 20:4n-6, 22:4n-6, 22:5n-6) was inversely correlated with age (r = −0.45, p=0.012), and was significantly decreased in the oldest versus the youngest subgroup (110%, p=0.001). Age was inversely correlated with arachidonic acid (AA, 20:4n-6)(r = −0.44, p=0.014) and docosapentaenoic acid (DPA, 22:5n-6)(r = −0.74, p≤0.0001) compositions, which decreased in the oldest subgroup by 15% (p=0.008) and 37% (p=0.008), respectively (Fig. 3A). Conversely, age was positively correlated with linolenic acid (18:2n-6) composition (r = +0.37, p=0.043), which increased by 21% (p=0.129) in oldest versus the youngest subgroup (Fig. 3A). Age was not significantly correlated with eicosenoic acid (20:3n-6)(r = +0.06, p=0.743) or adrenic acid (22:4n-6)(r = +0.07, p=0.724) compositions (Fig. 3A). Age was inversely correlated with 20:4/18:2 (r = −0.48, p=0.007) and 22:5/22:4 (r = −0.48, p=0.009) ratios, but not with 20:3/18:2 (r = −0.30, p=0.111), 20:4/20:3 (r = −0.27, p=0.151), or 22:4/20:4 (r = +0.35, p=0.059) ratios (Fig. 3B). The 20:4/18:2 (130%, p=0.035) and 22:5/22:4 (138%, p=0.013) ratios decreased in the oldest versus the youngest subgroup (Fig. 3B). Age was inversely correlated with the principal omega-3 PUFA docosahexaenoic acid (DHA, 22:6n-3)(r = −0.40, p=0.027), which decreased by 22% (p=0.024) in the oldest versus the youngest subgroup (Fig. 3C). Consistent with a previous report (Carver et al., 2001), the omega-3 fatty acids α-linolenic acid (18:3n-3) and eicosapentaenoic acid (20:5n-3) were below the limit of detection in our postmortem brain samples. Age was not significantly correlated with the AA:DHA ratio (r = +0.28, p=0.137)(Fig. 3D).
Figure 3.
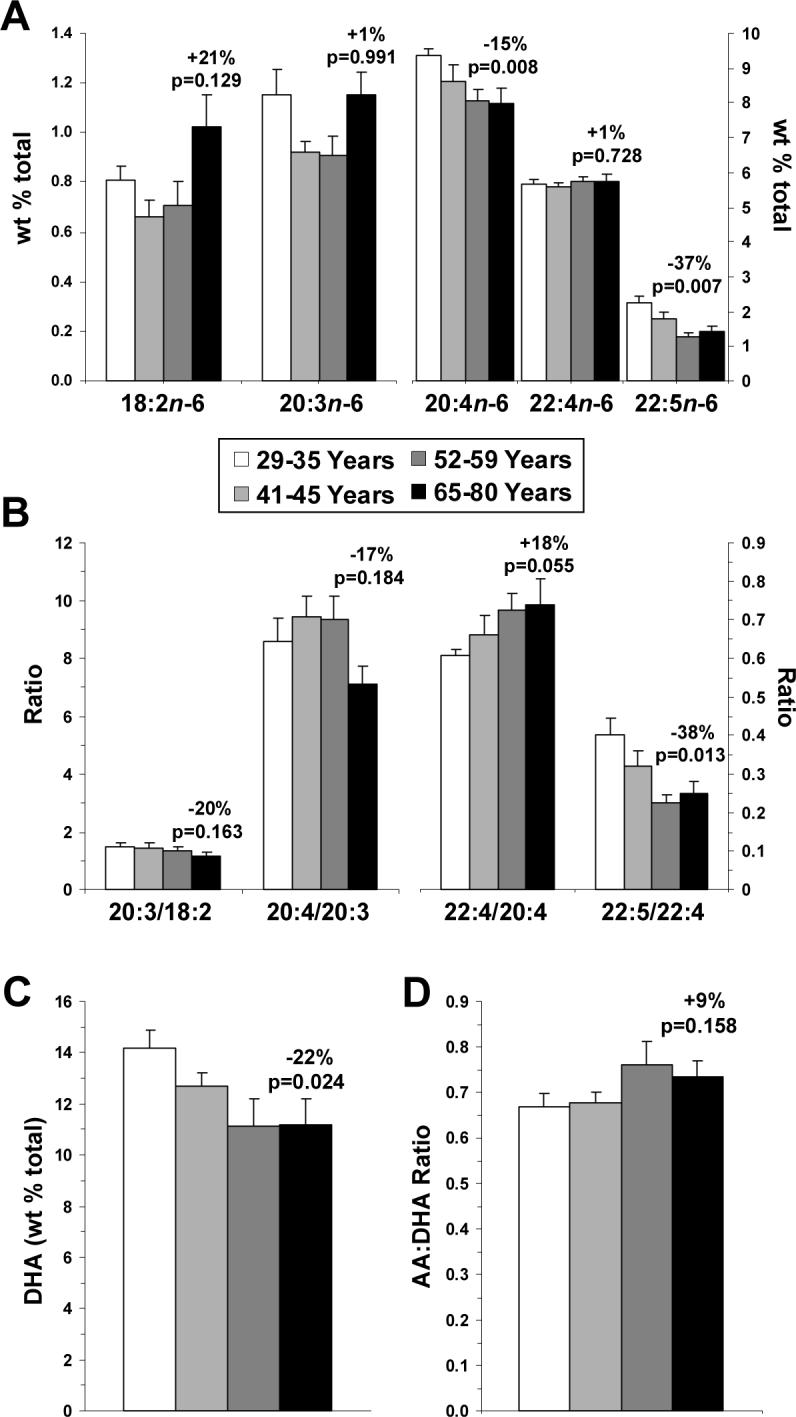
Age-related changes in individual PUFA compositions (wt % total) in the four age subgroups (29−35 yrs, 41−45 yrs, 52−59 yrs, and 65−80 yrs): (A) linoleic acid (18:2n-6), homo-γ1 linoleic acid (20:3n-6), arachidonic acid (AA, 20:4n-6), adrenic acid (22:4n-6), and docosapentaenoic acid (22:5n-6) compositions, (B) 20:3/18:2, 20:4/20:3, 22:4/20:4, and 22:5/22:4 ratios, (C) docosahexaenoic acid (DHA, 22:6n-3) composition, and (D) the AA:DHA ratio. Data are expressed as mean ± S.E.M. Percent change in the oldest versus the youngest subgroup and associated p-values (unpaired t-test, two-tailed) are presented.
3.4. Lipogenic gene expression
3.4.1. Elongase (HELO1) mRNA
Among all subjects, HELO1 mRNA expression exhibited an inverted-U shaped expression pattern with increasing age and did not correlate significantly with age (r = +0.02, p=0.926). After removal of the 65−80 year age subgroup, HELO1 was positively correlated with age (r = +0.57, p=0.018). The 52−59 year age subgroup exhibited significantly greater HELO1 mRNA expression relative to the 29−35 year age subgroup (+49%, p=0.002)(Fig. 4). Only after the removal of the 65−80 year subgroup, HELO1 mRNA expression was inversely correlated with ∑PUFA (r = −0.67, p=0.005), ∑omega-6 (r = −0.74, p=0.0006), arachidonic acid (r = −0.67, p=0.003), and DHA (r = −0.75, p=0.0007) compositions, and was positively correlated with the 22:4/20:4 ratio (r = +0.58, p=0.014). HELO1 mRNA expression was also positively correlated with gondoic acid (20:1n-9)(r = +0.78, p=0.0004), oleic acid (18:1n-9)(r = +0.80, p=0.0002), and the 20:1/18:1 ratio (r = +0.60, p=0.002).
Figure 4.
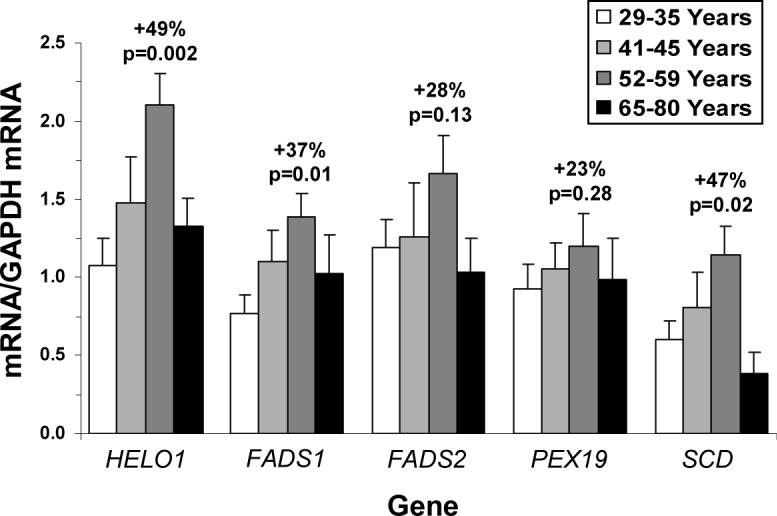
Age-related changes in lipogenic mRNA expression in the OFC gray matter of the four age subgroups (29−35 yrs, 41−45 yrs, 52−59 yrs, and 65−80 yrs): HELO1 (elongase), FASD1 (delta-5 desaturase), FASD2 (delta-6 desaturase), PEX19 (peroxisome), and SCD (delta-9 desaturase) mRNA expression. Data are expressed as mean mRNA/GAPDH mRNA ± S.E.M. Percent change from the 52−59 yrs subgroup and associated p-values (unpaired t-test, two-tailed) are presented.
3.4.2. Delta-5 desaturase (FASD1) mRNA
Among all subjects, FASD1 mRNA expression was not significantly correlated with age (r = +0.08, p=0.675). After removal of the 65−80 year age subgroup, FASD1 was positively correlated with age (r = +0.59, p=0.014). The 52−59 year age subgroup exhibited significantly greater FASD1 mRNA expression relative to the 29−35 year age subgroup (+37%, p=0.013)(Fig. 4). ∑PUFA was inversely correlated with FASD1 mRNA expression (r = −0.47, p=0.017). FASD1 mRNA expression was inversely correlated with omega-6 PUFA composition before (r = −0.61, p=0.001) and after (r = −0.76, p=0.0003) removal of the 65−80 year subgroup. Among all subjects, FASD1 mRNA was inversely correlated with 20:4n-6 (r = −0.51, p=0.009), 20:3n-6 (r = −0.52, p=0.008), and 22:5n-6 (r = −0.59, p=0.002) compositions, and positively correlated with the 20:4/20:3 ratio (r = +0.49, p=0.025). FASD1 mRNA was inversely correlated with DHA composition before (r = −0.42, p=0.042) and after (r = −0.52, p=0.026) removal of the 65−80 year subgroup.
3.4.3. Delta-6 desaturase (FASD2) mRNA
FASD2 mRNA expression was not significantly correlated with age before (r = −0.05, p=0.809) or after (r = +0.37, p=0.128) removal of the 65−80 year subgroup. The 52−59 year age subgroup exhibited greater, but not statistically significant, FASD2 mRNA expression relative to the 29−35 year age subgroup (+28%, p=0.13)(Fig. 4). FASD2 mRNA expression was inversely correlated with ∑PUFA (r = −0.60, p=0.011) and ∑omega-6 (r = −0.52, p=0.028) only after removal of the 65−80 year age subgroup. Among all subjects, FASD2 mRNA was inversely correlated with 18:2n-6 composition (r = −0.54, p=0.006) and positively correlated with the 20:4/18:2 ratio (r = +0.62, p=0.001). Only after removal of the 65−80 year subgroup was FASD2 mRNA inversely correlated with DHA composition (r = −0.52, p=0.031).
3.4.4. Peroxisome (PEX19) mRNA
The final synthesis of DHA and docosapentaenoic acid (DPA, 22:5n-6) require processing with peroxisomes, and PEX19 is a peroxisome membrane assembly gene required for peroxisome function [26,30,31]. Among all subjects (r = +0.09, p=0.964) and after removal of the 65−80 year age subgroup (r = +0.34, p=0.184), PEX19 mRNA expression was not significantly correlated with age. The 52−59 year age subgroup exhibited a non-significant increase in PEX19 mRNA expression relative to the 29−35 year age subgroup (+23%, p=0.28)(Fig. 4). DHA composition was not correlated with PEX19 mRNA expression among all subjects (r = +0.27, p=0.19) or after removal of the 65−80 year subgroup (r = −0.004, p=0.987). DPA (22:5n-6) composition was not correlated with PEX19 mRNA expression among all subjects (r = −0.27, p=0.213) or after removal of the 65−80 year subgroup (r = −0.33, p=0.221). Adrenic acid (22:4n-6), the pre-peroxisome precursor of DPA, was not correlated with PEX19 mRNA expression among all subjects (r = −0.31, p=0.121) or after removal of the 65−80 year subgroup (r = −0.19, p=0.445). PEX19 mRNA expression was not significantly correlated with the 22:5/22:4 ratio among all subjects (r = −0.11, p=0.587) or after removal of the 65−80 year subgroup (r = −0.27, p=0.281).
3.4.5. Stearoyl-CoA desaturase (SCD) mRNA
SCD mediates the synthesis of oleic acid (18:1) and palmitioleic acid (16:1) from stearic acid (18:0) and palmitic acid (16:0), respectively [32]. Among all subjects, SCD mRNA expression was not significantly correlated with age (r = −0.06, p=0.761). After removal of the 65−80 year age subgroup, SCD mRNA was positively correlated with age (r = +0.58, p=0.019). The 52−59 year age subgroup exhibited significantly greater SCD mRNA expression relative to the 29−35 year age subgroup (+47%, p=0.021)(Fig. 4). Among all subjects, SCD mRNA expression was inversely correlated with ∑SFA composition (r = −0.50, p=0.012), and positively correlated with both ∑MUFA composition (r = +0.56, p=0.005) and the ∑MUFA:∑SFA ratio (r = +0.55, p=0.004). Among all subjects, SCD mRNA expression was inversely correlated with palmitic acid (r = −0.57, p=0.003), but not stearic acid (r = −0.24, p=0.251) or myristic acid (r = +0.12, p=0.590). After removal of the 65−80 year age subgroup, SCD mRNA expression was inversely correlated with stearic acid (r = −0.52, p=0.027). SCD mRNA expression was significantly positively correlated with eicosenoic acid (r = +0.61, p=0.002), cis-vaccenic acid (r = +0.42, p=0.042), and oleic acid (r = +0.54, p=0.006), but not palmitioleic acid (r = −0.00, p=0.989). Among all subjects, SCD mRNA expression was positively correlated with the 18:1/18:0 ratio (r = +0.49, p=0.015) but not the 16:1/16:0 ratio (r = +0.35, p=0.106). After removal of the 65−80 year age subgroup, SCD mRNA was also positively correlated with the 16:1/16:0 ratio (r = +0.49, p=0.038).
3.5. PUFA regulation of stearoyl-CoA desaturase activity and expression
Prior studies have found that PUFAs, including linolenic acid (18:2n-6), arachidonic acid, and DHA, reduce SCD1 mRNA expression in rodent hepatic and adipose tissue [33]. PUFA (∑18:2n-6, 20:3n-6, 20:4n-6, 22:4n-6, 22:5n-6, 22:6n-3) composition was inversely correlated with 18:1/18:0 (r = −0.93, p≤0.0001) and 16:1/16:0 (r = −0.72, p≤0.0001) ratios, as well as SCD mRNA expression (r = −0.42, p=0.036). Linolenic acid composition was inversely correlated with 18:1/18:0 (r = −0.63, p=0.0006) and 16:1/16:0 (r = −0.51, p=0.014) ratios, as well as SCD mRNA expression (r = −0.41, p=0.041). AA (20:4n16) composition was inversely correlated with 18:1/18:0 (r = −0.92, p≤0.0001) and 16:1/16:0 (r = −0.70, p≤0.0001) ratios (Fig. 5A,B), as well as SCD mRNA expression (r = −0.47, p=0.016). Similarly, DHA composition was inversely correlated with 18:1/18:0 (r = −0.91, p≤0.0001) and 16:1/16:0 (r = −0.73, p≤0.0001) ratios (Fig. 5C,D), and SCD mRNA expression (r = −0.53, p=0.011).
Figure 5.

Linear regression analyses of the 18:1n-9:18:0 ratio and DHA (22:6n-3) (A) and AA (20:4n-6) (B) compositions, and the 16:1n-7:16:0 ratio and DHA (C) and AA (D) compositions. Note that both 18:1n-9/18:0 and 16:1n-7/16:0 ratios, indices of stearoyl-CoA desaturase activity, are inversely correlated with both DHA and AA composition. Pearson correlation coefficients and associated p-values (two-tailed) are presented.
4. Discussion
Based on prior imaging, postmortem, and preclinical studies suggesting that DHA deficits may be associated with reductions in cortical gray matter volume, we hypothesized that the age-related decline in OFC gray matter volume would be associated with a progressive decline in OFC DHA composition. Consistent with this hypothesis, OFC DHA composition exhibited a progressive decline with increasing age, and decreased by 22% in the oldest versus the youngest age group. We also found that the principal omega-6 PUFA, arachidonic acid (AA, 20:4n-6), exhibited a progressive reduction with age and decreased by 15% in the oldest versus the youngest age group. The age-related decline in both DHA and AA composition was associated with elevations, rather than reductions, in OFC elongase and desaturase gene expression suggesting compensatory up-regulation. We additionally found that increasing age was associated with a progressive decline in saturated fatty acid (SFA) composition, including stearic acid and palmitic acid, and reciprocal elevations in monounsaturated fatty acid (MUFA) composition, including oleic acid and palmitoleic acid, findings consistent with increasing SCD activity [32]. The MUFA:SFA, oleic acid:stearic acid, and palmitoleic acid:palmitic acid ratios all progressively increased with age, whereas the increase in SCD mRNA expression was transient. Consistent with the repression of SCD gene expression and activity by PUFAs [33], elevations in SCD mRNA expression and activity were inversely correlated with PUFA composition. Collectively, these data indicate that increasing age is associated with dynamic and interrelated changes in OFC gray matter fatty acid composition and lipogenic gene expression.
The age-related decline in both DHA and AA, and associated elevation in oleic acid, are also observed in the aged rat prefrontal cortex despite the availability of dietary omega-3 and omega-6 PUFA precursors [18-20]. This finding suggests that the age-related decline in cortical DHA and AA composition is due to reduced biosynthesis from dietary precursors. This is supported by the finding that aged rodents exhibit reductions in hepatic delta-6 and delta-5 desaturase activity [34,35]. In the present study, increasing age was associated with transient elevations in delta-5 and delta-6 desaturase and elongase mRNA expression during declining DHA and AA composition, suggesting a compensatory up-regulation secondary to dietary deficiency. Although there were no data available regarding the PUFA composition of the diets of the subjects used in this study, preclinical studies have found that hepatic delta-5 and delta-6 desaturase mRNA expression also increase in response to dietary PUFA insufficiency [23,24,36,37]. However, a recent study found that selective dietary omega-3 fatty acid deficiency and associated brain DHA deficits did not alter delta-5 and delta-6 desaturase or elongase mRNA expression in adult rat brain [37]. The discrepancy between the latter finding and the elevations in elongase and desaturase expression observed in the present study is not clear, and may be due to species and/or age-related differences in cortical lipogenic gene regulation. Consistent with compensatory up-regulation in human brain tissue, we have found that selective deficits in DHA composition in the OFC of MDD patients is associated with significant elevations in delta-6 desaturase (FASD2) mRNA expression relative age-matched controls (+38%, p=0.02) (McNamara, unpublished observations).
The final synthesis of DHA (22:6n-3) and docosapenaenoic acid (DPA, 22:5n-6) from fatty acid precursors require metabolism within peroxisomes [38]. Peroxisomal biogenesis disorders including Zellweger syndrome are also associated with deficits in cortical DHA and DPA composition [39], and mutations in peroxisome assembly genes including PEX19 [26]. The aged rodent brain exhibits deficits in peroxisomal-mediated β-oxidation [40] and deficits in cortical DHA and DPA composition [18]. Consistent with an age-related decline in cortical peroxisome function, we found that increasing age was associated with a progressive decline in both DHA and DPA compositions. Although the peroxisomal assembly gene PEX19 has been found to be essential for peroxisomal formation and function [26,30,31], we found that PEX19 mRNA expression did not exhibit significant age-related alterations in association with declining DHA and DPA compositions. Nevertheless, it is possible that polymorphisms within the PEX19 gene, and/or reductions in the expression of other peroxisomal assembly genes, may also contribute to impaired peroxisomal function. The present findings suggest that a more comprehensive analysis of peroxisomal function in the aging OFC is warranted.
The synthesis of oleic acid (18:1) and palmitioleic acid (16:1) from stearic acid (18:0) and palmitic acid (16:0), respectively, is mediated by stearoyl-CoA desaturase (SCD)[32]. The human SCD gene has been cloned and is highly expressed in human brain and liver [27]. In the present study, we found that SCD mRNA was expressed in human OFC gray matter and to be positively correlated with indices of SCD activity. Furthermore, we found that increasing age was associated with a progressive increase in SCD activity and a transient increase in SCD mRNA expression. Consistent with prior preclinical studies finding that SCD gene expression is negatively regulated by PUFAs, including linolenic acid, AA, and DHA, at the level of transcription and mRNA stability [33], we found that OFC PUFA composition was inversely correlated with both SCD mRNA expression and activity. This finding may take on additional significance in view of evidence implicating SCD in central [41] and peripheral [42] myelin synthesis and age-related oligodendrocyte pathology [43,44]. Moreover, we have recently found that SCD mRNA expression and activity is significantly reduced, and PUFA composition significantly increased, in OFC gray matter of patients with multiple sclerosis (McNamara et al., manuscript in preparation). Together these findings suggest that cortical PUFA composition is an important determinant of local SCD expression and activity which may have potential implications for myelin integrity.
The age-related decline in OFC PUFA composition may have implications for affective regulation. For example, the decline in OFC DHA composition found between the youngest and oldest age groups (122%) is the same as the DHA deficit previously found in the OFC of adult (46.5 ± 9.3 years) MDD patients relative to age-matched controls (122%)[22]. Although the subjects used in this study were not clinically diagnosed with major depression, the incidence of clinically-significant subsyndromal or minor depression increases progressively with advancing age and is frequently not diagnosed or treated [45], and the majority of subjects died from cardiovascular-related disorders which places them at increased risk for subsyndromal depression [46]. It is also of interest that the observed agerelated decline in DHA and AA, and associated elevation in SCD activity, are also observed in the OFC of young adult (39.6 ± 10 years) patients with bipolar disorder [28]. Within the context of the present findings, these data would suggest that young adult patients with bipolar disorder or MDD exhibit premature age-related deficits in OFC PUFA composition. Furthermore, the finding that increasing age, MDD, and bipolar disorder are all associated with neuronal shrinkage in the OFC [13], reductions in OFC gray matter volume [2,9,47], and OFC DHA deficits [present results, 22,28], suggests that these may be interrelated phenomenon. This is supported by the findings that dietary-induced DHA deficits reduce neuronal size in rat brain [17] and dietary omega-3 fatty acid composition is positively correlated with cortical gray matter volume in healthy adult subjects [21]. It will therefore be of interest to determine whether dietary-induced elevations in cortical DHA composition can prevent, slow, or reverse age- and illness-related deficits in OFC gray matter volume and function.
Acknowledgments
This work was supported in part by National Institute of Health grants MH073704 and MH074858 to R.K.M. Postmortem tissue was donated by The Stanley Medical Research Institute's Brain Collection courtesy of Drs. Michael B. Knable, E. Fuller Torrey, Maree J. Webster, Serge Weis, and Robert H. Yolken, and the Harvard Brain Tissue Resource Center.
Footnotes
Publisher's Disclaimer: This is a PDF file of an unedited manuscript that has been accepted for publication. As a service to our customers we are providing this early version of the manuscript. The manuscript will undergo copyediting, typesetting, and review of the resulting proof before it is published in its final citable form. Please note that during the production process errors may be discovered which could affect the content, and all legal disclaimers that apply to the journal pertain.
References
- 1.Kringelbach ML, Rolls ET. The functional neuroanatomy of the human orbitofrontal cortex: evidence from neuroimaging and neuropsychology. Prog Neurobiol. 2004;72:341–372. doi: 10.1016/j.pneurobio.2004.03.006. [DOI] [PubMed] [Google Scholar]
- 2.Raz N, Gunning FM, Head D, Dupuis JH, McQuain J, Briggs SD, Loken WJ, Thornton AE, Acker JD. Selective aging of the human cerebral cortex observed in vivo: differential vulnerability of the prefrontal gray matter. Cereb Cortex. 1997;7:268–282. doi: 10.1093/cercor/7.3.268. [DOI] [PubMed] [Google Scholar]
- 3.Raz N, Gunning-Dixon F, Head D, Rodrigue KM, Williamson A, Acker JD. Aging, sexual dimorphism, and hemispheric asymmetry of the cerebral cortex: replicability of regional differences in volume. Neurobiol Aging. 2004;25:377–396. doi: 10.1016/S0197-4580(03)00118-0. [DOI] [PubMed] [Google Scholar]
- 4.Resnick SM, Pham DL, Kraut MA, Zonderman AB, Davatzikos C. Longitudinal magnetic resonance imaging studies of older adults: a shrinking brain. J Neurosci. 2003;23:3295–3301. doi: 10.1523/JNEUROSCI.23-08-03295.2003. [DOI] [PMC free article] [PubMed] [Google Scholar]
- 5.Tisserand DJ, van Boxtel MP, Pruessner JC, Hofman P, Evans AC, Jolles J. A voxel-based morphometric study to determine individual differences in gray matter density associated with age and cognitive change over time. Cereb Cortex. 2004;14:966–973. doi: 10.1093/cercor/bhh057. [DOI] [PubMed] [Google Scholar]
- 6.Lamar M, Yousem DM, Resnick SM. Age differences in orbitofrontal activation: an fMRI investigation of delayed match and nonmatch to sample. Neuroimage. 2004;21:1368–1376. doi: 10.1016/j.neuroimage.2003.11.018. [DOI] [PubMed] [Google Scholar]
- 7.Lamar M, Resnick SM. Aging and prefrontal functions: dissociating orbitofrontal and dorsolateral abilities. Neurobiol Aging. 2004;25:553–558. doi: 10.1016/j.neurobiolaging.2003.06.005. [DOI] [PubMed] [Google Scholar]
- 8.Resnick SM, Lamar M, Driscoll I. Vulnerability of the orbitofrontal cortex to age-associated structural and functional brain changes. Ann N Y Acad Sci. 2007;1121:562–575. doi: 10.1196/annals.1401.027. [DOI] [PubMed] [Google Scholar]
- 9.Bremner JD, Vythilingam M, Vermetten E, Nazeer A, Adil J, Khan S, Staib LH, Charney DS. Reduced volume of orbitofrontal cortex in major depression. Biol Psychiatry. 2002;51:273–279. doi: 10.1016/s0006-3223(01)01336-1. [DOI] [PubMed] [Google Scholar]
- 10.Lacerda AL, Keshavan MS, Hardan AY, Yorbik O, Brambilla P, Sassi RB, Nicoletti M, Mallinger AG, Frank E, Kupfer DJ, Soares JC. Anatomic evaluation of the orbitofrontal cortex in major depressive disorder. Biol Psychiatry. 2004;55:353–358. doi: 10.1016/j.biopsych.2003.08.021. [DOI] [PubMed] [Google Scholar]
- 11.Ballmaier M, Toga AW, Blanton RE, Sowell ER, Lavretsky H, Peterson J, Pham D, Kumar A. Anterior cingulate, gyrus rectus, and orbitofrontal abnormalities in elderly depressed patients: an MRI1based parcellation of the prefrontal cortex. Am J Psychiatry. 2004;161:99–108. doi: 10.1176/appi.ajp.161.1.99. [DOI] [PubMed] [Google Scholar]
- 12.Lai T, Payne ME, Byrum CE, Steffens DC, Krishnan KR. Reduction of orbital frontal cortex volume in geriatric depression. Biol Psychiatry. 2000;48:971–975. doi: 10.1016/s0006-3223(00)01042-8. [DOI] [PubMed] [Google Scholar]
- 13.Cotter D, Hudson L, Landau S. Evidence for orbitofrontal pathology in bipolar disorder and major depression, but not in schizophrenia. Bipolar Disord. 2005;7:358–369. doi: 10.1111/j.1399-5618.2005.00230.x. [DOI] [PubMed] [Google Scholar]
- 14.Pakkenberg B, Gundersen HJ. Neocortical neuron number in humans: effect of sex and age. J Comp Neurol. 1997;384:312–320. [PubMed] [Google Scholar]
- 15.Terry RD, DeTeresa R, Hansen LA. Neocortical cell counts in normal human adult aging. Ann Neurol. 1987;21:530–539. doi: 10.1002/ana.410210603. [DOI] [PubMed] [Google Scholar]
- 16.McNamara RK, Carlson SE. Role of omega-3 fatty acids in brain development and function: potential implications for the pathogenesis and prevention of psychopathology. Prostaglandins Leukot Essent Fatty Acids. 2006;75:329–349. doi: 10.1016/j.plefa.2006.07.010. [DOI] [PubMed] [Google Scholar]
- 17.Ahmad A, Moriguchi T, Salem N. Decrease in neuron size in docosahexaenoic acid-deficient brain. Pediatr Neurol. 2002;26:210–218. doi: 10.1016/s0887-8994(01)00383-6. [DOI] [PubMed] [Google Scholar]
- 18.Favrelere S, Stadelmann-Ingrand S, Huguet F, De Javel D, Piriou A, Tallineau C, Durand G. Age-related changes in ethanolamine glycerophospholipid fatty acid levels in rat frontal cortex and hippocampus. Neurobiol Aging. 2000;21:653–660. doi: 10.1016/s0197-4580(00)00170-6. [DOI] [PubMed] [Google Scholar]
- 19.Lopez GH, Ilincheta de Boschero MG, Castagnet PI, Giusto NM. Age-associated changes in the content and fatty acid composition of brain glycerophospholipids. Comp Biochem Physiol B Biochem Mol Biol. 1995;112:331–343. doi: 10.1016/0305-0491(95)00079-8. [DOI] [PubMed] [Google Scholar]
- 20.Ulmann L, Mimouni V, Roux S, Porsolt R, Poisson JP. Brain and hippocampus fatty acid composition in phospholipid classes of aged-relative cognitive deficit rats. Prostaglandins Leukot Essent Fatty Acids. 2001;64:189–195. doi: 10.1054/plef.2001.0260. [DOI] [PubMed] [Google Scholar]
- 21.Conklin SM, Gianaros PJ, Brown SM, Yao JK, Hariri AR, Manuck SB, Muldoon MF. Long-chain omega-3 fatty acid intake is associated positively with corticolimbic gray matter volume in healthy adults. Neurosci Lett. 2007;421:209–212. doi: 10.1016/j.neulet.2007.04.086. [DOI] [PubMed] [Google Scholar]
- 22.McNamara RK, Hahn CG, Jandacek R, Rider T, Tso P, Stanford KE, Richtand NM. Selective deficits in the omega-3 fatty acid docosahexaenoic acid in the postmortem orbitofrontal cortex of patients with major depressive disorder. Biol Psychiatry. 2007;62:17–24. doi: 10.1016/j.biopsych.2006.08.026. [DOI] [PubMed] [Google Scholar]
- 23.Cho HP, Nakamura M, Clarke SD. Cloning, expression, and fatty acid regulation of the human delta-5 desaturase. J Biol Chem. 1999;274:37335–37339. doi: 10.1074/jbc.274.52.37335. [DOI] [PubMed] [Google Scholar]
- 24.Cho HP, Nakamura MT, Clarke SD. Cloning, expression, and nutritional regulation of the mammalian delta-6 desaturase. J Biol Chem. 1999;274:471–477. doi: 10.1074/jbc.274.1.471. [DOI] [PubMed] [Google Scholar]
- 25.Leonard AE, Bobik EG, Dorado J, Kroeger PE, Chuang LT, Thurmond JM, Parker1Barnes JM, Das T, Huang YS, Mukerji P. Cloning of a human cDNA encoding a novel enzyme involved in the elongation of long-chain polyunsaturated fatty acids. Biochem J. 2000;350:765–770. [PMC free article] [PubMed] [Google Scholar]
- 26.Matsuzono Y, Kinoshita N, Tamura S, Shimozawa N, Hamasaki M, Ghaedi K, Wanders RJ, Suzuki Y, Kondo N, Fujiki Y. Human PEX19: cDNA cloning by functional complementation, mutation analysis in a patient with Zellweger syndrome, and potential role in peroxisomal membrane assembly. Proc Natl Acad Sci U S A. 1999;96:2116–2121. doi: 10.1073/pnas.96.5.2116. [DOI] [PMC free article] [PubMed] [Google Scholar]
- 27.Zhang L, Ge L, Parimoo S, Stenn K, Prouty SM. Human stearoyl-CoA desaturase: alternative transcripts generated from a single gene by usage of tandem polyadenylation sites. Biochem J. 1999;340:255–264. [PMC free article] [PubMed] [Google Scholar]
- 28.McNamara RK, Jandacek R, Rider T, Tso P, Stanford K, Hahn C-G, Richtand NM. Deficits in docosahexaenoic acid and associated elevations in the metabolism of arachidonic acid and saturated fatty acids in the postmortem orbitofrontal cortex of patients with bipolar disorder. Psychiatric Res. 2008 doi: 10.1016/j.psychres.2007.08.021. [Epub ahead of print] [DOI] [PMC free article] [PubMed] [Google Scholar]
- 29.McNamara RK, Levant B, Taylor B, Ahlbrand R, Liu Y, Sullivan JR, Stanford K, Richtand NM. C57BL/6J mice exhibit reduced dopamine D3 receptor-mediated locomotor-inhibitory function relative to DBA/2J mice. Neuroscience. 2006;143:141–153. doi: 10.1016/j.neuroscience.2006.07.015. [DOI] [PMC free article] [PubMed] [Google Scholar]
- 30.Götte K, Girzalsky W, Linkert M, Baumgart E, Kammerer S, Kunau WH, Erdmann R. Pex19p, a farnesylated protein essential for peroxisome biogenesis. Mol Cell Biol. 1998;18:616–628. doi: 10.1128/mcb.18.1.616. [DOI] [PMC free article] [PubMed] [Google Scholar]
- 31.Sacksteder KA, Jones JM, South ST, Li X, Liu Y, Gould SJ. PEX19 binds multiple peroxisomal membrane proteins, is predominantly cytoplasmic, and is required for peroxisome membrane synthesis. J Cell Biol. 2000;148:931–944. doi: 10.1083/jcb.148.5.931. [DOI] [PMC free article] [PubMed] [Google Scholar]
- 32.Ntambi JM, Miyazaki M. Regulation of stearoyl-CoA desaturases and role in metabolism. Prog Lipid Res. 2004;43:91–104. doi: 10.1016/s0163-7827(03)00039-0. [DOI] [PubMed] [Google Scholar]
- 33.Ntambi JM. Regulation of stearoyl-CoA desaturase by polyunsaturated fatty acids and cholesterol. J Lipid Res. 1999;40:1549–1558. [PubMed] [Google Scholar]
- 34.Bordoni A, Biagi PL, Turchetto E, Hrelia S. Aging influence on delta-6-desaturase activity and fatty acid composition of rat liver microsomes. Biochem Int. 1988;17:1001–1009. [PubMed] [Google Scholar]
- 35.Maniongui C, Blond JP, Ulmann L, Durand G, Poisson JP, Bezard J. Age-related changes in delta 6 and delta 5 desaturase activities in rat liver microsomes. Lipids. 1993;28:291–297. doi: 10.1007/BF02536313. [DOI] [PubMed] [Google Scholar]
- 36.Christiansen EN, Lund JS, Rørtveit T, Rustan AC. Effect of dietary n-3 and n-6 fatty acids on fatty acid desaturation in rat liver. Biochim Biophys Acta. 1991;1082:57–62. doi: 10.1016/0005-2760(91)90299-w. [DOI] [PubMed] [Google Scholar]
- 37.Igarashi M, Ma K, Chang L, Bell JM, Rapoport SI. Dietary n-3 PUFA deprivation for 15 weeks upregulates elongase and desaturase expression in rat liver but not brain. J Lipid Res. 2007;48:2463–2470. doi: 10.1194/jlr.M700315-JLR200. [DOI] [PubMed] [Google Scholar]
- 38.Sprecher H, Chen Q, Yin FQ. Regulation of the biosynthesis of 22:5n-6 and 22:6n-3: a complex intracellular process. Lipids. 1999;34(Suppl):S153–156. doi: 10.1007/BF02562271. [DOI] [PubMed] [Google Scholar]
- 39.Martinez M. Abnormal profiles of polyunsaturated fatty acids in the brain, liver, kidney and retina of patients with peroxisomal disorders. Brain Res. 1992;583:171–182. doi: 10.1016/s0006-8993(10)80021-6. [DOI] [PubMed] [Google Scholar]
- 40.Bourre JM, Piciotti M. Alterations in eighteen1carbon saturated, monounsaturated and polyunsaturated fatty acid peroxisomal oxidation in mouse brain during development and aging. Biochem Mol Biol Int. 1997;41:461–468. doi: 10.1080/15216549700201481. [DOI] [PubMed] [Google Scholar]
- 41.DeWille JW, Farmer SJ. Postnatal dietary fat influences mRNAs involved in myelination. Dev Neurosci. 1992;14:61–68. doi: 10.1159/000111648. [DOI] [PubMed] [Google Scholar]
- 42.Garbay B, Boiron-Sargueil F, Shy M, Chbihi T, Jiang H, Kamholz J, Cassagne C. Regulation of oleoyl-CoA synthesis in the peripheral nervous system: demonstration of a link with myelin synthesis. J Neurochem. 1998;71:1719–1726. doi: 10.1046/j.1471-4159.1998.71041719.x. [DOI] [PubMed] [Google Scholar]
- 43.Kumar VB, Vyas K, Buddhiraju M, Alshaher M, Flood JF, Morley JE. Changes in membrane fatty acids and delta-9 desaturase in senescence accelerated (SAMP8) mouse hippocampus with aging. Life Sci. 1999;65:1657–1662. doi: 10.1016/s0024-3205(99)00414-2. [DOI] [PubMed] [Google Scholar]
- 44.Tanaka J, Okuma Y, Tomobe K, Nomura Y. The age-related degeneration of oligodendrocytes in the hippocampus of the senescence-accelerated mouse (SAM) P8: a quantitative immunohistochemical study. Biol Pharm Bull. 2005;28:615–618. doi: 10.1248/bpb.28.615. [DOI] [PubMed] [Google Scholar]
- 45.VanItallie TB. Subsyndromal depression in the elderly: underdiagnosed and undertreated. Metabolism. 2005;54(5 Suppl 1):39–44. doi: 10.1016/j.metabol.2005.01.012. [DOI] [PubMed] [Google Scholar]
- 46.Rudisch B, Nemeroff CB. Epidemiology of comorbid coronary artery disease and depression. Biol Psychiatry. 2003;54:227–240. doi: 10.1016/s0006-3223(03)00587-0. [DOI] [PubMed] [Google Scholar]
- 47.Najt P, Nicoletti M, Chen HH, Hatch JP, Caetano SC, Sassi RB, Axelson D, Brambilla P, Keshavan MS, Ryan ND, Birmaher B, Soares JC. Anatomical measurements of the orbitofrontal cortex in child and adolescent patients with bipolar disorder. Neurosci Lett. 2007;413:183–186. doi: 10.1016/j.neulet.2006.10.016. [DOI] [PMC free article] [PubMed] [Google Scholar]