

Abstract
Summary
Fluorescence imaging of living cells depends on an efficient and specific method for labeling the target cellular protein with fluorophores. Here we show that Sfp phosphopantetheinyl transferase-catalyzed protein labeling is suitable for fluorescence imaging of membrane proteins that spend at least part of their membrane trafficking cycle at the cell surface. In this study, transferrin receptor 1 (TfR1) was fused to peptide carrier protein (PCP), and the TfR1-PCP fusion protein was specifically labeled with fluorophore Alexa 488 by Sfp. The trafficking of transferrin-TfR1-PCP complex during the process of transferrin-mediated iron uptake was imaged by fluorescence resonance energy transfer between the fluorescently labeled transferrin ligand and TfR1 receptor. We thus demonstrated that Sfp-catalyzed small molecule labeling of the PCP tag represents a practical and efficient tool for molecular imaging studies in living cells.
Introduction
Real-time visualization of cellular events is critical for elucidating the complex mechanism of biological processes at the molecular level. To date, much of cellular protein labeling and visualization has been accomplished by expressing the protein of interest as a fusion to the green fluorescent protein (GFP) or its variants in order to study protein localization and dynamics in the living cell [1, 2]. Although GFP and related derivatives bear the drawbacks of large size (230 residues, 27 kDa), limited number of fluorescent variants, and relatively low intrinsic brightness, they are nevertheless the most extensively used fluorescent probes for protein labeling, mainly because they can be genetically encoded and expressed as fusions to the target protein. Despite the development of many synthetic fluorescent probes, from small molecules to nanocrystal quantum dots [3], with excellent sensitivity and resolution for fluorescence microscopy, the lack of efficient labeling methods to enable specific conjugation of the synthetic probes to the target protein in the context of a living cell reduces the potential utility of the synthetic probe toolbox.
Several strategies for labeling proteins with small molecules in the living cell [4] have been developed based on noncovalent binding of small molecule probes to an oligo histidine tag [5], a single-chain antibody fragment [6], or dihydrofolate reductase [7] fused to the protein of interest. However, noncovalent interaction between the probes and binding partners does not yield a stable complex and inevitably leads to signal deterioration with time as the probes progressively dissociate from the target protein. Although a covalent labeling method is preferable, currently available methods suffer drawbacks. For example, biarsenical dyes [8] have been used for site-specific labeling of the CCXXCC motif fused to the target protein, but the cell needs to be treated with micromolar concentrations of dithiols during the labeling reaction, and the background labeling is high [9]. In another method, human O6-alkylguanine-DNA alkyltransferase (hAGT) is fused to the target protein, and protein labeling is achieved by transferring the alkyl group of an O6-alkylguanine derivative to a cysteine residue on hAGT [10]. The main drawback of this method is that the size of hAGT is large (207 residues) and hAGT-deficient cell lines need to be used for protein labeling. A recent report showed that biotin ligase can be used to transfer biotin to a 15 residue peptide fused to the target protein, which can then be labeled with fluorophores conjugated to streptavidin. Although in this case the size of the peptide tag is small, a multistep procedure involving streptavidin binding must be performed in order to label cell surface receptors with fluorophores [11].
We recently developed a general strategy for site-specific labeling of proteins with small molecules by the posttranslational modification enzyme phosphopantetheinyl transferase Sfp [12]. The target proteins are expressed as fusions to an 80 residue peptide carrier protein (PCP) excised from a nonribosomal peptide synthetase (NRPS), such that Sfp catalyzes the covalent modification of a specific serine residue on PCP to yield the small molecule-phosphopantetheinyl conjugate. The specific and efficient labeling reaction targets PCP fusion proteins in cell lysates. The PCP tag has been shown to be compatible with diverse proteins, and Sfp-catalyzed PCP modification can be carried out with various small molecule probes conjugated to coenzyme A (CoA) [13, 14], highlighting the potential of the PCP tag for site-specific protein labeling with small molecules. Similar to this strategy, it was reported recently that a-agglutinin receptor and G protein-coupled receptor neurokinin-1 could be fused to the acyl carrier protein from E. coli and specifically labeled with fluorophores by E. coli phosphopantetheinyl transferase [15].
Here we describe the application of the Sfp-catalyzed protein labeling strategy for imaging the endocytic pathway of transferrin receptor 1 (TfR1). Moreover, we show that, by specific labeling of TfR1 and transferrin with a pair of small molecule fluorophores (Alexa Fluor 488 and 568) suitable for the measurement of fluorescence resonance energy transfer (FRET) [16], internalization of the ligand-receptor complex can be followed by FRET between TfR1 and transferrin. This method enables the tracking of receptor-ligand complex formation, endocytosis, and exocytosis in real time, further demonstrating the potential of Sfp-catalyzed protein labeling for live-cell imaging.
Results and Discussion
Transferrin-mediated iron uptake represents the major mechanism used by vertebrate cells to acquire iron from the environment [17, 18]. Upon binding of diferric transferrin to TfR1, internalization of the holo transferrin-TfR1 complex occurs through clathrin-dependent endocytosis. The holo transferrin-TfR1 complexes are first delivered to early endosomes, where transferrin releases iron within an acidic environment. Apotransferrin then remains bound to TfR1 until the complex recycles back to the cell surface, where it dissociates at a neutral pH [19, 20] (Figure 1).
Figure 1. Model for Transferrin-Mediated Iron Uptake.

Transferrin receptor 1 (green) is drawn with C terminus fused to the PCP domain (blue), and transferrin ligand is shown as red triangles with iron (gray balls) bound. For fluorescence imaging, transferrin receptor 1 was labeled with Alexa 488 (green oval) attached to the PCP, and transferrin was labeled with Alexa 568 (red circle).
TfR1 is a homodimeric type II transmembrane protein with a small N-terminal cytoplasmic domain, a single-pass transmembrane region, and a large extracellular domain [21, 22]. Recent structural analysis of the human TfR1-transferrin complex, obtained by cryo-EM, has revealed that each TfR1 dimer binds two transferrins with a two-fold symmetry and that the extracellular C terminus of TfR1 is not involved in the binding of transferrin to TfR1 [23] (Figure 2). We thus rationalized that attachment of the PCP tag to the C terminus of TfR1 would not interfere with ligand binding, such that the TfR1-PCP fusion should remain functional in transferrin-mediated iron uptake. By fusing the PCP tag to the C terminus of TfR1, PCP would also be anchored on the surface of the cell and would therefore be available for the protein labeling reaction catalyzed by exogenously added Sfp.
Figure 2. Sfp-Catalyzed Labeling of TfR1-PCP Fusion on the Surface of the Cell.

Biotin and Alexa Fluor 488 are conjugated to CoA (1 and 2), and Sfp catalyzes the specific modification of a conserved serine residue on the PCP (red ribbon) by the phosphopantetheinyl group attached to the small molecule labels. PCP is shown fused to the C terminus (red) of the extracellular domain (blue) of TfR1 with its N terminus and transmembrane domain in green. Transferrin (gray) binds to TfR1 with a 2-fold symmetry. The structure of transferrin-TfR1 complex was adapted from [23].
Construction and Biochemical Characterization of TfR1-PCP Fusion Receptor
PCP from gramicidin NRPS [12] was fused to the C terminus of TfR1 cloned into the plasmid pcDNA3.1(+) TfR [24] to generate plasmid pcDNA3.1(+) TfR1-PCP. TRVb cells [25], a Chinese hamster ovary cell line that lacks endogenous TfR1, were used for stable expression of TfR1-PCP upon cotransfection with pcDNA3.1(+) TfR1-PCP and pBABE carrying a puromycin resistance gene. TRVb/TfR1-PCP cells were established using puromycin selection.
To functionally characterize the TfR1-PCP fusion receptor, 55Fe uptake and 125I-labeled diferric transferrin binding studies were performed. Results on TRVb/TfR1-PCP cells were compared to those on TRVb cells, the parental line, as well as TRVb1 cells, which stably express wild-type TfR1 [25]. As shown in Figure 3A, when incubated with 55Fe-transferrin, TRVb/TfR1-PCP cells took up levels of 55Fe similar to those of TRVb1 cells, and both cell lines had significantly higher 55Fe uptake (>4-fold) than TRVb cells with no endogenous TfR1 expression. Western blot analysis confirmed similar expression levels of TfR1 and TfR1-PCP in the TRVb1 cells and TRVb/TfR1-PCP cells, respectively. Thus, the fusion receptor TfR1-PCP is capable of delivering 55Fe bound transferrin to the cell. To characterize the physical interaction between ligand and receptor, surface binding of 125I-labeled diferric transferrin to the TRVb/TfR1-PCP and TRVb1 cell lines was measured (Figure 3B). For both cell lines, transferrin binding was saturable with respect to transferrin concentrations up to 500 nM. Based on a 1:1 binding model, the dissociation constants (Kd) of diferric transferrin for TfR1-PCP fusion and wild-type TfR1 on the cell surface were calculated to be 13.9 ± 0.6 nM and 3.4 ± 3.7 nM, respectively. Thus, although the affinity of TfR1-PCP for transferrin was lower than that of wild-type TfR1, transferrin-mediated 55Fe uptake by the TfR1-PCP receptor was not significantly impaired.
Figure 3. Functional Characterization of TfR1-PCP Fusion.
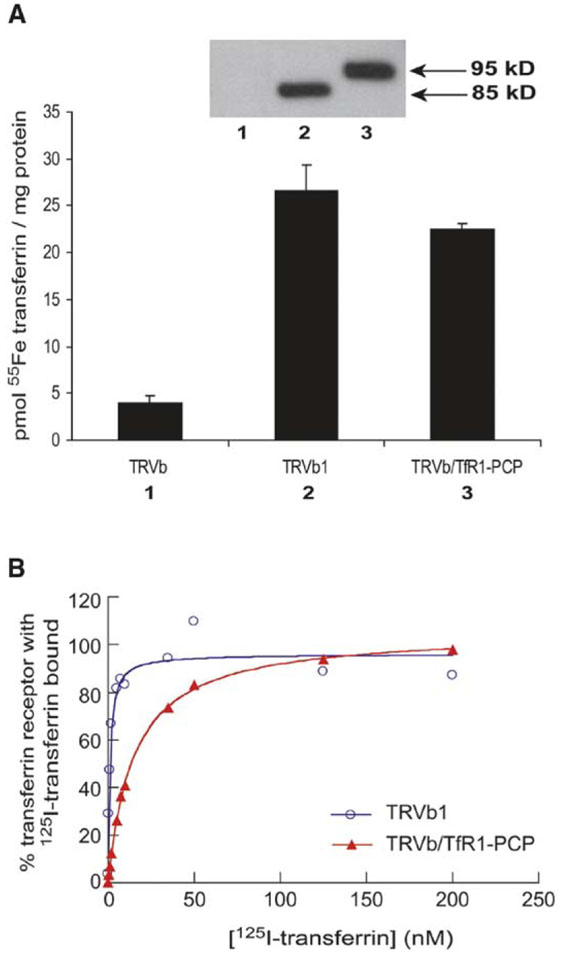
(A) Cell-associated 55Fe was measured in uptake assays upon incubation of TRVb, TRVb1, and TRVb/TfR1-PCP cells with 40 nM 55Fetransferrin, as described in Experimental Procedures. Also shown is a Western blot for TRVb (1), TRVb1 (2), and TRVb/TfR1-PCP (3) cell lysates probed with mouse anti-TfR1 antibody.
(B) Surface 125I-transferrin binding was measured for TRVb1 and TRVb/TfR1-PCP cells incubated on ice with 0.05–500 nM 125I-transferrin in the presence or absence of excess unlabeled transferrin. Specific cell surface binding was taken as the difference between these measured values, and the data were normalized to maximal values determined at 500 nM 125I-transferrin for each cell line. Binding curves were fit assuming a 1:1 binding model.
Live-Cell Labeling of TfR1-PCP by Sfp
To test the labeling of TfR1-PCP fusion receptor expressed on the surface of TRVb/TfR1-PCP cells with Sfp, biotin-CoA (1) and Sfp were added to the cell media and the labeling reaction was allowed to proceed for 20 min. After washing, the cells were lifted from the tissue culture plate and cell lysates were prepared for polyacrylamide gel electrophoresis (PAGE) under both nonreducing and reducing conditions. After electrophoresis, protein was transferred to PVDF membrane and blots were probed using horseradish peroxidase (HRP)-conjugated streptavidin (Figure 4). Under nonreducing conditions, a strong band at 190 kDa was observed, the size of TfR1-PCP homodimer. Reducing conditions yielded a strong band at 95 kDa, the size of TfR1-PCP monomer, while the band at 190 kDa disappeared. These results indicated that TfR1-PCP was efficiently labeled, and the labeling reaction did not disrupt receptor dimerization. Control experiments, carried out with either biotin-CoA or Sfp excluded from the labeling reaction, failed to produce specific labeling. Two faint bands migrating slightly above and below the TfR1-PCP monomer at 95 kDa, which were observed in the absence of biotin-CoA or Sfp, were also present in control labeling reactions using the TRVb cells with no TfR1 expressed, and were most likely cellular proteins with streptavidin binding affinity or with biotin attached before the labeling reaction. The presence of these bands suggests that one common labeling method using streptavidin-fluorescent dye conjugates may give artificial results or high background.
Figure 4. Detection of TfR1-PCP Using Biotin Labeling.

TRVb/TfR1-PCP or TRVb cells were incubated with or without biotin-CoA (1) in the presence and absence of Sfp. Cell lysates were prepared for electrophoresis under both nonreducing (A) and reducing (B) conditions. After transfer to a PVDF membrane, labeling with biotin was probed using streptavidin-HRP.
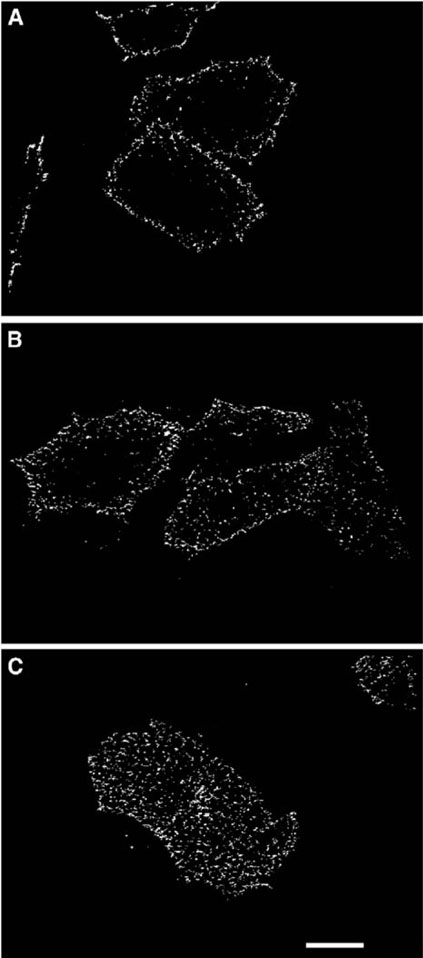
The function of TfR1-PCP was probed further by comparing transferrin uptake pathways in TRVb1 cells and in TRVb cells transiently transfected with pcDNA3.1(+) TfR1-PCP. In both cases, cells were incubated with Alexa Fluor 568 diferric human transferrin conjugates (Tf-Alexa 568, T-23365; Molecular Probes, Inc., Eugene, OR) and fixed at different time points for observation under the confocal microscope. Figure 5 shows a series of projections of stacks of optical slices taken at 0.25 μm per slice. The top three images show TRVb1 cells 1, 10, and 30 min after the addition of Tf-Alexa 568. At short incubation times, transferrin was observed mainly in the vicinity of the plasma membrane, while longer incubation with Tf-Alexa 568 resulted in trafficking of transferrin into the cell and eventual ligand aggregation. These observations agree with current models for TfR1-mediated transferrin uptake, in which the ligand is internalized through receptor-mediated endocytosis and collected in recycling endosomes before leaving the cell by exocytosis. Corresponding images of TRVb cells transfected with TfR1-PCP showed a similar time course (Figure 5, bottom), indicating that the mechanism of transferrin uptake mediated by the TfR1-PCP fusion protein was not detectably different from that mediated by TfR1. Taken together with the results of 55Fe uptake and 125I-transferrin binding studies, the fluorescence imaging studies suggested that addition of the PCP domain did not significantly alter the function of the receptor.
Figure 5. Transferrin Uptake Pathway.

Cells were incubated with Alexa Fluor 568-labeled transferrin, fixed at 1, 10, and 30 min after incubation, and imaged using confocal microscopy. Stacks of optical slices at 0.25 μm per step were processed by MetaMorph using 2D no neighbors deconvolution before 3D reconstruction. Top: TRVb1 cells (100% confluency). Bottom: TRVb cells transfected with TfR1-PCP prior to the addition of transferrin (80%–90% confluency); note that nontransfected cells are not visible. Scale bar = 10 μm.
FRET Imaging of TfR1-PCP Endocytosis upon Transferrin Binding
The small size of the PCP domain and the speed of the labeling reaction allowed live-cell labeling and facilitated dynamic studies of protein-protein interactions. We were therefore able to apply single-cell FRET imaging techniques to study the interaction of transferrin with its membrane receptor TfR1-PCP in TRVb cells. FRET refers to the nonradiative transfer of energy between two fluorophores, where the emission spectrum of the donor overlaps significantly with the excitation spectrum of the acceptor. The efficiency of energy transfer decreases as the sixth power of the separation distance between donor and acceptor fluorophores, restricting the detection of protein-protein interactions to distances of 1–10 nm. The most direct method of quantifying FRET is to measure the increase in acceptor fluorescence due to sensitized emission; however, this method is often complicated by signal-to-noise difficulties. We therefore adopted a donor dequenching method of quantifying FRET, in which the acceptor is photobleached and the subsequent recovery of donor fluorescence is measured; a partial photobleaching protocol was used to prevent photodamage [26].
TRVb cells lacking endogenous TfR1 were transfected with pcDNA3.1(+) TfR1-PCP, and the expressed fusion receptors were labeled with CoA-conjugated Alexa Fluor 488 (2), the donor fluorophore, in the presence of Sfp. Cells were then incubated with media containing transferrin labeled with Alexa Fluor 568, the acceptor fluorophore, fixed at different time points, and mounted for imaging. A set of four confocal images was taken for each field of view and processed using Meta-Morph to obtain a calculated FRET image [26]. Figure 6 shows a FRET imaging analysis of transferrin ligandreceptor interactions after 2 min of incubation in the presence of the ligand. Figures 6A and 6B show the distribution of TfR1-PCP labeled with Alexa 488 before and after photobleaching of Alexa 568, respectively, while Figures 6C and 6D show the distribution of Tf-Alexa 568 before and after photobleaching of Alexa 568, respectively. The integrated fluorescence intensities of the acceptor Tf-Alexa 568 before and after photobleaching yielded the factor for partial photobleaching, which was then used to calculate pixel-bypixel relative FRET intensities. Finally, the calculated FRET intensities were reconstructed into an image (Figure 6E) that revealed the subcellular distribution of ligand-receptor interactions. Figure 6F shows the overlay of Alexa 488-labeled TfR1-PCP (red) after photobleaching of the acceptor, Tf-Alexa 568 (green) before photobleaching of the acceptor, and calculated FRET (blue). Linescans of donor fluorescence, acceptor fluorescence, and FRET confirmed that FRET occurred only where both fluorophores were present (Figure 6G).
Figure 6. FRET Analysis of Transferrin-TfR1 Interactions in TRVb Cells Transfected with TfR1-PCP.

TfR1 was fluorescently labeled with CoAAlexa Fluor 488 (2), and cells were then incubated with Tf-Alexa 568 for 2 min. Shown are images of TfR1-PCP/CoA-Alexa Fluor 488 (2) before (A) and after (B), and Tf-Alexa 568 before (C) and after (D), photobleaching of the acceptor fluorophore Alexa Fluor 568. (E) Shows the calculated relative intensity of FRET between donor and acceptor fluorophores, and (F) represents the overlay of (B) (red), (C) (green), and (E) (blue). (G) Linescan results by MetaMorph. Fluorescence intensities of the donor (red) and the acceptor (green) were measured along the line drawn in (F). Calculated FRET intensity along the same line (blue) was present only where both donor and acceptor fluorophores were present. Scale bar = 10 μm.
A series of FRET imaging analyses allowed tracking of the interaction and translocation of transferrin and its receptor over time. As early as 1 min after the addition of Tf-Alexa 568, a FRET signal between ligand and receptor was observed (data not shown). Ligandreceptor interactions were initially detected at or near the plasma membrane (Figure 7A), but several minutes later interactions were detected in the cell interior as well (Figure 7B). By 15 min of incubation, large aggregates of transferrin/TfR1-PCP complexes were clearly seen (Figure 7C), indicating collection of these complexes in the recycling endosomes. Because of the distance dependence implicit in FRET measurements, FRET studies offer a much higher spatial resolution (nm) than conventional confocal microscopy studies. While in vitro biochemical studies have suggested that transferrin remains bound to its receptor during its endocytic and exocytic cycle, our FRET images provide definitive evidence of the bound ligand-receptor complex in living cells.
Figure 7. Time Course of FRET Redistribution in TRVb Cells during Transferrin Uptake.
TRVb cells were transfected with TfR1-PCP, labeled with CoAAlexa Fluor 488 (2), and incubated with Tf-Alexa 568. Images were calculated from data collected at incubation times of 2 min (A), 5 min (B), and 15 minutes (C). Scale bar = 10 μm.
Significance
Fluorescence imaging of living cells allows the visualization of spatial and temporal dynamics of target proteins in a live biological context. Successful fluorescence imaging depends on an efficient and specific method for labeling the target cellular protein with fluorophores. Here we show that Sfp phosphopantetheinyl transferase catalyzes the labeling of cell surface receptors fused to 80 residue peptide carrier protein (PCP) with high efficiency and specificity, and that small molecules of diverse structures can be used for protein labeling by Sfp. Furthermore our study demonstrates several key advantages of using the Sfp-catalyzed protein labeling reaction to target cell surface protein-PCP fusions. First, Sfp catalyzes covalent labeling of the PCP-tagged membrane protein with high efficiency. Sufficient labeling is achieved on cell lysates or on the living cell within 10 to 20 min. This feature enables the target protein to be rapidly labeled and cellular events to be tracked in real time. Second, as shown by this study and previous studies [12, 13], the PCP tag of relatively small size (80 residues) can be fused to many target proteins at either the N- or C-terminal without significantly disturbing protein function. Third, Sfp-catalyzed PCP labeling is compatible with a variety of different small molecules presented as CoA derivatives, such as biotin and Alexa Fluor fluorescent dyes. Posttranslational modification of PCP domains in fusion proteins can be adopted for affinity purification, live-cell imaging, and other applications. As shown here, Sfp-catalyzed PCP labeling is fully compatible with live-cell fluorescence imaging and single-cell FRET measurements for the real-time visualization of ligand-receptor interactions.
Experimental Procedures
Cloning
A NotI restriction site was introduced at the end of the TfR1 gene before the stop codon in plasmid pcDNA3.1(+) TFR with primers Jun91 (5′- CTC GAG ATA CAG CTG TGC GGC CGC AAA CTC ATT GTC AAT GTC C), Jun92 (5′- GCG GCC GCA CAG CTG TAT CTC GAG TAA ATG TGA TAC CCA TAG C), Jun93 (5′- CAC TAG TCC AGT GTG GTG G) and Jun94 (5′- AGG GCG ATG GCC CAC TACG). PCR fragments were first amplified by Jun91 paired with Jun93 and by Jun92 paired with Jun94 from pcDNA3.1(+) TFR, and then the two amplified fragments were assembled by overlap extension PCR with primers Jun93 and Jun94. The assembled PCR fragment was cloned into pcDNA3.1(+) TFRC between the restriction sites EcoRI and DraIII to give plasmid pcDNA3.1(+) TfR1/NotI, with the NotI restriction site at the end of the TfR1 gene. The PCP gene was amplified from plasmid pPheATE [12] with primers Jun97 (5′- GAG GAG AAA TTA GCG GCC GCA GAA CCT GAT TTA ACT TTCG) and Jun127 (5′- TTA GTG ATG GTG ATG GTG TCT AGA TTA TTT ACT ATC TTT TAT ATA TTG), and cloned into plasmid pcDNA3.1(+) TfR1/NotI between the NotI site and the XbaI site to give plasmid pcDNA3.1(+) TfR1-PCP.
Synthesis
Synthesis of Biotin-CoA (1) was previously reported [12]. Alexa 488-CoA (2) was synthesized following a similar procedure. Briefly, to a solution of Alexa Fluor 488 C5 maleimide (A10254; Molecular Probes) (1.0 mg, 1.4 μmol) in 0.25 ml DMSO, coenzyme A trilithium salt (Sigma, St. Louis, MO) (1.6 mg, 2.1 μmol) in 0.75 ml sodium phosphate 100 mM, pH 7.0, was added and the reaction mixture was stirred at room temperature for 1 hr in darkness. The reaction mixture was then purified by preparative HPLC on a reverse-phase C18 column with a gradient of 0%–50% acetonitrile in 0.1% TFA/water over 30 min. The purified compound was lyophilized, and the identity was confirmed by MALDI-TOF (negative mode): calculated for C51H61N11O28P3S3−: 1465.21; found 1464.28.
Generation of Stable TfR1-PCP Cell Line
TRVb cells (a kind gift of Dr. Timothy E. McGraw, Weill Medical College, Cornell University) were grown to 60% confluency in Hams F12 medium containing 50 U/ml penicillin, 50 μg/ml streptomycin, and 10% fetal bovine serum (FBS) (supplemented Hams F12). The cells were cotransfected with pcDNATfR1-PCP and pBABEPuro (carrying a puromycin resistance gene) at a 20:1 ratio using Fu-GENE 6 (Roche Diagnostics, Indianapolis, IN) according to the manufacturer's instructions. After allowing 48 hr for gene expression, selection was performed by adding 30 μg/ml puromycin to the culture medium. After stable selection under these restrictive growth conditions, cells were subsequently grown in supplemented Hams F12 containing 10 μg/ml puromycin.
Biotin Labeling and Western Blotting
TRVb1 and TRVb/TfR1-PCP cells were grown to 80% confluency in Hams F12 medium containing 50 U/ml penicillin, 50 μg/ml streptomycin, and 10% FBS. For biotin labeling, cell medium was supplemented with or without 1 μM biotin-CoA (1) and 0.5 μM Sfp, and incubation was continued at 30°C for 20 min. Cells were then washed three times with phosphate-buffered saline (PBS) and lysed. To detect biotin labeling, cell lysates containing 2 μg protein were loaded on a 4%–15% SDS-PAGE gel (Biorad, Hercules, CA). After electrophoresis, the protein bands were electroblotted onto a piece of PVDF membrane (Biorad). The membrane was then blocked with 3% bovine serum albumin (BSA) in Tris-buffered saline (TBS) for 2 hr, followed by incubation with 0.1 μg/ml streptavidin-HRP conjugate (Pierce, Rockford, IL) in 1% BSA for 1 hr. The membrane was then washed five times with 0.05% Tween 20 and 0.05% Triton X-100 in TBS, followed by five washes in TBS alone. Streptavidin binding was detected using an ECL luminescence detection kit (Amersham Pharmacia, Piscataway, NJ). For Western blotting of TfR1 and TfR1-PCP fusion, TRVb/TfR1-PCP and TRVb cells were lysed in 1% Triton X-100, 10 mM Tris, pH 7.4, 150 mM NaCl, and 5 mM EDTA containing protease inhibitors, and cell lysates (1 μg) were electrophoresed under reducing conditions as described above. After transfer, blots were blocked with 5% nonfat milk in TBS containing 0.1% Tween 20 (TBST) and incubated with anti-TfR antibody (Invitrogen, Carlsbad, CA) at a 1:1000 dilution in TBST. After washing four times in TBST, the membrane was incubated with goat anti-mouse-HRP (Pierce) at 1:10,000 in TBST containing 5% nonfat milk. The membrane was then washed four times with TBS and developed using chemiluminescence (West Pico reagent, Pierce).
Uptake of 55Fe-Transferrin in Stable Cell Lines
TRVb, TRVb1 and TRVb/TfR1-PCP cells were grown to 80% confluency in supplemented Hams F12 medium. After washing twice in serum-free medium, cell monolayers were incubated in serum-free Hams F12 medium supplemented with 1% BSA, and 40 nM 55Fetransferrin was added for 4 hr at 37°C. 55Fe uptake was quenched by chilling the cells on ice. After washing three times with ice-cold PBS, containing 1 mM MgCl2 and 0.1 mM CaCl2 (PBS++), cells were incubated on ice with 40 μg/ml unlabeled Fe-transferrin in 25 mM HEPES, pH 7.4, 150 mM NaCl, and 1 mg/ml BSA for 1 hr to displace surface bound 55Fe-Tf. Cells were then washed three times with ice-cold PBS++ and lysed with solubilization buffer (0.1% Triton X-100, 0.1% NaOH). Cell-associated radioactivity was determined by liquid scintillation counting, and cell protein was measured using the Bradford assay to calculate pmol Fe/mg protein.
125I-Transferrin Cell Surface Binding in Stable Cell Lines
TRVb1 and TRVb-TfR1-PCP cells were grown to 80% confluency in supplemented Hams F12. Cells were chilled on ice for 15 min and washed twice in ice-cold serum-free Hams F12 medium. Cell monolayers were incubated on ice in serum-free Hams F12 medium containing 20 mM HEPES, pH 7.4, 2 mg/ml ovalbumin, and 0.05–500 nM 125I-transferrin with or without 2.5 μM unlabeled Tf. After incubation on ice for 2 hr, cells were washed 4 times with PBS++ and lysed with solubilization buffer. Cell-associated radioactivity was measured by γ counting. To calculate specific cell surface binding, the amount of radioactivity associated with the cells in the presence of unlabeled ligand was subtracted from values obtained in the presence of labeled ligand alone. Data were normalized to maximal values measured at 500 nM 125I-transferrin for each cell line.
Transient Transfection
For each 35 mm well in a 6-well plate, one vial of tranfection medium was prepared, containing 3 μl of FuGENE 6 transfection reagent (Roche Diagnostics Corporation) and 1 μg of the relevant plasmid diluted in 100 μl of a 1:1 mixuture of Dulbecco minimal essential media and Hams F12. Transfection medium was mixed well and allowed to sit for 20 min to come to equilibrium. TRVb cells were grown on sterilized coverslips to 50%–60% confluency, incubated with transfection medium for 5 hr, and then incubated in regular cell media (with serum) for 24 hr to allow time for protein expression.
Live-Cell Fluorescent Labeling of TfR1-PCP
Cells transfected with TfR1-PCP were incubated in serum-free media for 2 hr prior to labeling. To label TfR1-PCP, cells were then incubated with 0.5 μM Sfp and 1 μM CoA-Alexa Fluor 488 (2) in serum-free media for 30 min at 37°C. Labeled cells were washed three times with PBS and reimmersed in media. If needed, cells were then incubated with 10 μg/ml Alexa Fluor 568-conjugated transferrin (Molecular Probes Inc.) for various time periods and washed three times with PBS. Cells were then fixed using a 3.7% formaldehyde solution in PBS, and mounted with SlowFade Antifade Kit (Molecular Probes Inc.) for optical microscopy studies.
Confocal Fluorescence Imaging and FRET Analysis
Confocal microscopy analysis of samples was performed using a Nikon TE2000U inverted microscope in conjunction with a Perkin-Elmer Ultraview spinning disk confocal system equipped with a Hamamatsu Orca ER Cooled-CCD camera. Images were acquired using a 60× differential interference contrast (DIC) oil immersion objective lens, and analyzed using Metamorph software from Universal Imaging, Inc (Molecular Devices, Downingtown, PA). Where applicable, images were processed by MetaMorph using 2D no neighbors deconvolution before 3D reconstruction. For FRET measurements, two images were acquired in each field of view in the Alexa Fluor 488 (donor) and Alexa Fluor 568 (acceptor) channels using laser confocal microscopy. The field was then bleached with intense light at 568 nm from an Hg arc lamp for 60 s, and a second set of images were acquired. The four images were then processed and relative FRET intensities were calculated based on protocols previously described [26]. Experiments were performed three times with equivalent results, and representative images are shown.
Acknowledgments
We thank Dr. Christopher W. Cairo for many helpful discussions. Confocal microscopy was performed in the Nikon Imaging Center at Harvard Medical School. This work was supported by grants DK056160 and DK064750 to M.W.R., HL32854 and HL070819 to D.E.G., and GM20011 to C.T.W. from the National Institutes of Health.
References
- 1.Tsien RY. The green fluorescent protein. Annu. Rev. Biochem. 1998;67:509–544. doi: 10.1146/annurev.biochem.67.1.509. [DOI] [PubMed] [Google Scholar]
- 2.Lippincott-Schwartz J, Patterson GH. Development and use of fluorescent protein markers in living cells. Science. 2003;300:87–91. doi: 10.1126/science.1082520. [DOI] [PubMed] [Google Scholar]
- 3.Michalet X, Pinaud FF, Bentolila LA, Tsay JM, Doose S, Li JJ, Sundaresan G, Wu AM, Gambhir SS, Weiss S. Quantum dots for live cells, in vivo imaging, and diagnostics. Science. 2005;307:538–544. doi: 10.1126/science.1104274. [DOI] [PMC free article] [PubMed] [Google Scholar]
- 4.Srinivasan R, Yao SQ, Yeo DS. Chemical approaches for live cell bioimaging. Comb. Chem. High Throughput Screen. 2004;7:597–604. doi: 10.2174/1386207043328463. [DOI] [PubMed] [Google Scholar]
- 5.Guignet EG, Hovius R, Vogel H. Reversible siteselective labeling of membrane proteins in live cells. Nat. Biotechnol. 2004;22:440–444. doi: 10.1038/nbt954. [DOI] [PubMed] [Google Scholar]
- 6.Farinas J, Verkman AS. Receptor-mediated targeting of fluorescent probes in living cells. J. Biol. Chem. 1999;274:7603–7606. doi: 10.1074/jbc.274.12.7603. [DOI] [PubMed] [Google Scholar]
- 7.Miller LW, Sable J, Goelet P, Sheetz MP, Cornish VW. Methotrexate conjugates: a molecular in vivo protein tag. Angew. Chem. Int. Ed. Engl. 2004;43:1672–1675. doi: 10.1002/anie.200352852. [DOI] [PubMed] [Google Scholar]
- 8.Griffin BA, Adams SR, Tsien RY. Specific covalent labeling of recombinant protein molecules inside live cells. Science. 1998;281:269–272. doi: 10.1126/science.281.5374.269. [DOI] [PubMed] [Google Scholar]
- 9.Stroffekova K, Proenza C, Beam KG. The protein-labeling reagent FLASH-EDT2 binds not only to CCXXCC motifs but also non-specifically to endogenous cysteine-rich proteins. Pflugers Arch. 2001;442:859–866. doi: 10.1007/s004240100619. [DOI] [PubMed] [Google Scholar]
- 10.Keppler A, Gendreizig S, Gronemeyer T, Pick H, Vogel H, Johnsson K. A general method for the covalent labeling of fusion proteins with small molecules in vivo. Nat. Biotechnol. 2003;21:86–89. doi: 10.1038/nbt765. [DOI] [PubMed] [Google Scholar]
- 11.Chen I, Howarth M, Lin W, Ting A. Site-specific labeling of cell surface proteins with biophysical probes using biotin ligase. Nat. Methods. 2005;2:99–104. doi: 10.1038/nmeth735. [DOI] [PubMed] [Google Scholar]
- 12.Yin J, Liu F, Li X, Walsh CT. Labeling proteins with small molecules by site-specific posttranslational modification. J. Am. Chem. Soc. 2004;126:7754–7755. doi: 10.1021/ja047749k. [DOI] [PubMed] [Google Scholar]
- 13.Yin J, Liu F, Schinke M, Daly C, Walsh CT. Phagemid encoded small molecules for high throughput screening of chemical libraries. J. Am. Chem. Soc. 2004;126:13570–13571. doi: 10.1021/ja045127t. [DOI] [PubMed] [Google Scholar]
- 14.La Clair JJ, Foley TL, Schegg TR, Regan CM, Burkart MD. Manipulation of carrier proteins in antibiotic biosynthesis. Chem. Biol. 2004;11:195–201. doi: 10.1016/j.chembiol.2004.02.010. [DOI] [PubMed] [Google Scholar]
- 15.George N, Pick H, Vogel H, Johnsson N, Johnsson K. Specific labeling of cell surface proteins with chemically diverse compounds. J. Am. Chem. Soc. 2004;126:8896–8897. doi: 10.1021/ja048396s. [DOI] [PubMed] [Google Scholar]
- 16.Jares-Erijman EA, Jovin TM. FRET imaging. Nat. Biotechnol. 2003;21:1387–1395. doi: 10.1038/nbt896. [DOI] [PubMed] [Google Scholar]
- 17.Morgan EH. Transferrin, biochemistry, physiology and clinical significance. Mol. Aspects Med. 1981;4:1–123. [Google Scholar]
- 18.Wessling-Resnick M. Iron transport. Annu. Rev. Nutr. 2000;20:129–151. doi: 10.1146/annurev.nutr.20.1.129. [DOI] [PubMed] [Google Scholar]
- 19.Klausner RD, Ashwell G, van Renswoude J, Harford JB, Bridges KR. Binding of apotransferrin to K562 cells: explanation of the transferrin cycle. Proc. Natl. Acad. Sci. USA. 1983;80:2263–2266. doi: 10.1073/pnas.80.8.2263. [DOI] [PMC free article] [PubMed] [Google Scholar]
- 20.Richardson DR, Ponka P. The molecular mechanisms of the metabolism and transport of iron in normal and neoplastic cells. Biochim. Biophys. Acta. 1997;1331:1–40. doi: 10.1016/s0304-4157(96)00014-7. [DOI] [PubMed] [Google Scholar]
- 21.Fuchs H, Lucken U, Tauber R, Engel A, Gessner R. Structural model of phospholipid-reconstituted human transferrin receptor derived by electron microscopy. Structure. 1998;6:1235–1243. doi: 10.1016/s0969-2126(98)00124-5. [DOI] [PubMed] [Google Scholar]
- 22.Lawrence CM, Ray S, Babyonyshev M, Galluser R, Borhani DW, Harrison SC. Crystal structure of the ectodomain of human transferrin receptor. Science. 1999;286:779–782. doi: 10.1126/science.286.5440.779. [DOI] [PubMed] [Google Scholar]
- 23.Cheng Y, Zak O, Aisen P, Harrison SC, Walz T. Structure of the human transferrin receptor-transferrin complex. Cell. 2004;116:565–576. doi: 10.1016/s0092-8674(04)00130-8. [DOI] [PubMed] [Google Scholar]
- 24.Robb AD, Ericsson M, Wessling-Resnick M. Transferrin receptor 2 mediates a biphasic pattern of transferrin uptake associated with ligand delivery to multivesicular bodies. Am. J. Physiol. Cell Physiol. 2004;287:C1769–C1775. doi: 10.1152/ajpcell.00337.2004. [DOI] [PubMed] [Google Scholar]
- 25.McGraw TE, Greenfield L, Maxfield FR. Functional expression of the human transferrin receptor cDNA in Chinese hamster ovary cells deficient in endogenous transferrin receptor. J. Cell Biol. 1987;105:207–214. doi: 10.1083/jcb.105.1.207. [DOI] [PMC free article] [PubMed] [Google Scholar]
- 26.Jobin CM, Chen H, Lin AJ, Yacono PW, Igarashi J, Michel T, Golan DE. Receptor-regulated dynamic interaction between endothelial nitric oxide synthase and calmodulin revealed by fluorescence resonance energy transfer in living cells. Biochemistry. 2003;42:11716–11725. doi: 10.1021/bi035066w. [DOI] [PubMed] [Google Scholar]