Abstract
Conformational entropy makes important contribution to the stability and folding of RNA molecule, but it is challenging to either measure or compute conformational entropy associated with long loops. We develop optimized discrete k-state models of RNA backbone based on known RNA structures for computing entropy of loops, which are modeled as self-avoiding walks. To estimate entropy of hairpin, bulge, internal loop, and multibranch loop of long length (up to 50), we develop an efficient sampling method based on the sequential Monte Carlo principle. Our method considers excluded volume effect. It is general and can be applied to calculating entropy of loops with longer length and arbitrary complexity. For loops of short length, our results are in good agreement with a recent theoretical model and experimental measurement. For long loops, our estimated entropy of hairpin loops is in excellent agreement with the Jacobson–Stockmayer extrapolation model. However, for bulge loops and more complex secondary structures such as internal and multibranch loops, we find that the Jacobson–Stockmayer extrapolation model has large errors. Based on estimated entropy, we have developed empirical formulae for accurate calculation of entropy of long loops in different secondary structures. Our study on the effect of asymmetric size of loops suggest that loop entropy of internal loops is largely determined by the total loop length, and is only marginally affected by the asymmetric size of the two loops. Our finding suggests that the significant asymmetric effects of loop length in internal loops measured by experiments are likely to be partially enthalpic. Our method can be applied to develop improved energy parameters important for studying RNA stability and folding, and for predicting RNA secondary and tertiary structures. The discrete model and the program used to calculate loop entropy can be downloaded at http://gila.bioengr.uic.edu/resources/RNA.html.
I. INTRODUCTION
Accurate assessment of the free energy of secondary structures of RNA molecules is essential for understanding the stability and function of this important class of biomolecules. It is the basis of RNA secondary structure predictions,1 and is also important for RNA tertiary structure predictions. Numerous experiments have been carried out to measure the free energy contributions of important structural features,1–6 including base stacking, base pair closing, first mismatch of base pairing, asymmetric terms, and coaxial stacking. Although enthalpic and entropic contributions of base-paired stem regions can now be well accounted for by the nearest-neighbor models and experimentally measured parameters, and theoretical models for simple RNA oligomers work well,1 the evaluation of entropic cost of loops remains challenging.
For larger RNA molecules, loop regions such as hairpins, bulges, internal loops, and helical junctions (or multibranched loops) (see Fig. 1) are ubiquitous and play central roles in forming RNA secondary structures.5–7 Frequently, they are also important for RNA functions.7–9 However, little is known about the entropic cost of the loop regions, especially when loops are long and when multibranched loops form.4 An analysis of a database containing 246 RNA structures shows that instead of engaged in base pairing, 46% of the nucleotides remain as single strands forming different types of loops.10 Therefore, substantial improvements in RNA structure prediction is likely to require that the entropic cost of forming such loops be calculated or measured accurately.
FIG. 1.
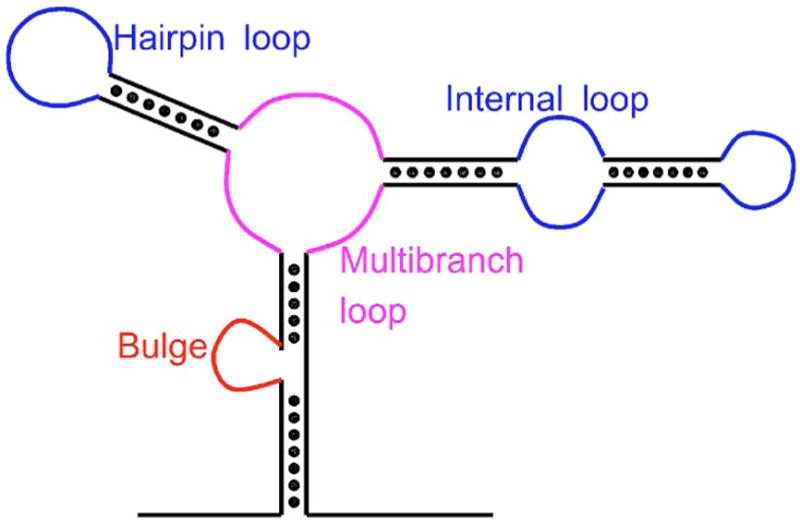
(Color online) A schematic diagram showing RNA secondary structures of hairpin, bulge, internal, and multibranch loops.
Experimental measurement of loop entropy is difficult. First, a phenomenological model is needed with which to fit observed data, and the accuracy will depend on whether all important physical factors are incorporated in the model. Parameters for estimating multibranch loop entropy are especially problematic, as they are currently obtained by a genetic algorithm that optimizes the results of secondary structure predictions. This approach is not based on a physical model and the derived parameters may not reflect accurately the true entropic costs,1 as predicted free energy is frequently less stable than experimentally measured values.5 Second, as the number of nucleotides increases, the number of possible secondary structures also grows rapidly. It becomes increasingly difficult to design sequences that will produce desired conformational transitions and melt in a two-state manner for experimental measurement.5
Previous theoretical models for free energy estimations of RNA secondary structures use simplified assumptions for the loop conformational entropies. For example, loop entropy is assumed to depend on the loop sizes linearly for multibranched loops in Ref. 11. A polymer principle based statistical mechanical model was developed based on square and cubic lattice chain conformations,12–15 and gave good estimation of folding thermodynamics of secondary structures.12 An important recent advance is the development of a method for calculating loop entropy based on a virtual bond representation of RNA backbone.16 This method considers excluded volume and is based on the enumeration of all possible self-avoiding walks on a diamond lattice with fixed ends at the stem terminus of an RNA structure.16 For loops up to length of 9, the calculated loop entropy of hairpins, bulges, and internal loops has excellent agreement with the experimental results. However, for loops of longer length, enumeration becomes infeasible due to the exponentially increasing size of conformational space.17 In these cases, one has to use an empirical extrapolation formula.16 However, it is validity and applicability is untested.
In this work, we develop a method for estimating entropy of secondary structures of RNA molecules with long loops. We first develop an optimized discrete k-state virtual bond model that faithfully represents RNA backbone conformations. It is derived from an analysis of RNA backbone rotamers. We then develop an efficient sampling method based on the sequential Monte Carlo principle to estimate the entropy of RNA loops in hairpins, bulges, internal loops, and multibranch loops. Our model has the advantage that it incorporates excluded volume effect, and can calculate the entropy of loops of arbitrary complexity and of very long length (up to 50 in this study) without resorting to extrapolations. Here, we aim to compute conformational entropy and assume that the entire loop is unattached and there is no intraloop base stacking. Furthermore, by increasing the number of states or using different rotamers libraries in different structural regions, our model can be adjusted conveniently to improve accuracy, which enables us to take full advantage of such discrete models. This would be impossible for lattice models. Our work provides a basis for both RNA structure representation and for entropy estimation, which we believe will also be useful for RNA tertiary structure predictions.
We organize our papers as follows: we first describe the optimized k-state virtual bond model for RNA backbones and our sampling method. In the results section, we discuss the estimated values of loop entropies of various secondary structures, and derive empirical formulae that predicts loop entropy accurately. We conclude with as short discussion.
II. METHODS
A. Database
The RNA05 database from Duke University is used in this work.18 This database contains 172 RNA structures with total 9 486 nucleotides. These structures are selected from the Nucleic Acid Database (NDB, Feb 2005 version), with resolution of 3.0 Å or better.19 We further remove nucleotides that have steric overlaps with other nucleotides, as identified by the MOLPROBITY web server also at Duke University. The remaining 156 structures with total 4 773 nucleotides are used in this study.
B. Virtual bond representation and discrete k-state model
We use the virtual bond representation to describe the RNA backbone conformation.16,20 Here we consider two effective virtual bonds that connect atoms P–C4 and atoms C4–P (Fig. 2), and their torsion angles along the backbone, θ and η. The angles in one “suite,” namely, the stretch between two consecutive C4 atoms, are combined as a (θ,η) pair. Here, we use suite instead of residue (the stretch between two phosphorus atoms) as a basis for describing RNA chains. There are two considerations: (1) RNA structures are determined largely by base interactions, in patterns that make the relative positioning of successive bases the dominant factor connecting local conformation with larger motifs. This relationship between successive bases is reliably and accurately seen even at low resolution and therefore makes a good basis for a robust coarse description of RNA conformation19; (2) 99% atomic steric clashes are between atoms on either side of a phosphorus (and thus within a sugar-to-sugar suite) and only 1% are between atoms on either side of the sugar (and thus within a traditional residue), indicating that the atoms within a suite are most likely to be correlated.19 Following Ref. 19 we use suite as the repeating units of RNA backbone.
FIG. 2.
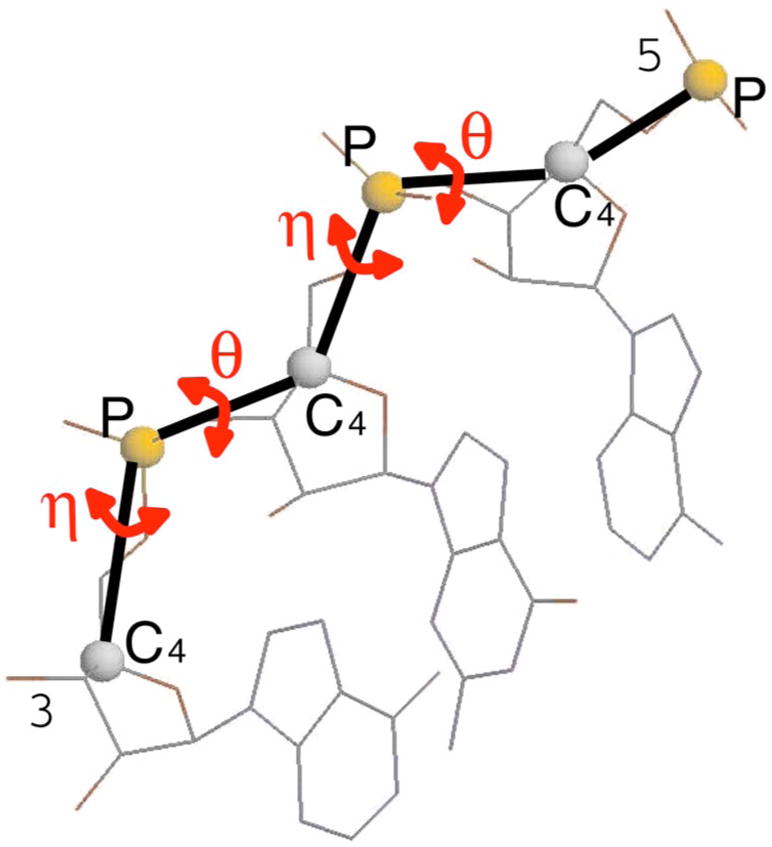
(Color online) The virtual bond representation of RNA backbone. The torsional angles θ and η are calculated and used in the analysis of backbone rotamers.
In a k-state model, a RNA conformation is represented by the sequence of the conformational state of the nucleotides, denoted as Sn = (s1, s2, …, sn), where n is the length of the sequence and si takes the (θ,η) values in one of the k possible states of nucleotides. The virtual bond length is fixed to 3.9 Å and the bond angle at P and C4 atoms are fixed to the value of 105° and 95°, respectively. These values are determined by a k-mean clustering analysis of nucleotide conformations in our structural database, and are the same as reported in a previous work by Cao and Chen.16
To obtain the optimal (θ,η) values to construct our k-state models for RNA conformations, we calculate the torsion angles for all structures in the database and obtain a total of 2 480 pairs of (θ,η) values, each of which corresponds to a point in a two dimensional θ-η plot (Fig. 3). Then we apply the k-mean clustering method to these points and identify the centers of the k clusters. The dissimilarity is defined as the Euclidean distance between two data points whose coordinates are (θ,η). Since the result of k-mean clustering may depend on the initial placement of the center positions, we start with many random different initial positions and select the one that minimize a D value defined as
FIG. 3.
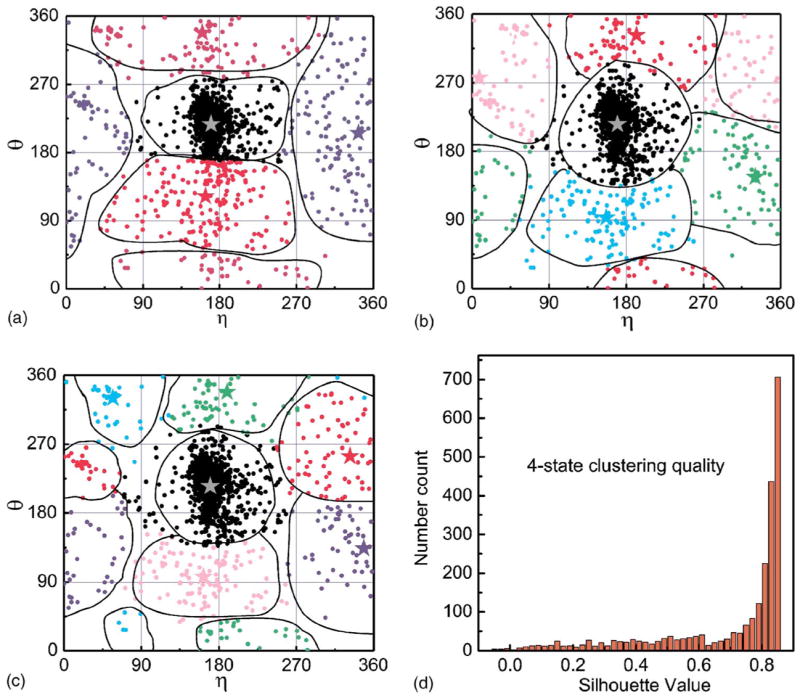
(Color online) The set of (θ,η) angle pairs of clusters in RNA molecules and the centers of k-clusters calculated by the k-mean clustering method. The centers are marked by stars. (a), (b), and (c) are for k=4, 5, and 6 clusters, respectively. (d) shows the distribution of Silhouette value calculated for the 4-state clustering procedure.
where i is the index of the cluster Ci, k is the total number of clusters, and (θ̄,η̄) represents the center of cluster Ci. Note that for both θ and η angels, 0° and 360° are identified, and therefore plots in Fig. 3 are embedded on a torus. The results of k-mean clustering for k=4, 5, and 6 are shown in Fig. 3, and the values of these centers are listed in Table I. Note the first entry in each case corresponds the A-form conformation, which accounts for a large fraction of date points in Fig. 3. We use the cluster centers to represent the discrete k conformational states of RNA nucleotides.
TABLE I.
The values (in degree) of (θ,η) pairs of torsion angles for RNA backbone rotamers in k-state models, where k=4, 5, and 6.
| 4-state model | ||||||
|---|---|---|---|---|---|---|
| θ | 217.3 | 122.0 | 338.2 | 205.6 | ||
| η | 170.0 | 163.4 | 159.7 | 342.7 | ||
| 5-state model
| ||||||
| θ | 215.2 | 332.2 | 276.5 | 146.5 | 93.1 | |
| η | 169.8 | 191.9 | 8.6 | 330.6 | 156.9 | |
| 6-state model
| ||||||
| θ | 215.0 | 254.0 | 96.5 | 338.3 | 330.3 | 134.0 |
| η | 169.9 | 332.4 | 162.4 | 189.5 | 57.1 | 348.4 |
Note that we ignore base- and sequence-dependent information in this study. As indicated in the results section, this approximation is sufficient to model the entropy of unpaired nucleotides. It is straightforward to generalize this and to introduce base-specific and sequence-specific information by treating different nucleotides or di-nucleotides individually, as we have done for proteins,21 provided the database contains enough structural data.
To asses the clustering quality, we adopt the Silhouette value that describes how well each data point is clustered.30 We define a(i) as the average dissimilarity of data point i to all the others in the same cluster A, and d(i, C) the average dissimilarity of i to all data points in cluster C. The dissimilarity is defined as the Euclidean distance of (θ,η) between data points. After computing d(i, C) for all clusters C ≠ A, we select the smallest: b(i) =minC≠Ad(i, C). The cluster B which this minimum is attained is the second-best choice for i. The Silhouette value s(i) can then be calculated as
and
A s(i) value close to +1 indicates that i is well classified, a value close to 0 indicates i lies between two clusters, and a value close to −1 indicates i is poorly clustered. Figure 3(d) shows the distribution of Silhouette value for each data point calculated using the 4-state clustering procedure. It can be seen that most of them (69.8%) have a value larger than 0.7, and a very small fraction (0.6%) have a value less than zero. The 5-state and 6-state clustering procedures give similar results thus are not presented. The distribution of Silhouette values suggests that the clustering quality is generally good.
Using a real chain representation, Murthy et al. performed grid search of all possible conformers using the criteria of hard sphere steric exclusion, and developed a comprehensive conformational map of RNA rotamers, which correlates well with data obtained from x-ray crystallography of both large and small RNA molecules.31 Although we use different representation for the RNA chain and the results cannot be directly compared, some common features can be seen. For example, the first peak βγI in their β-γ plot and the plateau region in their γ-ε plot shown in Ref. 31 correspond to the central cluster in our θ-η plot. This cluster corresponds to the A-form conformation of RNA, and accounts for a large fraction of the conformations of nucleotides in known RNA structures.
C. Stem libraries of RNA hairpins and bulges
For RNA molecules, the conformation of a loop is constrained by the stem (also termed helix) it is connected to. These constraints are characterized by specific allowed values of bond length, bond angle and torsion angle. Different stem conformation will impose varying degree of constraint, leading to different values of loop entropy. This effect is especially pronounced for short loops. In experimental studies, as the conformation of a stem fluctuates at a finite temperature, the measured entropy is effectively an average over all possible stem conformations sampled within the experimental time scale. To account for this effect and to facilitate direct comparison with experimental results, we construct a library of stem conformations to constrain the loop conformations and to calculate average entropy values.
Specifically, we examine the RNA05 database and select 16 representative hairpin structures, with loop length equally distributed from three to ten. We then map these structures to our discrete models, collect the positions of the last two nucleotide pairs in the stem that close the hairpin loop. The coordinates of the nucleotide pairs are then stored in the stem library. This stem library is used in the calculation of entropies of hairpin loops, internal loops, and multibranch loops. We find this size of library is sufficient for loop entropy calculation, especially for long loops which we are mostly interested in. We also construct a bulge stem library using similar procedure, which is composed of 16 different helical conformations that close a bulge. The bulge stem library is used in the calculation of bulge loop entropy.
D. Loop entropy and enumeration
For a loop of length n, where n is the number of unpaired nucleotides, its entropy is defined as
| (1) |
where Ωcoil is the number of all possible conformations of a coil of length n, and Ωloop is the number of loop conformations that are compatible with the stem that closes the loop. That is, the bond lengths, bong angles, and torsion angles near the region of stem-loop connection are located in the allowed regions.
Using the discrete k-state model, we can enumerate all possible backbone loop conformations as self-avoiding walks for moderate chain length, provided that the conformations of the two stems this loop connects to are given. This can be also used to study multibranched loops. Without lost of generality, we take the three-way multibranch loop as an example to illustrate how the enumeration procedure works. Overall, we grow sequentially the three loops from the 5′ end to the 3′ end, and add stems along the way when needed. It is necessary to select a hairpin stem conformation and decide on its oreintation for the growing chain to be connected to it. Once the stem conformations and orientations are fixed, the loop entropy in the k-state model can be calcuated exactly by enumeration. We start enumeration by randomly choosing a hairpin stem from the stem library. Starting from this stem, we grow the first loop by enumerating all possible conformations of specified length. We then randomly select another hairpin stem with replacement from the stem library, and then select one orientation from several possible ones, translate and rotate it so it is connected to the 3′ terminal of the first loop. Due to the discrete nature of the model, the number of orientations that is compatible with the 3′ terminal of the first loop is finite, usually a few. After which we then grow the second loop, until it reaches the specified length. We then add the third stem, and continue to grow the third loop. After the third loop is grown, we count the number of conformations whose 3′ end is spatially compatible with the first stem where the growth began and calculated loop entropy using Eq. (1). The chain is said to be compatible if the values of the bond length and bond angle are between 1/1.03 and 1.03 times their value specified earlier. The torsion angle in the 6-state model must be within (60, 60, 40, 45, 30, 45) in mod Euclidean distance to the six cluster centers on the plane of (θ,η), respectively. The final entropy is obtained by averaging over several independent runs of this process to account for the randomness in the selection of stem and stem orientation. For short loops (n ≤ 10), there is a large variation in calculated loop entropy, and it is necessary to repeat the process many times. However, the repetition needed decreases rapidly as loop length increases from 1 to 10. For long loops where the number of chain conformation is large, we find that the entropy calculated is independent of the stem conformation and orientation, and therefore few or no repetition is needed. In the calculation of bulge entropy, we use the same procedure except the library of bulge stem is used.
For hairpin loops, we can enumerate all possible loop conformations for chains of length up to 21 using the 4-state model, 18 for both 5- and 6-state models. However, as loop length further increases, the number of conformations increases exponentially and exhaustive enumeration becomes infeasible. In this case, we develop an efficient sampling method based on sequential Monte Carlo to overcome this difficulty.
E. The sequential Monte Carlo method
The sequential Monte Carlo method has been applied in previous studies.17,22,23 Here we give a brief description. The idea is combining chain growth and sequential importance sampling. During the growing process, one generates a set of properly weighted conformations with respect to a target distribution and keeps the correct weights of the conformations. The following scheme illustrates our algorithm:
Initialization. We set the initial sampling size to m1 =1, with weight . At step t−1, we have mt−1 partial conformations with corresponding weights, denoted as .
Chain growth. For each partially grown conformation , we exhaustively test all possible attachments of the next nucleotide, with a total of different possibilities. This will generate no greater than k different partial conformations of length t, , with temporary weights . We denote all such samples generated as , where .
-
Resampling. If L≤m, the upper bound of Monte Carlo sample size, we keep all of the samples and their corresponding weights and set mt = L. If L >m, we use the resampling procedure of Fearnhead and Clifford24 to choose mt = m distinct samples with marginal probabilities proportional to a set of priority scores . The steps of this resampling procedure are as follows:
Find the constant value c satisfying .
Choose a subset of distinctive members J1, J2, …, Jm from the set {1, …, L} so that the marginal probability for the l-th sample to be selected is equal to . One way to achieve this is to (i) draw U0 ~ Unif[0,1], and let Uj = j − U0, for j=1, …, m; and (ii) choose Jj = l if p0 + … + pl−1 < Uj ≤ p1 + … + pl, for l =1, …, L and P0 =0.
Let , and update the new weight as .
Estimation. When the target loop length n is reached, Ωcoil is estimated as , where mn is the number of samples at length n, is the importance weight of samples , and is the identity function of 1.
In order to illustrate the sequential Monte Carlo Method more clearly, we give a flowchart in Fig. 4.
FIG. 4.
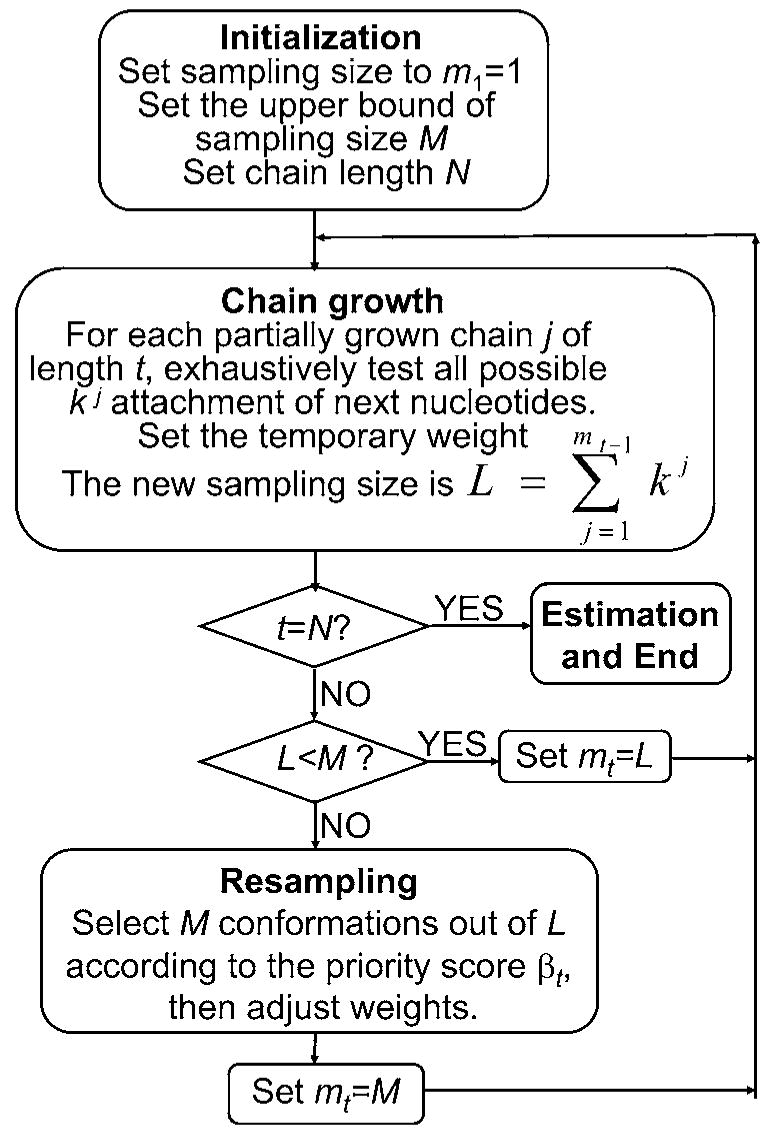
The flowchart showing the SMC sampling algorithm.
An advantage of the above resampling method over previous sequential Monte Carlo method25 and pruning-enrichment approach26 is that it guarantees to generate distinctive conformations. The priority score βt(St) can be understood intuitively as a measure of the chain’s “growth perspective,” and is used here to encourage the growth of chain St to specific directions. In this study we use a simply priority score,
where r=|rt − r0| is the distance between the nucleotides grown at step t and the first stem where the growth began. Here R=b(n−t), and b=3.9 Å is the bond length, n the target loop length, and w is a constant that controls the sharpness of the function. This priority score gives high weights thus high surviving probability to those chains that may reach r0 in subsequent steps, and eliminate those chains that are impossible to do so.
III. RESULTS
A. Effectiveness of discrete k-state model for RNA
To evaluate how well the discrete k-state model can represent RNA structures, we map an RNA structure in the continuous space to a structure in the discrete space, requiring that the mapped structure has the least root mean square deviation (RMSD) with respect to the structure in continuous space. Here, we use a heuristic buildup algorithm first introduced by Park and Levitt.27,28 We have mapped all 172 RNA structures in our database to structures in the discrete space. The chain length ranges from 2 to 156, with the exceptions of a 23S rRNA, which has a length of 2 754, and a 16s rRNA of length of 1 494. Using the optimized 4-, 5-, and 6-state models, we find that the RMSD values are small, most of which range from 0.2 to 4.0 Å, with seven exceptions ranging between 4.0 and 5.0 Å. The RMSDs for the two very long rRNAs are ~4.5, ~4.2, and ~4.0 Å for the 4-, 5-, and 6-state models, respectively. We also find that the RMSD distance depends weakly on the number of states, and the average over all structures are 2.2, 2.2, and 2.1 Å for 4-, 5-, and 6-state models, respectively. Overall, our k-state models work well.
B. Effectiveness of sequential Monte Carlo sampling method
To evaluate the performance of our sampling method, we compare the estimated loop entropy values with the exact values obtained by exhaustive enumerations. Figure 5 shows the entropies of hairpin loops calculated using 4-, 5-, and 6-state models. The estimated values are essentially indistinguishable from the exact values for all 4-, 5-, and 6-state models, indicating that our sampling method is accurate. The advantage of our sampling method is that we are no longer limited to short loops and can compute entropies of very long loops.
FIG. 5.
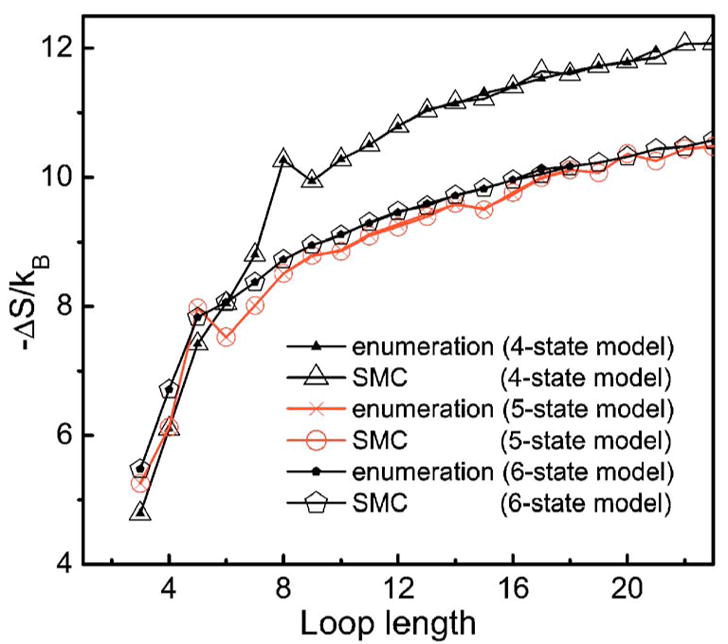
(Color online) Comparison of loop entropies calculated by exhaustive enumeration and estimated by sequential Monte Carlo (SMC) sampling method using the 4-state, 5-state, and 6-state model. They are essentially indistinguishable, suggesting that our sampling method works well.
It can also be seen that the entropy calculated by the 4-state model is much smaller than that by 5- and 6-state model, and is also much smaller than that derived from experiments, especially for long loops. This is likely due to the lack of chain flexibility in 4-state model and the concomitant difficulties in modeling the closure of the loops. Therefore, we will dispense with entropy calculated using 4-state model in the following discussions.
C. Loop entropies of RNA secondary structures
1. Entropy of RNA secondary structures with short loops
We compare our estimated entropy values of hairpin, bulge, and internal loops with experimentally measured values at short loop length (n≤10, Fig. 6). The model used in the calculation is the 6-state model. The experimental data are taken from Ref. 2.
FIG. 6.
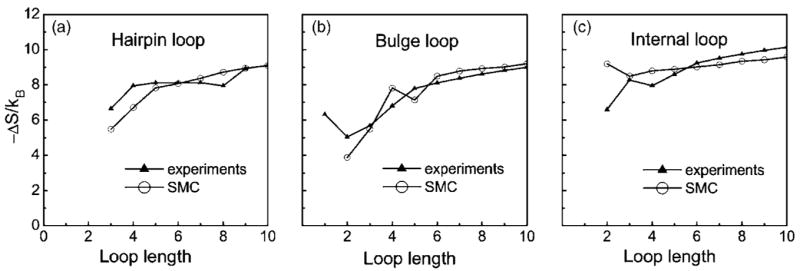
The calculated entropies of hairpin, bulge and internal loops and the corresponding experimental values. The model used in calculation is the 6-state model. All the three figures are plotted with the same scale, which is also the same with that used in Ref. 16 to facilitate comparison with the previous theoretical model.
As shown in Fig. 6, there is a general good agreement between calculated and measured entropy values, although the agreement is not perfect. One possible reason is that experimentally measured loop entropy can be sequence dependence due to possible mismatched intraloop base stackings, while such contributions to the entropy is ignored in our calculations, similar to the study of Cao and Chen.16
We also compare our results with that of a recent theoretical model by Cao and Chen.16 Using virtual bond representation for RNA backbones and enumeration of all possible self-avoiding walks on a diamond lattice model, Cao and Chen calculated the entropy values for hairpin loops, bulges, and internal loops.16 These entropy calculations are shown to lead to impressively accurate predictions of the thermal denaturation curves, the equilibrium folding/unfolding pathways, and the native structures of RNA molecules. Comparison of the loop entropies calculated using our 6-state model (Fig. 6) with that of Ref. 16, we find that the agreement of our results with experiments is comparable to that described in Ref. 16, indicating the usefulness of our method in calculating RNA entropy important for predicting RNA secondary structures.
2. Extrapolated entropy of RNA secondary structures with long loops
The main focus of our study is to estimate entropy of secondary structures with long loops. Our approach not only gives comparable results of entropy at short length, but also can estimate entropy values of long loops of arbitrary complexity. We have calculated the entropy of hairpin, bulge, internal loops, three-way, and four-way multibranch loops, all with long loop length, which will be discussed in detail in later sections.
Because there is no direct measurement of entropy of long loops when n>9, we compare our results with a phenomenological model that calculates loop entropy by extrapolating measured entropy values at length nmax, where nmax=9, 5, and 6 for hairpin, bulge, and internal loops, respectively. This extrapolation model is based on the treatment of Jacobson and Stockmayer,1,29
| (2) |
3. Entropy of RNA hairpins with long loops
Figure 7 shows the calculated loop entropy for hairpin loops of length of 3–50 and the corresponding extrapolated values. For hairpin loops of length n>10, the estimated loop entropy is in excellent agreement with extrapolated values, regardless whether the 5-or the 6-state model is used. This suggests that the extrapolation formula provides very accurate estimation for the entropy of long hairpin loops. The estimated values using the 5-state model is very similar to that using the 6-state model, suggesting that our 5-state model is sufficiently accurate for modeling RNA loop entropy (Fig. 7).
FIG. 7.
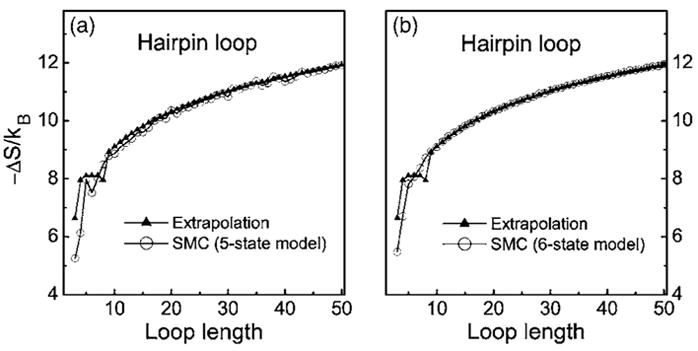
Comparison of the hairpin loop entropies calculated by 5- and 6-state models and the extrapolated values (note that the values at n≤9 are determined by experiments). The curve calculated by 6-state model is smoother than that by 5-state model because the calculation are repeated many times to ensure the relative standard error is less than 1%.
4. Entropy of RNA bulges with long loops
Figure 8 shows the estimated entropy values of bulge loops and corresponding extrapolated values. In general, the estimated entropy values agree with extrapolated values, especially for the 6-state model. The discrepancy is less than 0.5kB, rresponding to a free energy of 0.3 kcal/mol at 37 °C. This is well within experimental errors.1 However, although the discrepancy is rather small, we find the calculated entropy decreases slightly faster than the extrapolated values. To quantify this difference, we fit the calculated entropy −ΔS(n) in Fig. 8 using a phenomenological model for 10<n<50. In this case, data at shorter length are not used, as our interests are in the behavior of long loops. This leads to the following empirical formula:
| (3) |
where c=1.85, which determines the decreasing slope of the loop entropy as length increases. −ΔS(10) is used as a free parameter, and the best fit gives a value of −ΔS(10) =9.2kB. The coefficient c of the second term is larger than the value of 1.75 in the model of Jacobson and Stockmayer. This larger decreasing rate may be due to the stricter conformational constraint imposed by the helix that close the bulge loop, relative to the constraints in hairpin loops. In fact, the average end to end distance that is used to constrain loops, determined from the atom positions stored in our hairpin and bulge stem libraries, is 15.1 and 11.9 Å for hairpin and bulge loops, respectively. This represents a significant difference.
FIG. 8.
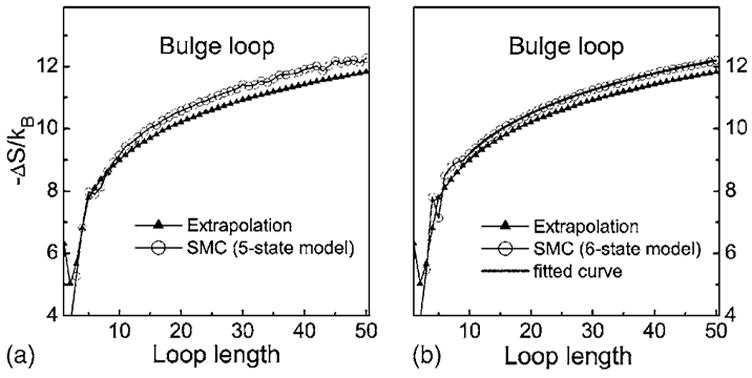
Comparison of the bulge loop entropies calculated by 5- and 6-state models and the extrapolated values (the values for n≤5 are determined by experiments). The entropy calculated by 4-state model is not shown because it is significantly smaller than the extrapolated value, similar to the case of hairpin loop. The fitted curve using Eq. (3) is also shown in (b).
5. Entropy of RNA long internal loops
Figure 9 compares the estimated and extrapolated entropy values of long internal loops. In our calculation, the entropy of loop of length 2n is calculated for a n by n internal loop, and the entropy of length 2n+1 is for a n by n+1 internal loop. This choice is made to eliminate possible asymmetric size effect, which will be fully addressed in a later section. The loop entropy values of n<6 determined by experiment are also plotted along with extrapolated values.
FIG. 9.
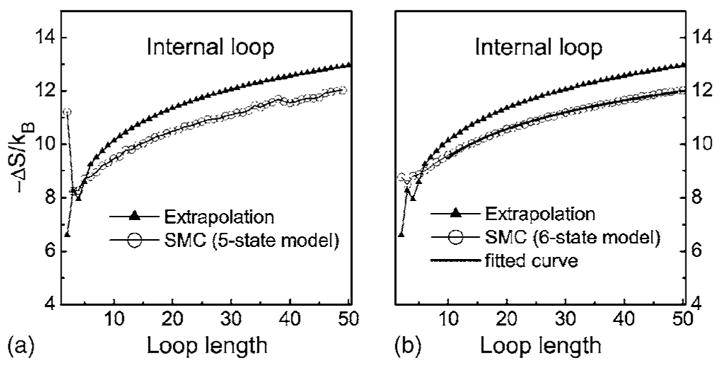
Comparison of the internal loop entropies calculated by 5- and 6-state models and the extrapolated values. The values for n≤6 are determined by experiments. The fitted curve using the empirical model of Eq. (4) is shown in (b).
Although the calculated entropy is in general agreement with experiments for short loops (Fig. 6), the calculated entropies are significantly larger than the extrapolated values for long internal loops (Fig. 9). Since the calculated entropy at n=6 is very close to the experimental measurement (with a discrepancy of 0.2kB, or 0.14 kcal/mol at 37 °C, Fig. 5), the large discrepancy for long loops is reflected by the small slope of the curve of the estimated values. A fitting of data between 10<n<50 using an empirical model gives
| (4) |
where c=1.55 and −ΔS(10) =9.5kB. The coefficient c of the second term is smaller than the value 1.75 in the model of Jacobson and Stockmayer, suggesting that as the length of internal loop increases, the entropy decrease slower than what would be expected from the Jackson–Stockmayer model.
6. Entropy of multibranch long loops
Multibranch loops are nearly ubiquitous in RNA molecules and play central roles in forming RNA secondary structures.5,6 However, their free energy and entropy are difficult to measure experimentally, due to possible coaxial stacking effects and the difficulty in designing sequences with desired phase transitions for measurement as the loop lengths increases. Estimating their entropy is well-suited for computational studies. Using the method described earlier, we can calculate the loop entropy of three-way, four-way, or more complicated multibranch loops. Figure 10 shows the calculated entropy for three-way multibranch loops. In our calculation, the entropy of loop of length 3n is calculated from an n by n by n multibranch loop, the loop of length 3n+1 from a n by n by n+1 loop, and 3n+2 from a n by n+1 by n+1 loop, respectively. It is straightforward to compute average entropy values for other combinations.
FIG. 10.
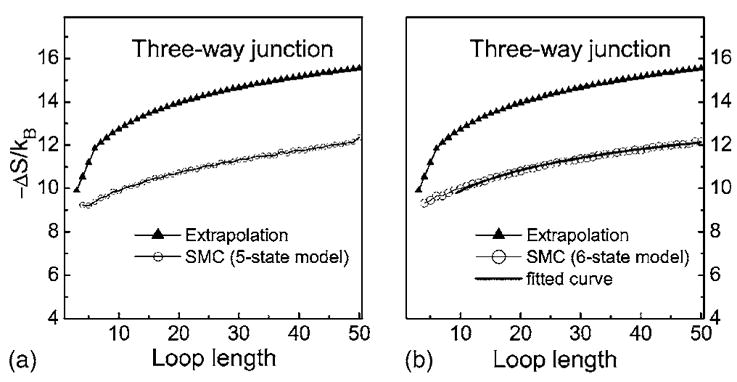
Comparison of the three-way multibranch loop entropies calculated by 5- and 6-state models and the values calculated by the empirical model (see the text). The fitted curve using the empirical model Eq. (5) is shown in (b).
The curve for the extrapolated entropy is calculated as2
and
where h is the number of helices.2 For three-way multibranch loops, h equals 3.
As shown in Fig. 10, the estimated entropy is significantly larger than the extrapolated value, and it increases less rapidly as the loop lengths increase. One possible reason of this discrepancy is that the experimentally used sequences are relatively short, and there are non-negligible possibilities of forming coaxial stacked helices, in which two helices are separated by one or zero unpaired nucleotide. The coaxial stacking will greatly decrease the number of possible conformation of loops, hence reduces loop entropy.
It is possible that the experimentally determined free energy of initiation of multibranch loop is not the pure entropic cost to close the loop, but may include the extra enthalpic and entropic contributions from coaxial stacking. Since our calculation corresponds to the entropy of longer multibranch loops with symmetric length distributions, in this case the coaxial stacking effect becomes impossible.
The estimated entropy of multibranch loops as shown in Fig. 10 can be described by an empirical model,
| (5) |
where c=1.40 and −ΔS(10) =9.9kB. The coefficient c is smaller than the constant c=1.75 for the hairpin loops, and is also smaller than the value c=1.55 for the internal loops.
It seems that as the number of helices increases, the entropy decreases more slowly as loop length increases. To confirm this observation, we calculated the entropy of four-way multibranch loops, and compared it with that of hairpin, bulge, internal, and three-way multibranch loops (Fig. 11). It can be seen clearly that the slope of the entropy curve decreases as the number of helices increases. The coefficient c is 1.75, 1.55, 1.40, and 1.23 for entropy of hairpin loop, internal loop, three-way, and four-way junctions, respectively. The entropy of bulge loop is special as it has the largest slope, possibly due to the stricter constraints imposed by the helical strand it is connected to. The reduced slope of the entropy curves of internal, three-way, and four-way multibranch loops is due to the fact that, in addition to the constraints they impose on the loop conformation, the additional helices also impose constraints to the coil states, decreasing the value of ln Ωcoil in Eq. (1) thus the slope. The Jacobson and Stockmayer treatment fails in these cases because it uses the Gaussian approximation where a loop can adopt any rotation angle and is not restricted by excluded volume. This approximation ignores the constraints imposed by the additional helices, which clearly will deviate from the Gaussian approximation. Overall, Fig. 11 shows that the traditional Jacobson and Stockmayer model only works well for hairpin loops and need to be modified for bulge, internal, and multibranch loops.
FIG. 11.
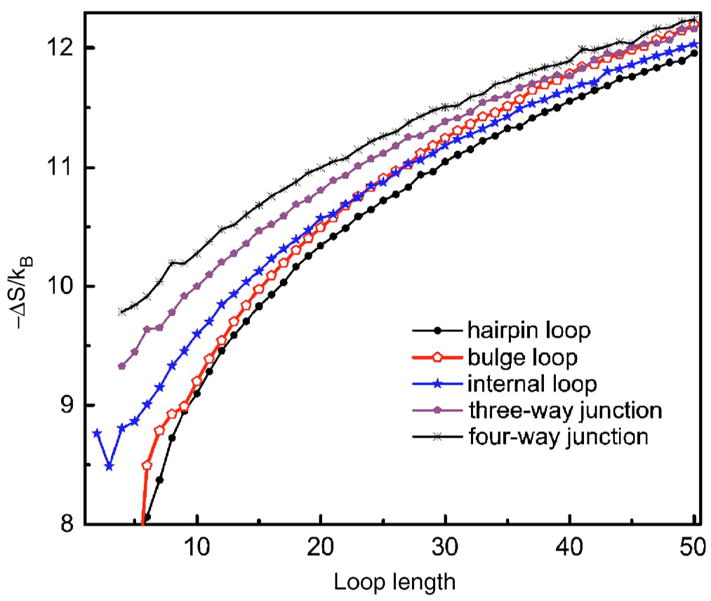
(Color online) Comparison of the calculated entropies of hairpin, bulge, internal, three-way, and four-way multibranch loops. It can be seen clearly that the slope of the entropy curve decreases as the number of helices increases.
7. Effect of size asymmetry
We are also interested in the effect of size asymmetry on loop entropy. We investigate this effect by calculating the entropy for all possible combinations of loop length of internal loops of lengths up to n=50. The result is shown in Fig. 12. It can be seen that the loop entropy is largely determined by the loop length, and the asymmetric distribution of loop length only result in small changes in loop entropy, usually in the order of 0.1kB or 0.06 kcal/mol at 37 °C. This suggests that the two chains in an internal loop are independent of each other, especially when loops are long. Moreover, the asymmetric effect slightly increases the entropy thus the stability, whereas it was found to decrease the stability according to experimental data.1
FIG. 12.
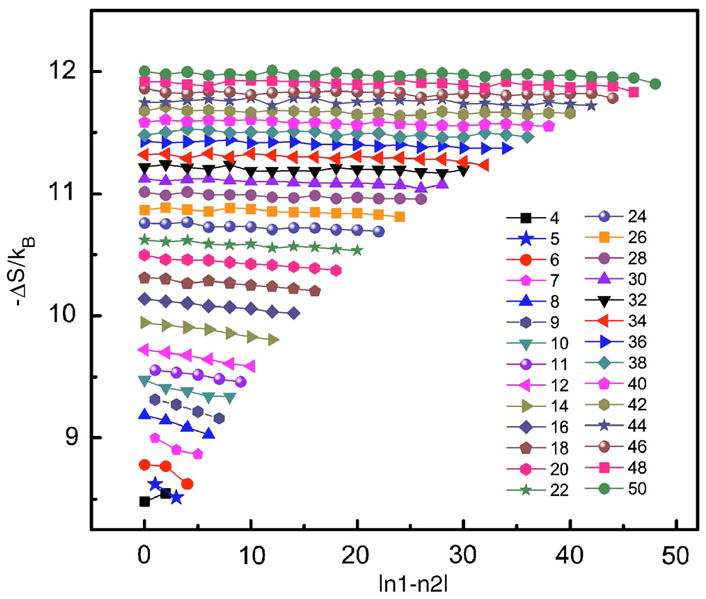
(Color online) The loop entropy as a function of size asymmetry |n1−n2|, calculated for all combinations of loop length of internal loops of lengths n=n1+n2≤ 50. The entropy of loops with odd number of n>11 are not shown in the interest of clear presentation. The data points connected by a line have the same loop length n.
These findings are in contrast to experimental observations, where the asymmetric effect is thought to be large, and a free energy penalty of is usually introduced to account for this effect ( , according to Ref. 1). The source of this discrepancy is likely due to the fact that what is calculated here is purely the entropic change due to asymmetric distributions of loop lengths, whereas in experiments the asymmetric effect is partially enthalpic in nature, arising from possible noncanonical base pairing that tend to form between symmetric loops and therefore make the two chains dependent on each other.6
IV. CONCLUSION
The estimation of free energy of RNA secondary structures is important for understanding RNA stability and folding. Among all physical factors contributing to RNA stability, assessing conformational loop entropy is the most challenging task for both experimental measurement and for theoretical calculations. For example, there is no known experimental measurement of entropy for loops longer than 12 bases. In this work, we have developed optimized discrete k-state models for representing RNA backbone structures, which incorporate the excluded volume effect. Combined with an efficient sequential Monte Carlo sampling method, we have calculated the conformational entropy of various RNA secondary structures with loops, including hairpin, bulges, internal, and multibranched loops. For short loops, entropy is calculated through exhaustive enumeration of self-avoiding walks in the k-state space connecting the two bases at one end of an RNA stem. The main focus of our study is to compute entropy of long loops, which is achieved by using the sequential Monte Carlo sampling method.
Our results for short loops agree well with a recent theoretical study, and is also in good general agreement with experimental results. For long loops, the calculated entropies of hairpin loops are in excellent agreement with the Jacobson–Stockmayer model, which extrapolates from experimental data. However, for internal loop and multibranch loops, we find that the entropy value decreases less than expected from the Jacobson–Stockmayer model as loop length increases. It is because the additional helices impose additional constraints thus distort the assumed Gaussian distribution in the Jacobson–Stockmayer model. For bulge loops, the entropy decreases more, possibly due to the stricter constraints imposed by the helical strand it is connected to. This suggests that the bulge loop and more complex secondary structures including internal loops and multibranched loops require additional modification beyond the Jacobson and Stockmayer model. Based on estimated loop entropy, we have developed empirical formulae for entropy calculations that work well for all these different secondary structures with long loops.
We also studied the asymmetric size effect of loops and find that loop entropy is predominantly determined by the overall loop length, and the asymmetric division of individual loop lengths has small effects on the overall entropy of internal loops. Moreover, the asymmetric effect slightly increases the entropy thus the stability. These findings are in contrast to previous experimental observations. This discrepancy suggests that entropy due to strictly asymmetric size effect is small, and experimentally observed large asymmetric effect is likely to be partially enthalpic in nature.
The approach we developed in this study is general. It provides a basis for both structure representation and entropy estimation. It can be applied to calculate the entropy of loops associated with other RNA spatial structures, such as loops in pseudoknots, loops with base triplets, and loops associated with other tertiary contacts. The improved entropy estimation will be useful for studying RNA stability and folding, and for RNA structure prediction.
Acknowledgments
This work is supported by grants from National Science Foundation (DBI-0646035), National Institute of Health (GM68958 and GM079804), and Office of Naval Research (N00014-06-1-0100). J.Z. and W.W. are also supported by the National Natural Science Foundation of China (90403120, 10504012, and 10704033) and the National Basic Research Program of China (2006CB910302). We acknowledge Shanghai Supercomputer Center for computing resources.
References
- 1.Mathews DH, Sabina J, Zuker M, Turner DH. J Mol Biol. 1999;288:911. doi: 10.1006/jmbi.1999.2700. [DOI] [PubMed] [Google Scholar]
- 2.Serra MJ, Turner DH. Methods Enzymol. 1995;259:242. doi: 10.1016/0076-6879(95)59047-1. [DOI] [PubMed] [Google Scholar]
- 3.Xia T, SantaLucia J, Burkard ME, Kierzek R, Schroeder SJ, Jiao X, Cox C, Turner DH. Biochemistry. 1998;37:14719. doi: 10.1021/bi9809425. [DOI] [PubMed] [Google Scholar]
- 4.Mikulecky PJ, Takach JC, Feig AL. Biochemistry. 2004;43:5870. doi: 10.1021/bi0360657. [DOI] [PMC free article] [PubMed] [Google Scholar]
- 5.Diamond JM, Turner DH, Mathews DH. Biochemistry. 2001;40:6971. doi: 10.1021/bi0029548. [DOI] [PubMed] [Google Scholar]
- 6.Mathews DH, Turner DH. Biochemistry. 2002;41:869. doi: 10.1021/bi011441d. [DOI] [PubMed] [Google Scholar]
- 7.Ban N, Nissen P, Hansen J, Moore PB, Steitz TA. Science. 2000;289:905. doi: 10.1126/science.289.5481.905. [DOI] [PubMed] [Google Scholar]
- 8.Gesteland RF, Cech TR, Atkins Jf, editors. The RNA World. 2. Cold Spring Harbor Laboratory Press; New York: 2005. [Google Scholar]
- 9.Brierley I, Pennell S, Gilbert RJC. Nat Rev Microbiol. 2007;5:598. doi: 10.1038/nrmicro1704. [DOI] [PMC free article] [PubMed] [Google Scholar]
- 10.Dima RI, Hyeon C, Thirumalai D. J Mol Biol. 2005;347:53. doi: 10.1016/j.jmb.2004.12.012. [DOI] [PubMed] [Google Scholar]
- 11.McCaskill JS. Biopolymers. 1990;29:1105. doi: 10.1002/bip.360290621. [DOI] [PubMed] [Google Scholar]
- 12.Chen SJ, Dill KA. J Chem Phys. 1995;103:5802. [Google Scholar]
- 13.Chen SJ, Dill KA. J Chem Phys. 1998;109:4602. [Google Scholar]
- 14.Chen SJ, Dill KA. Proc Natl Acad Sci USA. 2000;97:646. doi: 10.1073/pnas.97.2.646. [DOI] [PMC free article] [PubMed] [Google Scholar]
- 15.Zhang W, Chen SJ. J Chem Phys. 2001;114:7669. [Google Scholar]
- 16.Cao S, Chen SJ. RNA. 2005;11:1884. doi: 10.1261/rna.2109105. [DOI] [PMC free article] [PubMed] [Google Scholar]
- 17.Liang J, Zhang JF, Chen R. J Chem Phys. 2002;117:3511. [Google Scholar]
- 18.See http://kinemage.biochem.duke.edu/databases/rnadb.php for the RNA05 database and MOLPROBITY web server.
- 19.Murray LJW, Arendall WB, III, Richardson DC, Richardson JS. Proc Natl Acad Sci USA. 2003;100:13904. doi: 10.1073/pnas.1835769100. [DOI] [PMC free article] [PubMed] [Google Scholar]
- 20.Duarte CM, Pyle AM. J Mol Biol. 1998;284:1465. doi: 10.1006/jmbi.1998.2233. [DOI] [PubMed] [Google Scholar]
- 21.Zhang JF, Chen R, Liang J. Proteins. 2006;63:949. doi: 10.1002/prot.20809. [DOI] [PubMed] [Google Scholar]
- 22.Zhang JF, Chen Y, Chen R, Liang J. J Chem Phys. 2004;121:592. doi: 10.1063/1.1756573. [DOI] [PubMed] [Google Scholar]
- 23.Zhang JF, Lin M, Chen R, Liang J, Liu JS. Proteins. 2007;66:61. doi: 10.1002/prot.21203. [DOI] [PubMed] [Google Scholar]
- 24.Fearnhead P, Clifford P. J R Stat Soc Ser B (Stat Methodol) 2003;65:887. [Google Scholar]
- 25.Zhang JL, Liu JS. J Chem Phys. 2002;117:3492. [Google Scholar]
- 26.Grassberger P. Phys Rev E. 1997;56:3682. [Google Scholar]
- 27.Park B, Levitt M. J Mol Biol. 1995;249:493. doi: 10.1006/jmbi.1995.0311. [DOI] [PubMed] [Google Scholar]
- 28.Zhang JF, Chen R, Liang J. Proteins. 2006;63:949. doi: 10.1002/prot.20809. [DOI] [PubMed] [Google Scholar]
- 29.Jacobson H, Stockmayer WH. J Chem Phys. 1950;18:1600. [Google Scholar]
- 30.Kaufman L, Rousseeuw PJ. Finding Groups in Data. Wiley; New York: 1990. [Google Scholar]
- 31.Murthy VL, Srinivasan R, Draper DE, Rose GD. J Mol Biol. 1999;291:313. doi: 10.1006/jmbi.1999.2958. [DOI] [PubMed] [Google Scholar]


