Abstract
The pharmacological actions of morphine and morphine-like drugs such as heroin are mediated primarily through the μ opioid receptor. Previously a single strand DNA element of the mouse μ opioid receptor gene (Oprm1) proximal promoter was found to be important for regulating Oprm1 in neuronal cells. To identify proteins binding to the single strand DNA element as potential regulators for Oprm1, affinity column chromatography with the single strand DNA element was performed using neuroblastoma NS20Y cells followed by two-dimensional gel electrophoresis and MALDI-TOF mass spectrometry. We identified five poly(C)-binding proteins: heterogeneous nuclear ribonucleoprotein (hnRNP) K, α-complex proteins (αCP) αCP1, αCP2, αCP2-KL, and αCP3. Binding of these proteins to the single strand DNA element of Oprm1 was sequence-specific as confirmed by supershift assays. In cotransfection studies, hnRNP K, αCP1, αCP2, and αCP2-KL activated the Oprm1 promoter activity, whereas αCP3 acted as a repressor. Ectopic expression of hnRNP K, αCP1, αCP2, and αCP2-KL also led to activation of the endogenous Oprm1 transcripts, and αCP3 repressed endogenous Oprm1 transcripts. We demonstrate novel roles as transcriptional regulators in Oprm1 regulation for hnRNP K and αCP binding to the single strand DNA element.
Opioids are used clinically as potent analgesics but have serious limitations such as tolerance and dependence. The opioid receptors are classified into three major types (δ, κ, and μ) and have been studied by numerous pharmacological reports and by molecular cloning (1, 2). All three types of opioid receptors belong to the superfamily of G-protein-coupled receptors. The μ opioid receptor play roles in morphine-induced analgesia, tolerance, and dependence as indicated by pharmacological studies and analyses of μ opioid receptor gene (Oprm1) knock-out mice (3, 4). Upon binding opioids, the receptor couples to G-proteins and regulates adenylyl cyclase, intracellular calcium, inwardly rectifying potassium channels, mitogen-activated protein kinase, and other messengers, which further trigger a cascade of intracellular events (5).
The μ opioid receptor is expressed mainly in the central nervous system with receptors varying in densities in different regions (and perhaps playing different roles) (6, 7). To achieve this unique spatial expression pattern, expression of Oprm1 must be tightly regulated. The mouse Oprm1 gene spans about 250 kb and consists of multiple exons (8). Several Oprm1 isoforms have been reported (9–11). The upstream open reading frames in Oprm1 mRNA act as negative regulators through a ribosome leaky scanning mechanism (12).
Two different promoters (distal and proximal) of Oprm1 have been reported that are located within 1 kb upstream of the ATG translational start site (13). The distal promoter initiates Oprm1 transcription from a single initiation site located 794 bp upstream of the translation start site. The proximal promoter initiates Oprm1 transcription from four major transcription initiation sites located in a region ranging from 291 to 268 bp upstream of the translation start site. The mouse Oprm1 promoter contains a 5′-distal promoter regulatory sequence: a 34-bp cis-acting element that possesses a strong inhibitory effect against the transcriptional function of the distal promoter (14, 15). Both promoters exhibit characteristics of housekeeping genes lacking a TATA box. The distal promoter is known to be 20-fold less active than the proximal promoter based on quantitative RT-PCR using adult and embryonic mouse brains (16). A 26-bp stretch of a polypyrimidine/polypurine nucleotide region, which is essential for Oprm1 proximal promoter activity, is capable of forming single strand DNA conformation (17). This single strand DNA structure is not present in the promoter region of δ or κ opioid receptor genes. Functional analyses suggested that single strand DNA binding factors/complexes are involved in the regulation of mouse Oprm1 expression (17, 18). Poly(C)-binding protein 1 (PCBP1),1 a single strand DNA binding factor, is involved in regulating Oprm1 expression (19–22). However, the exact identity and functional roles of these single strand DNA binding factors are unclear.
In this study, we used proteomics to identify and characterize single strand DNA-binding proteins that regulate mouse Oprm1 regulation. We used affinity column chromatography containing a specific competitor, two-dimensional gel electrophoresis, and mass spectrometry to purify and identify the factors that interact specifically with the single strand DNA from the Oprm1 proximal promoter region of mouse neuronal NS20Y cells. We identified five proteins, the α-complex proteins (αCPs) αCP1, αCP2, αCP2-KL, and αCP3 and the heterogeneous nuclear ribonucleoprotein (hnRNP) K that bound specifically to the mouse Oprm1 single strand DNA sequence. These proteins serve as transcription regulators in the proximal promoter of mouse Oprm1.
EXPERIMENTAL PROCEDURES
Plasmid Construction and in Vitro Translation—
A luciferase fusion plasmid (pGL450; −450 to +1 bp, relative to the translation start site (+1) of the mouse Oprm1) was generated by ligating the PCR product (−450 to +1) into the SacI and HindIII sites of pGL3-basic (Promega, Madison, WI). PCR was performed using genomic DNA from mouse NS20Y cells as a template and a sense primer (5′-ATTGAGCTCCTGCAGCATCCCCGCTTCTGC-3′) containing a SacI site (underlined) and an antisense primer (5′-ATAAAGCTTTGGTTCTGAATGCTTGCTGCG-3′) containing a HindIII site (underlined). The p340/300 construct was generated by ligating the annealed double oligonucleotide (−340 to −300) into the SacI and HindIII sites of pGL3-basic (Promega). The oligonucleotide sequences were as follows: a sense primer (5′-ATTGAGCTCACAATCCACTCCTTCTCTCTCCTCCCTCCCCTCTAGCCTCTGAAGCTTTTC-3′) containing a SacI site (underlined) and an antisense primer (5′-GAAAAGCTTCAGAGGCTAGAGGGGAGGGAGGAGAGAGAAGGAGTGGATTGTGAGCTCAAT-3′) containing a HindIII site (underlined).
For cloning the hnRNP K, replication protein A32 (RPA32), αCP1, αCP2, αCP2-KL, and αCP3 genes, total RNA was isolated from mouse NS20Y cells. The RNA was treated with RNase-free DNase (Promega) according to the manufacturer's instructions. RT-PCR was performed using the OneStep RT-PCR kit (Qiagen). PCR was performed with primers designed using the gene sequence information for each protein: hnRNP K (GeneID 13384619): 5′-TTGCGGCCTATTGGTGGAT-3′ (sense) and 5′-AAACTTTCCAGAATACTGCTT-3′ (antisense); RPA32 (GeneID 2498846): 5′-ACCAGGATGGCGAATAGCGGATTC-3′ (sense) and 5′-CTCTGCATCTGTAGACTTAAAGTG-3′ (antisense); αCP1 (GeneID 13435897): 5′-CCATGGACGCCGGTGTGACTGA-3′ (sense) and 5′-GCTGCACCCCATCCCCTTCTC-3′ (antisense); αCP2 (GeneID 6997238) and αCP2-KL: 5′-AACTGCTAGACATGGACACCG-3′ (sense) and 5′-AGGTGGCATGGGTAGCAGCTAG-3′ (antisense); and αCP3 (GeneID 10947013): 5′-AAAATGGAATCTAAGGTCTCGGAAG-3′ (sense) and 5′-GAGTGCACCCATCCCGGTGACCTC-3′ (antisense). The PCR conditions were as follows: 94 °C for 3 min; 35 cycles of 94 °C for 1 min, 55 °C for 1 min, and 72 °C for 1 min; and 72 °C for 10 min. The RT-PCR products were excised from a 1% agarose gel, purified using a QIAQuick gel extraction kit (Qiagen), and cloned into a pCRII-TOPO vector (Invitrogen). Candidate plasmids containing the correct size inserts were confirmed by restriction enzyme digestions and DNA sequencing on an ABI 3100 sequencer (Applied Biosystems).
For transient expression studies, the hnRNP K, αCP1, αCP2, αCP2-KL, and αCP3 genes were digested from the above pCRII-TOPO clones with 5′-HindIII and 3′-XhoI and cloned into the same sites of a pcDNA4 vector (Invitrogen), generating pcDNA4-hnRNP K, -RPA32, -αCP1, -αCP2, -αCP2-KL, and -αCP3 plasmids. The DNA sequences of all constructs were confirmed by DNA sequencing. In vitro translations were carried out with Myc-tagged pcDNA4-hnRNP K, -RPA32, -αCP1, -αCP2, -αCP2-KL, and -αCP3 in a reaction mixture containing [35S]methionine (Amersham Biosciences) using a TnT quick coupled transcription/translation system (Promega). The labeled proteins were then analyzed via SDS-PAGE on a 12% gel, and their sizes were compared with the predicted sizes.
Transient Transfection and Reporter Gene Assay—
Mouse neuroblastoma NS20Y cells were routinely grown in Dulbecco's minimum essential medium supplemented with 10% heat-inactivated fetal bovine serum at 37 °C in a humidified atmosphere of 5% CO2. The NS20Y cells were plated in 6-well dishes at a concentration of 0.5 × 10⁶ cells/well and cultured overnight before transfection. Various plasmids at equimolar concentrations were used with Effectene transfection reagent (Qiagen) as described previously (23). Briefly for luciferase analysis of Oprm1 promoters, 0.5 μg of the reporter plasmids was mixed with the Effectene transfection reagent for 10 min before being added to the NS20Y cells. Forty-eight hours after transfection, cells grown to confluence were washed once with 1× phosphate-buffered saline and lysed with lysis buffer (Promega). To correct for differences in transfection efficiency, a one-fifth molar ratio of pCH110 (Amersham Biosciences) containing the β-galactosidase gene under the SV40 promoter was included in each transfection for normalization. The luciferase and β-galactosidase activities of each lysate were determined according to the manufacturer's recommendations (Promega and Tropics).
Nuclear Extract Preparation—
Nuclear extracts were prepared from NS20Y cells as described previously (24). Briefly cells were grown to confluence, harvested, and washed with phosphate-buffered saline. All of the following steps were performed at 4 °C. The cells were resuspended in sucrose buffer (0.32 m sucrose, 3 mm CaCl2, 2 mm magnesium acetate, 0.1 mm EDTA, 10 mm Tris-HCl (pH 8.0), 1 mm DTT, 0.5 mm PMSF, and 0.5% Nonidet P-40). The lysate was microcentrifuged at 500 × g for 5 min to pellet the nuclei, which were washed with sucrose buffer. The nuclei were resuspended in low salt buffer (20 mm HEPES (pH 7.9), 25% glycerol, 20 mm KCl, 1.5 mm MgCl2, 0.2 mm EDTA, 0.5 mm DTT, and 0.5 mm PMSF) followed by addition of high salt buffer to extract the nuclei by incubation on a rotary platform for 20 min. Two and a half volumes of a diluent (25 mm HEPES (pH 7.6), 25% glycerol, 0.1 mm EDTA, 0.5 mm DTT, and 0.5 mm PMSF) were added, and the sample was microcentrifuged at 13,000 × g. Aliquots of the supernatant containing the nuclear extracts were stored at −80 °C.
Electrophoretic Mobility Shift Assay (EMSA)—
The EMSA was performed as described previously (25). The sense strand of the probe (5′-CAATCCACTCCTTCTCTCTCCTCCCTCCCCTCTAGCCTCTG-3′) was end-labeled with [γ-32P]dATP. Free nucleotides were separated by centrifugation through a Sephadex G-25 column (Roche Applied Science). The end-labeled DNA probes were incubated with in vitro translated proteins in a final volume of 20 μl of EMSA buffer (10 mm Tris (pH 7.5), 5% glycerol, 1 mm EDTA (pH 7.1), 50 mm NaCl, 1 mm DTT, and 0.1 mg/ml poly(dI-dC)) at room temperature for 20 min. For oligonucleotide competition analyses, a 100-fold molar excess of unlabeled oligonucleotide competitor was added to the mixture prior to adding the probe. For antibody supershift assays, 1 μg of anti-c-Myc (sc-40; Santa Cruz Biotechnology, Santa Cruz, CA) or anti-FLAG M2 (Sigma) antibodies were added to the mixture. The reaction was then incubated at 4 °C for 30 min. The reaction mixtures were electrophoresed on a nondenaturing 4% polyacrylamide gel in 0.5× TBE (45 mm Tris-borate and 1 mm EDTA) at 4 °C and visualized by autoradiography.
DNA Affinity Purification of Single Strand-binding Proteins Using a Competitor—
The following procedure is based on the interaction between biotin and streptavidin. Oligonucleotides were synthesized and purified using HPLC. Five hundred microliters of 0.5× saline-sodium citrate (SSC) were added to 500 pmol of 5′-terminal biotinylated single strand DNA (5′-CAATCCACTCCTTCTCTCTCCTCCCTCCCCTCTAGCCTCTG-3′). Meanwhile 500 pmol of streptavidin-paramagnetic particles (Promega) were resuspended by gently flicking the bottom of the tube until they were completely dispersed and then captured by placing the tube in a magnetic stand. The supernatant was carefully removed. The magnetic particles were washed three times with 0.5× SSC and resuspended in 100 μl of 0.5× SSC.
Five hundred picomoles of biotinylated single strand DNA and 500 pmol of the streptavidin-paramagnetic particles were combined and incubated for 15 min at room temperature. Samples were mixed by gentle inversion every 2 min. The magnetic beads were captured using a magnetic stand. The particles were washed three times with 300 μl of buffer A (5 mm HEPES, 26% glycerol, 1.5 mm MgCl2, 0.2 mm EDTA, 0.5 mm DTT, 0.5 mm PMSF, and 300 mm NaCl), pH 7.9. One milligram of nuclear proteins was added to the affinity particles and incubated for 1 h at 4 °C. The particles were washed three times with buffer A, buffer B (5 mm HEPES, 26% glycerol, 1.5 mm MgCl2, 0.2 mm EDTA, 0.5 mm DTT, 0.5 mm PMSF, and 100 mm NaCl), pH 7.9, and buffer C (5 mm HEPES, 26% glycerol, 1.5 mm MgCl2, 0.2 mm EDTA, 0.5 mm DTT, and 0.5 mm PMSF), pH 7.9. Proteins bound to the particles were released by incubation with 50 μl of 1× SDS sample buffer for 10 min at 95 °C in a heating block. To eliminate nuclear proteins that might bind nonspecifically, control experiments were performed by mixing 5000 pmol of nonbiotinylated single strand DNA (10× competitor) with 1 mg of nuclear proteins for 15 min on ice. The nuclear extracts containing the 10× competitor were added to the affinity particles and incubated for 1 h at 4 °C. The rest of the procedure was performed as above. The resulting protein solutions, with and without competitor, were electrophoresed on a 12% SDS-polyacrylamide gel and stained with Coomassie Blue.
Two-dimensional Gel Electrophoresis (2-DE), In-gel tryptic Digestion, and MALDI-TOF Mass Spectrometric Analysis of Single Strand-binding Proteins—
Purified proteins were resolved by 2-DE as described by Görg et al. (26) with minor modifications. Control and sample 2-DE gels were run under identical conditions. IPG strips were used according to the manufacturer's instruction. IEF as the first dimension was carried out on a Protein IEF cell (Bio-Rad). Briefly purified samples were mixed with an aliquot (185 μl) of rehydration solution (7 m urea, 2 m thiourea, 4% CHAPS (w/v), 60 mm DTT, a trace of bromphenol blue, and 0.5% IPG buffer (v/v); Amersham Biosciences) and then applied to the IPG strips. After rehydration for 12 h, IEF was carried out for 500 V for 1 h, 1000 V for 1 h, and a gradient to 8000 V for a total of 50,000 V-h. The IPG strips were then incubated for 15 min with an equilibration solution (50 mm Tris-HCl (pH 8.8), 6 m urea, 30% glycerol (v/v), 2% SDS (w/v), and 2% DTT (w/v)) followed by equilibration for another 15 min in the same buffer containing 2.5% iodoacetamide (w/v) instead of DTT. SDS-PAGE as the second dimension was carried out at a constant 90 V for 3 h. Molecular masses were determined by running standard protein markers (DualColor PrecisionPlus Protein™ standard; Bio-Rad). Gels were stained with colloidal Coomassie (GelCode® Blue stain reagent; Pierce) to visualize protein spots. Gel slices of interest (differential bands) were subjected to in-gel tryptic digestion as described previously (27). Tryptic peptides were extracted with 5% acetic acid followed by 5% acetic acid and 50% acetonitrile. Samples were dissolved in 5% acetic acid and desalted using ZipTipTM C18 reverse-phase desalting Eppendorf tips (Millipore). The peptides were eluted with 2% acetonitrile containing 0.1% TFA in a volume of 20 μl. Samples were analyzed using a MALDI-TOF mass spectrometer (Applied Biosystems). The masses of monoisotopic peaks were used for comparison with a theoretical digestion of the protein by trypsin. The Mascot database-searching software (Matrix Science) was used to identify binding proteins.
RT-PCR and Heterologous Expression of hnRNP K and αCPs—
Total RNA was isolated using TRI Reagent (Molecular Research Center, Inc.) according to the supplier's protocol. For RT-PCR, 2 μg of total RNA were used for the RT-PCR using the OneStep RT-PCR reagent (Qiagen). The PCR cycle conditions consisted of 95 °C for 1 min, 60 °C for 1 min, and 72 °C for 1 min followed by a 10-min extension at 72 °C. Primers specific to total Oprm1 mRNA were as follows: 5′-CATCAAAGCACTGATCACGATTCC-3′ (sense, located at exon 3) and 5′-TAGGGCAATGGAGCAGTTTCTGC-3′ (antisense, located at exon 4). Intron 3 between exon 3 and exon 4 of mouse Oprm1 is about 20 kb, indicating that the RT-PCR for Oprm1 using the above sense (exon 3) and antisense (exon 4) primers produce only Oprm1 mRNA. Similar reactions were carried out using 5′-TGGCCTTAGGGTGCAGGGGG-3′ (sense) and 5′-GTGGGCCGCTCTAGGCACCA-3′ (antisense) primers for β-actin as an internal control.
For heterologous expression, the pcDNA4-hnRNP K, -αCP1, -αCP2, -αCP2-KL, and -αCP3 plasmids harboring the coding sequences of these putative single strand DNA-binding proteins were transfected into mouse NS20Y cells using the Effectene transfection reagent (Qiagen). To test the regulation of endogenous Oprm1 by these proteins, total RNAs were isolated from NS20Y cells transfected with hnRNP K, αCP1, αCP2, αCP2-KL, and αCP3. RT-PCRs were performed using the OneStep RT-PCR kit (Qiagen) with Oprm1 and β-actin primers. The PCR products were electrophoresed in a 2% agarose gel and quantified by ImageQuant version 5.2 software (Amersham Biosciences).
Western Blot Analysis—
Proteins isolated from NS20Y cells transfected with hnRNP K, αCP1, αCP2, αCP2-KL, and αCP3 were incubated with treatment buffer (62.5 mm Tris-HCl (pH 6.8), 2% SDS, 10% glycerol, and 5% 2-mercaptoethanol) and boiled for 5 min. Treated extracts were resolved by SDS-PAGE using a 12% polyacrylamide gel. Gels were electroblotted onto polyvinylidene difluoride membranes (Amersham Biosciences) in transfer buffer (48 mm Tris-HCl, 39 mm glycine, and 20% methanol). Membranes were blocked in blocking solution (10% dry milk and 0.1% Tween 20 in Tris-buffered saline) overnight at 4 °C. Western blotting with anti-Myc (Santa Cruz Biotechnology) and anti-β-actin antibodies (Cell Signaling Technology, Beverly, MA) was performed according to the manufacturer's instructions (Amersham Biosciences). Signals were detected using a Storm 840 PhosphorImager system (Amersham Biosciences).
RESULTS
Isolation and Identification of Transcription Factors That Interact with Single Strand DNA Sequences in the Mouse Oprm1 Proximal Promoter Using a New Affinity Column Containing a Competitor—
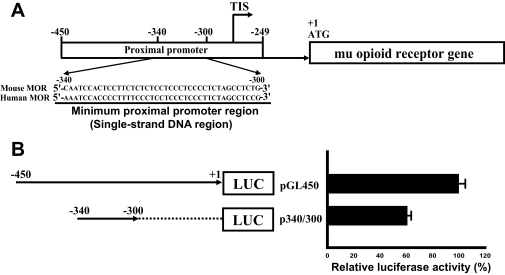
Studies from our laboratory have shown that expression of mouse Oprm1 is driven by two promoters, distal and proximal (13). Previously we reported that Oprm1 transcription is regulated by a cis-acting single strand DNA sequence in the mouse Oprm1 promoter through the binding of PCBP1 (17, 19). Basal promoter activity of Oprm1 is positioned at −450 to +1 relative to the Oprm1 translation start site (Fig. 1A). The p340/300 construct containing the single strand DNA region showed 60% of the activity expressed by the pGL450 construct containing proximal promoter (Fig. 1B). The single strand DNA sequence minimum proximal promoter region (Fig. 1A) is essential for promoter activity of the mouse Oprm1. This suggests that the segment from −340 to −300 bp contains the important cis-acting elements for basal activity.
Fig. 1.
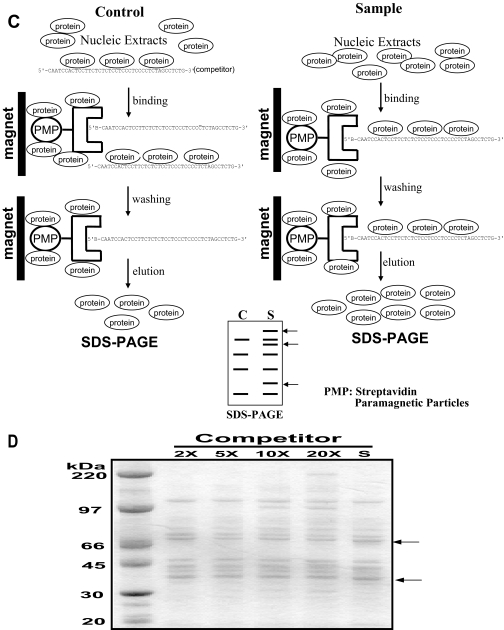
Schematic representation of mouse Oprm1 and the procedure for one-step purification of single strand DNA-binding proteins using an affinity column. A, the minimum proximal promoter region (single strand DNA sequence) of mouse Oprm1 proximal promoter. TIS, transcription initiation site. B, functional analysis of the mouse Oprm1 proximal promoter (pGL450) and minimum Oprm1 proximal promoter (p340/300). C, outline of the new one-step purification of single strand DNA-binding proteins using an affinity column. Single strand oligonucleotides biotinylated on the 5′ terminus were used as affinity particles. Nuclear proteins were added to the affinity particles, incubated, and washed. Proteins bound to the particles were released by heating in SDS sample buffer. Control experiments to eliminate nonspecific binding were performed by preincubating the nuclear proteins with a 10-fold excess of nonbiotinylated single strand DNA as a competitor prior to affinity binding. D, Coomassie-stained gel of single strand DNA-binding proteins purified from NS20Y nuclear extracts with various concentrations (2×, 5×, 10×, and 20×) of competitor. S, no added competitor; C, control; PMP, paramagnetic particle; MOR, μ opioid receptor.
In general, purification of transcription factors require many cells, several different types of columns (e.g. ion exchange chromatography, gel chromatography, and DNA affinity chromatography), and repeated experiments (28, 29). It is essential to eliminate nuclear proteins that bind nonspecifically. We have developed a new one-step method for purification of transcription factors that bind to specific DNA sequences that simultaneously eliminates nonspecifically binding nuclear proteins by using a competitor (Fig. 1C). The resulting protein solutions, with various concentrations of competitor or no added competitor, were electrophoresed on a 12% SDS-polyacrylamide gel and stained with Coomassie Blue. Using this protocol, we were able to purify and identify proteins from NS20Y nuclear extracts that bound specifically to the single strand DNA sequence. Unique bands migrating at 68 and 39 kDa were visualized by Coomassie staining (Fig. 1D).
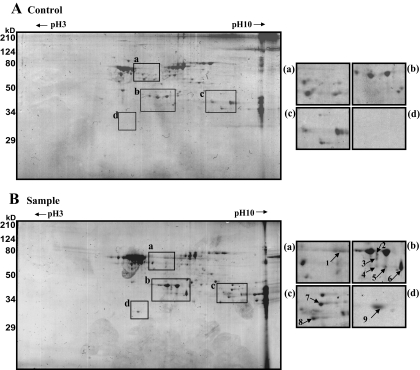
We used 2-DE to further characterize the major proteins binding to the single strand DNA sequence (Fig. 2). On average, 100 protein spots were detected in pH 3–10 2-DE images of competitor-treated control and samples. Most spots were distributed within a pH range of 6–9 and molecular masses of 30–70 kDa. Comparisons of the 2-DE images identified nine protein spots present in sample gels but not in controls (Table I). These spots were analyzed using MALDI-TOF mass spectrometry and bioinformatics. Eight of the spots (Fig. 2B, a, b, and c) were identified as PCBPs, including four αCPs: hnRNP K, αCP1, αCP2, αCP2-KL, and αCP3. The ninth (Fig. 2B, d) was identified as RPA32.
Fig. 2.
Coomassie-stained 2-DE images of single strand DNA-binding proteins purified using an affinity column. Purified samples were separated on pH 3–10 IPG strips followed by separation by 12% SDS-PAGE. A, control. B, sample. Molecular mass markers are indicated on the left, and pI values are indicated across the top. a–d, annotated spots (1–9) were subjected to analysis by MALDI-TOF mass spectrometry and bioinformatics. Detailed information on each spot is listed in Table I.
Table I.
Analysis by MALDI-TOF MS of the tryptic peptide profiles of the protein spots
| Spot number | Protein identified | NCBI accession number | Molecular mass | Mascot probability score | Peptide match | pI |
|---|---|---|---|---|---|---|
| Da | ||||||
| 1 | Heterogeneous nuclear ribonucleoprotein K | gi55958545 | 51,230 | 93 | 9/30 | 5.3 |
| 2, 3 | Poly(C)-binding protein 2 (αCP2) | gi76617802 | 38,597 | 138 | 10/18 | 6.33 |
| 4, 5, 6 | Poly(C)-binding protein 1 (αCP1) | gi13435879 | 37,987 | 173 | 17/30 | 6.66 |
| 7 | Poly(C)-binding protein 3 (αCP3) | gi46577695 | 36,171 | 152 | 14/29 | 8.22 |
| 8 | Poly(C)-binding protein 2 (αCP2-KL) | gi495128 | 35,336 | 112 | 17/50 | 8.48 |
| 9 | Replication protein A32 | gi2498846 | 29,871 | 88 | 9/29 | 5.76 |
hnRNP K, αCP1, αCP2, αCP2-KL, and αCP3 Bind Specifically to the Single Strand DNA Sequence of the Mouse Oprm1 Proximal Promoter—
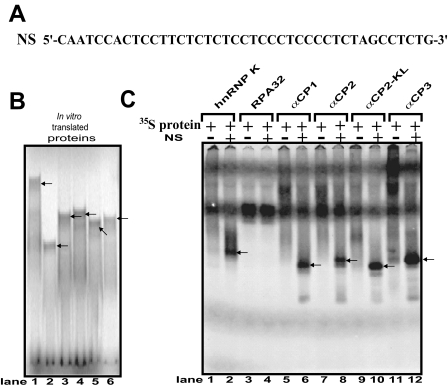
To determine the physical interaction of hnRNP K, RPA32, αCP1, αCP2, αCP2-KL, and αCP3 with the mouse Oprm1 promoter, EMSAs were performed using in vitro translated [35S]methionine-labeled proteins (Fig. 3B) and a single strand oligonucleotide (NS) (Fig. 3A) derived from the Oprm1 single strand DNA sequence. A major complex was formed using the NS sequence with all the PCBPs tested (Fig. 3C). In contrast, only nonspecific complexes were observed in control lanes without the NS sequence (Fig. 3C). However, formation of a major complex was not observed using the NS sequence with 35S-labeled RPA32.
Fig. 3.
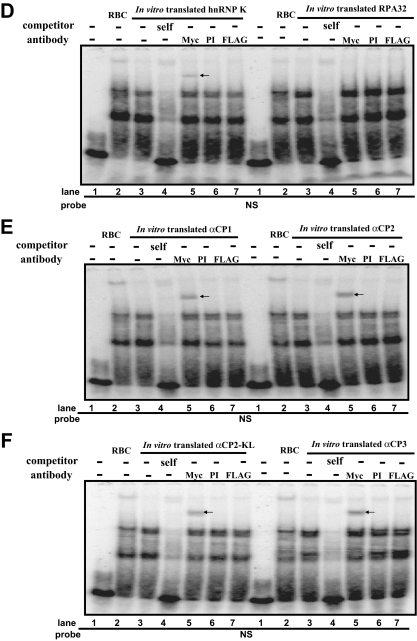
EMSA of in vitro translated Myc-tagged hnRNP K, RPA32, αCP1, αCP2, αCP2-KL, and αCP3 using the anti-Myc antibody. A, the Oprm1 NS sequence. B, hnRNP K, RPA32, αCP1, αCP2, αCP2-KL, and αCP3 proteins radiolabeled in vitro with [35S]methionine (lanes 1–6, respectively). C, EMSAs performed with NS and the in vitro labeled proteins. Lanes 1, 3, 5, 7, 9, and 11, negative controls (i.e. no NS probe); lanes 2, 4, 6, 8, 10, and 12, [35S]methionine-labeled proteins. D–F, EMSAs were performed using 32P-labeled NS as a probe with in vitro translated proteins. Lane 1, probe alone; lane 2, reticulocyte (RBC) without antibody; lane 3, no added antibody; lane 4, self-competitor without antibody; lane 5, anti-c-Myc antibody; lane 6, preimmune (PI) serum; lane 7, anti-FLAG antibody. The protein-single strand DNA complexes are indicated by arrows.
To confirm these interactions, EMSAs were carried out using 32P-labeled NS probe and unlabeled proteins (Fig. 3, D–F). All the proteins were able to shift the target NS probe (Fig. 3, D–F, compare lane 3 and lane 1 in each panel). The NS probe also bound to reticulocytes, which are known to express hnRNP K, αCP1, αCP2, and αCP2-KL (Fig. 3, D–F, lane 2). The specificity of the DNA-protein interaction was verified by using anti-Myc antibody against Myc-tagged versions of in vitro translated proteins derived from the pcDNA4 plasmids. The hnRNP K- and αCP-DNA complexes were supershifted by addition of the anti-Myc antibody (Fig. 3, D–F, lane 5) but not by the addition of preimmune serum or anti-FLAG antibody as negative controls (Fig. 3, D–F, lanes 6 and 7, respectively). In contrast, anti-Myc had no effect on the migration of RPA32 (Fig. 3D).
Defining the Core Binding Motif on the Single Strand DNA Sequence for hnRNP K and the αCPs—
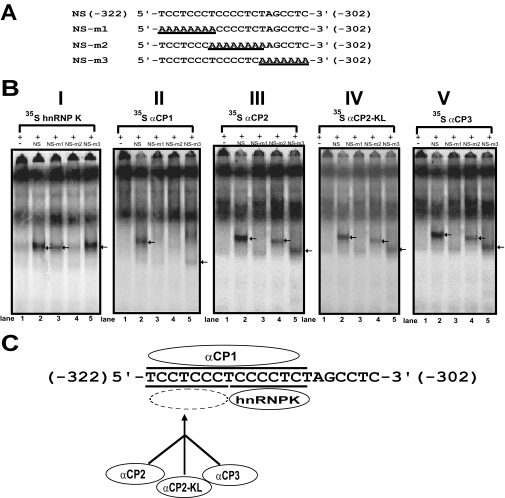
To determine the binding motif within the single strand DNA sequence of the Oprm1 proximal promoter, EMSAs were carried out using the [35S]methionine-labeled proteins with unlabeled NS sequence and sequences mutated as indicated (Fig. 4A, NS-m1 through NS-m3). Major complexes were observed for hnRNP K using NS, NS-m1 (although reduced), and NS-m3 (Fig. 4B, I, lanes 2, 3, and 5, respectively). No hnRNP K complex was observed using the NS-m2 sequences (Fig. 4B, I, lane 4). This suggests that the single strand DNA sequence 5′-TCCCCTCT-3′ (Fig. 4C, underlined) serves as the hnRNP K binding motif within the single strand DNA sequence of the mouse Oprm1 proximal promoter.
Fig. 4.
EMSA analysis of hnRNP K and αCP binding motifs using mutant oligonucleotide sequences. A, NS sequence and mutant oligonucleotide sequences (NS-m1–NS-m3). B, EMSAs were performed using unlabeled NS (lane 2) or unlabeled mutant sequences (NS-m1–NS-m3; lanes 3–5) and [35S]methionine-labeled proteins translated in vitro from the pcDNA4 expression vectors. Lane 1, negative control (no NS sequence). The protein-single strand DNA complexes are indicated by arrows. C, schematic representation of the binding motif for hnRNP K, αCP1, αCP2, αCP2-KL, and αCP3 on the single strand DNA sequence.
In contrast, major complexes were observed using NS and NS-m3 (although reduced) (Fig. 4B, II, lanes 2 and 5, respectively) with αCP1. No αCP1 complex was observed using the NS-m1 and NS-m2 sequences (Fig. 4B, II, lanes 3 and 4, respectively). Based on the above observations, we propose that the single strand DNA sequence 5′-TCCTCCCTCCCCTCT-3′ (Fig. 4C, underlined) serves as the αCP1 binding motif within the single strand DNA sequence of the mouse Oprm1 proximal promoter.
In the cases of αCP2, αCP2-KL, and αCP3, nearly identical results were observed. Specifically the formation of major complexes was observed when the labeled proteins were probed with NS, NS-m2, and NS-m3 (although at a reduced level with NS-m3) (Fig. 4B, III–V, lanes 2, 4, and 5, respectively). In contrast, no complexes were observed using NS-m1 (Fig. 4B, III–V, lanes 3). These observations indicate that the single strand DNA sequence 5′-TCCTCCCT-3′ (Fig. 4C, underlined) serves as the binding motif within the single strand DNA sequence of the mouse Oprm1 proximal promoter for all three of these proteins.
The hnRNP K and αCPs Regulate Mouse Oprm1 Proximal Promoter Activity—
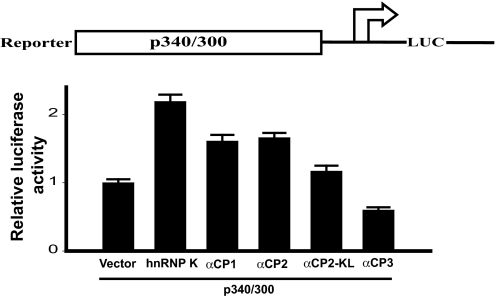
To examine the functional role of hnRNP K and αCPs in mouse Oprm1 regulation, we used the Oprm1 proximal promoter fused with a luciferase reporter and hnRNP K, αCP1, αCP2, αCP2-KL, or αCP3 expression plasmids. These plasmids were cotransfected with the mouse p300/340 proximal promoter construct into NS20Y cells. Relative to cells cotransfected with the pcDNA4 vector alone, cotransfection with the hnRNP K construct nearly doubled Oprm1 proximal promoter activity. Cotransfection with αCP1 and αCP2 produced similar results, increasing promoter activity up to 1.6-fold, whereas αCP2-KL had a less potent effect, increasing activity only about 1.2-fold (Fig. 5). In contrast, the αCP3 protein repressed about 40% of the Oprm1 proximal promoter activity induced in pcDNA4 vector only-transfected cells (Fig. 5).
Fig. 5.
hnRNP K and αCPs regulate the proximal promoter of the mouse μ opioid receptor gene. Top, schematic representation of the mouse Oprm1 minimum proximal promoter region, the p340/300 promoter construct. Bottom, neuronal NS20Y cells were cotransfected with 2 μg of the binding protein constructs and 1 μg of the luciferase reporter construct. Luciferase reporter activities were expressed as n-fold relative to the activity of each corresponding luciferase reporter transfected with vector alone, which was assigned an activity value of 1.0. Transfection efficiencies were normalized by β-galactosidase activity. The data shown are the mean of three independent experiments with at least two different plasmid preparations. Error bars indicate the range of standard errors. LUC, luciferase.
Effect of Exogenous hnRNP K and αCPs on Mouse Oprm1 Expression—
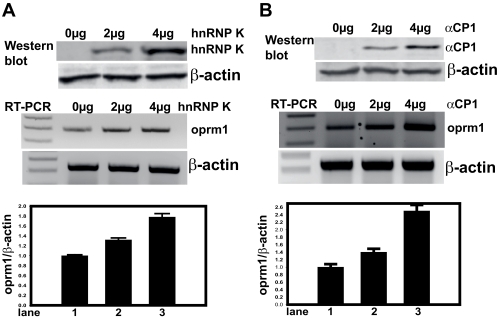
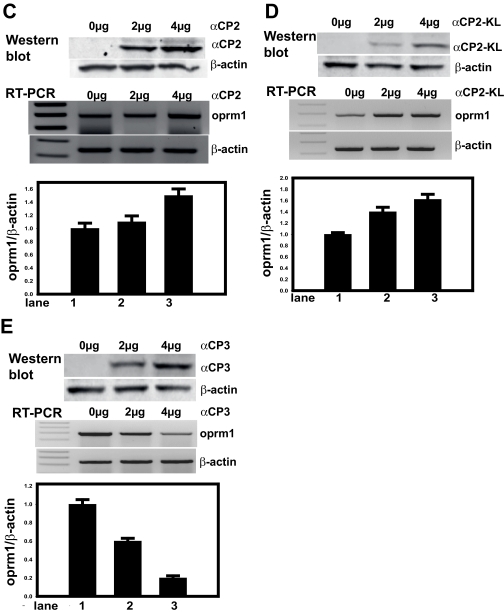
To evaluate whether transiently overexpressed hnRNP K, αCP1, αCP2, αCP2-KL, or αCP3 can result in regulation of the endogenous Oprm1 transcript, RT-PCR analyses using Oprm1-specific primers were performed with total RNA from NS20Y cells transfected with varying amounts (0–4 μg) of pcDNA4 constructs for each of the binding proteins as well as with pcDNA4 vector control. Immunoblot analyses were performed following plasmid transfection to confirm overexpression of the proteins; β-actin was used as an internal control. As shown in Fig. 6, the protein levels of mouse αCPs were increased, whereas in the vector-transfected cells (negative control), the protein levels of mouse αCPs were not detectable. The amounts of β-actin proteins remained the same in both αCP- and vector-transfected cells. The hnRNP K (Fig. 6A), αCP1 (Fig. 6B), αCP2 (Fig. 6C), and αCP2-KL (Fig. 6D) constructs all up-regulated endogenous Oprm1 gene expression in a dose-dependent manner. In contrast, the αCP3 construct down-regulated endogenous Oprm1 gene expression in a dose-dependent manner (Fig. 6E).
Fig. 6.
Mouse Oprm1 mRNA expression levels in hnRNP K and αCP DNA-transfected NS20Y cells. Relative levels of αCP protein expression following plasmid transfection were confirmed by immunoblot analysis (top panels; lane 1, vector DNA alone; lane 2, 2 μg of plasmid DNA; lane 3, 4 μg of plasmid DNA). Immunoblots against β-actin were performed as an internal control. Each panel is a representative of three separate experiments. Total RNA from NS20Y cells transfected with various amounts (center panels; lane 1, vector DNA alone; lane 2, 2 μg of plasmid DNA; lane 3, 4 μg of plasmid DNA) of the pcDNA4 plasmids for hnRNP K and the αCPs were reverse transcribed into a cDNA and used as a template for PCR with Oprm1 and β-actin PCR primers. PCR products were electrophoresed on a 2% agarose gel, and the relative intensities of the Oprm1 mRNA were normalized against those of β-actin (bottom panels). Quantitative analyses were performed using ImageQuant 5.2 software. Each bar represents the sum of the signal intensities in an area of a defined size and S.D. between experiments. Error bars indicate the range of standard deviation. The signal from vector DNA-translated cells was set at 1. A, pcDNA4-hnRNP K. B, pcDNA4-αCP1. C, pcDNA4-αCP2. D, pcDNA4-αCP2-KL. E, pcDNA4-αCP3.
DISCUSSION
Precise transcriptional regulation of opioid receptor genes in the brain is crucial for normal neuropharmacological function. Several classes of nuclear proteins are intricately involved in controlling expression of these genes (1). Our earlier studies showed that mouse Oprm1 transcription was regulated by a cis-acting single strand DNA sequence that was essential for the activity of the mouse Oprm1 promoter through the binding of αCP1 (i.e. PCBP1) (19, 30).
We have developed an efficient method to purify transcription factors (Fig. 1C). This simple method has many advantages, including a smaller population of cells required for analysis, rapidity (<5 h), and a one-step process that eliminates the need for additional column chromatography. This method is also very effective at removing nuclear proteins that bind nonspecifically. We have used this new procedure to purify new transcription factors that bind to the poly(C) sequence of the Oprm1 proximal promoter (31). In this study, we used a combination of the one-step purification method, 2-DE, and MALDI-TOF mass spectrometry to identify five new proteins (hnRNP K, αCP1, αCP2, αCP2-KL, and αCP3) that bind to the single strand DNA sequence of the Oprm1 promoter (Fig. 2 and Table I).
The PCBPs are encoded at five dispersed loci in the mouse and human genomes. These proteins can be divided into two groups (hnRNPs K/J and the αCPs (αCP1–4)) and are linked by a common evolutionary history, a shared triple KH domain, and by their poly(C) binding specificity (32). PCBPs have diverse functions, including viral or nonviral mRNA stability, translational silencing, translational enhancement, transcriptional activation, transcriptional inhibition, and induction of programmed cell death. Indeed the related αCP1 and αCP2 proteins exhibit stabilization of cellular and viral mRNA (32). In addition to their roles in mRNA stability and translational control, PCBPs have transcriptional regulatory functions. The hnRNP K has a specific binding site on the SV40 early promoter (33) and in the pyrimidine-rich strand of the CT element in the promoter of the human c-MYC gene (34). In the case of the thymidine kinase promoter, hnRNP K cannot physically interact with the promoter but can repress transcription by inhibiting the binding of other trans-factors to cell cycle-regulatory determinants for this promoter (35). Finally the αCP4 isoform MCG10 is a potential mediator of p53 tumor suppression (36).
Here we report that hnRNP K, αCP1, αCP2, αCP2-KL, and αCP3 bind to the single strand DNA element essential for activity of the Oprm1 promoter and regulate its promoter activity at the transcriptional level. Specific interactions between hnRNP K, the αCPs, and the single strand sequence were first observed during one-step purification using an affinity column. EMSAs further revealed the characteristics of the sequence-specific interaction between these PCBPs and the single strand sequence of the mouse Oprm1 promoter. In particular, the eight-base sequence (−315 to −308, 5′-TCCCCTCT-3′) is critical for hnRNP K-single strand DNA complex formation, whereas an adjacent eight-base sequence (−322 to −315, 5′-TCCTCCCT-3′) is critical for single strand DNA complex formation with αCP2, αCP2-KL, and αCP3. A 15-base sequence spanning both the other binding regions (−322 to −308, 5′-TCCTCCCTCCCCTCT-3′) is necessary for DNA binding of αCP1.
Functional analyses suggest that hnRNP K and the αCPs regulate the Oprm1 proximal promoter containing wild type single strand DNA sequences. These data suggest that hnRNP K, αCP1, αCP2, and αCP2-KL act as transcription activators, whereas αCP3 acts as a transcription repressor. These results were confirmed by studies in NS20Y cells, a mouse neuroblastoma cell line endogenously expressing μ opioid receptor. Increasing the exogenous expression of hnRNP K, αCP1, αCP2, or αCP2-KL in these cells up-regulated endogenous Oprm1 transcripts in vivo in a dose-dependent manner. Likewise increasing the exogenous expression of αCP3 down-regulated endogenous Oprm1 transcripts in vivo in a dose-dependent manner. Taken together, the results indicate that hnRNP K, αCP1, αCP2, and αCP2-KL act as activators and αCP3 acts as a repressor of Oprm1 transcription in neuronal cells via a mechanism dependent on the single strand DNA sequence of the Oprm1 proximal promoter.
Previously we reported that the αCP3 construct up-regulates endogenous human OPRM1 expression in human neuroblastoma NMB cells (30). Here we propose that αCP3 acts as a transcriptional activator in human NMB cells but as a transcriptional repressor in mouse NS20Y cells. That is, αCP3 regulates μ opioid receptor promoter differentially depending on the cellular context. Similar results have been reported previously (37–39). Nuclear factor 1 acts as a positive regulator of the α1B adrenergic receptor gene in Hep3B cells but as a negative regulator in MF-2 cells (37). Dopamine receptor-regulating factor repressed D1A receptor promoter in mouse NS20Y cells but activated D1A receptor promoter in human TE671 cells (38). TLX1/HOX11 is a dual function regulator capable of being either an activator or repressor depending on the cell type and the promoter context (39). Although the molecular determinants underlying such differences remain to be fully characterized, other proteins and their relative concentrations may be important factors.
Because hnRNP K has been demonstrated to interact directly with RNA polymerase machinery through the TATA-binding protein-associated factor complex (40), it might be able to interact during the initiation of the Oprm1 gene. Several G-protein-coupled receptor genes, including the Oprm1 gene, are also controlled by a promoter with constitutive activity. Thus, gene activity must be modulated via sequence-specific enhancer- and/or silencer-binding proteins to produce restricted patterns of expression in the nervous system. Tissue- or cell-specific regulatory factors (24, 41–44) presumably modulate the ability of ubiquitous factors (such as hnRNP K and the αCPs examined in this study or the other unidentified factors) to regulate Oprm1 promoter activity. Our findings may promote a better understanding of the molecular mechanisms underlying Oprm1 expression.
Acknowledgments
We thank the staff of the Mass Spectrometry Consortium for Life Science, Department of Biochemistry, Molecular Biology and Biophysics, University of Minnesota, St. Paul, MN for recording the mass spectra for the protein samples.
Footnotes
Published, MCP Papers in Press, DOI 10.1074/mcp.M800052-MCP200
Author's Choice—Final version full access.
The abbreviations used are: PCBP, poly(C)-binding protein; αCP, α-complex protein; hnRNP, heterogeneous nuclear ribonucleoprotein; RPA32, replication protein A32; EMSA, electrophoretic mobility shift assay; SSC, saline-sodium citrate; 2-DE, two-dimensional gel electrophoresis; NS, single strand oligonucleotide.
This work was supported, in whole or in part, by National Institutes of Health Grants DA00564, DA01583, DA11806, DA11190, K05-DA00153, and K02-DA13926. This work was also supported by the F&A Stark Fund of the Minnesota Medical Foundation. The costs of publication of this article were defrayed in part by the payment of page charges. This article must therefore be hereby marked “advertisement” in accordance with 18 U.S.C. Section 1734 solely to indicate this fact.
REFERENCES
- 1.Wei, L. N., and Loh, H. H. ( 2002) Regulation of opioid receptor expression. Curr. Opin. Pharmacol. 2, 69–75 [DOI] [PubMed] [Google Scholar]
- 2.Min, B. H., Augustin, L. B., Felsheim, R. F., Fuchs, J. A., and Loh, H. H. ( 1994) Genomic structure analysis of promoter sequence of a mouse μ opioid receptor gene. Proc. Natl. Acad. Sci. U. S. A. 91, 9081–9085 [DOI] [PMC free article] [PubMed] [Google Scholar]
- 3.Kieffer, B. L. ( 1995) Recent advances in molecular recognition and signal transduction of active peptides: receptors for opioid peptides. Cell. Mol. Neurobiol. 15, 615–635 [DOI] [PMC free article] [PubMed] [Google Scholar]
- 4.Kieffer, B. L. ( 1999) Opioids: first lessons from knockout mice. Trends Pharmacol. Sci. 20, 19–26 [DOI] [PubMed] [Google Scholar]
- 5.Law, P. Y., Wong, Y. H., and Loh, H. H. ( 2000) Molecular mechanisms and regulation of opioid receptor signaling. Annu. Rev. Pharmacol. Toxicol. 40, 389–430 [DOI] [PubMed] [Google Scholar]
- 6.Maldonado, R., Saiardi, A., Valverde, O., Samad, T. A., Roques, B. P., and Borrelli, E. ( 1997) Absence of opiate rewarding effects in mice lacking dopamine D2 receptors. Nature 388, 586–589 [DOI] [PubMed] [Google Scholar]
- 7.Mansour, A., Fox, C. A., Akil, H., and Watson, S. J. ( 1995) Opioid-receptor mRNA expression in the rat CNS: anatomical and functional implications. Trends Neurosci. 18, 22–29 [DOI] [PubMed] [Google Scholar]
- 8.Pan, Y. X., Xu, J., Mahurter, L., Bolan, E., Xu, M., and Pasternak, G. W. ( 2001) Generation of the mu opioid receptor (MOR-1) protein by three new splice variants of the Oprm gene. Proc. Natl. Acad. Sci. U. S. A. 98, 14084–14089 [DOI] [PMC free article] [PubMed] [Google Scholar]
- 9.Pan, Y. X., Xu, J., Bolan, E., Abbadie, C., Chang, A., Zuckerman, A., Rossi, G., and Pasternak, G. W. ( 1999) Identification and characterization of three new alternatively spliced μ-opioid receptor isoforms. Mol. Pharmacol. 56, 396–403 [DOI] [PubMed] [Google Scholar]
- 10.Pan, Y. X. ( 2002) Identification and characterization of a novel promoter of the mouse mu opioid receptor gene (Oprm) that generates eight splice variants. Gene (Amst.) 295, 97–108 [DOI] [PubMed] [Google Scholar]
- 11.Choi, H. S., Kim, C. S., Hwang, C. K., Song, K. Y., Wang, W., Qiu, Y., Law, P. Y., Wei, L. N., and Loh, H. H. ( 2006) The opioid ligand binding of human μ-opioid receptor is modulated by novel splice variants of the receptor. Biochem. Biophys. Res. Commun. 343, 1132–1140 [DOI] [PubMed] [Google Scholar]
- 12.Song, K. Y., Hwang, C. K., Kim, C. S., Choi, H. S., Law, P. Y., Wei, L. N., and Loh, H. H. ( 2007) Translational repression of mouse mu opioid receptor expression via leaky scanning. Nucleic Acids Res. 35, 1501–1513 [DOI] [PMC free article] [PubMed] [Google Scholar]
- 13.Ko, J. L., Minnerath, S. R., and Loh, H. H. ( 1997) Dual promoters of mouse μ-opioid receptor gene. Biochem. Biophys. Res. Commun. 234, 351–357 [DOI] [PubMed] [Google Scholar]
- 14.Hwang, C. K., Kim, C. S., Choi, H. S., McKercher, S. R., and Loh, H. H. ( 2004) Transcriptional regulation of mouse μ opioid receptor gene by PU.1. J. Biol. Chem. 279, 19764–19774 [DOI] [PubMed] [Google Scholar]
- 15.Choe, C., Im, H. J., Ko, J. L., and Loh, H. H. ( 1998) Mouse μ opioid receptor gene expression. A 34-base pair cis-acting element inhibits transcription of the μ opioid receptor gene from the distal promoter. J. Biol. Chem. 273, 34926–34932 [DOI] [PMC free article] [PubMed] [Google Scholar]
- 16.Ko, J. L., Chen, H. C., and Loh, H. H. ( 2002) Differential promoter usage of mouse μ-opioid receptor gene during development. Brain Res. Mol. Brain Res. 104, 184–193 [DOI] [PubMed] [Google Scholar]
- 17.Ko, J. L., and Loh, H. H. ( 2001) Single-stranded DNA-binding complex involved in transcriptional regulation of mouse μ-opioid receptor gene. J. Biol. Chem. 276, 788–795 [DOI] [PubMed] [Google Scholar]
- 18.Ko, J. L., Liu, H. C., Minnerath, S. R., and Loh, H. H. ( 1998) Transcriptional regulation of mouse μ-opioid receptor gene. J. Biol. Chem. 273, 27678–27685 [DOI] [PubMed] [Google Scholar]
- 19.Ko, J. L., and Loh, H. H. ( 2005) Poly C binding protein, a single-stranded DNA binding protein, regulates mouse μ-opioid receptor gene expression. J. Neurochem. 93, 749–761 [DOI] [PubMed] [Google Scholar]
- 20.Berry, A. M., Flock, K. E., Loh, H. H., and Ko, J. L. ( 2006) Molecular basis of cellular localization of poly C binding protein 1 in neuronal cells. Biochem. Biophys. Res. Commun. 349, 1378–1386 [DOI] [PMC free article] [PubMed] [Google Scholar]
- 21.Malik, A. K., Flock, K. E., Godavarthi, C. L., Loh, H. H., and Ko, J. L. ( 2006) Molecular basis underlying the poly C binding protein 1 as a regulator of the proximal promoter of mouse μ-opioid receptor gene. Brain Res. 1112, 33–45 [DOI] [PubMed] [Google Scholar]
- 22.Rivera-Gines, A., Cook, R. J., Loh, H. H,., and Ko, J. L. ( 2006) Interplay of Sps and poly(C) binding protein 1 on the μ-opioid receptor gene expression. Biochem. Biophys. Res. Commun. 345, 530–537 [DOI] [PubMed] [Google Scholar]
- 23.Choi, H. S., Hwang, C. K., Kim, C. S., Song, K. Y., Law, P. Y., Wei, L. N., and Loh, H. H. ( 2005) Transcriptional regulation of mouse μ opioid receptor gene: Sp3 isoforms (M1, M2) function as repressors in neuronal cells to regulate the μ opioid receptor gene. Mol. Pharmacol. 67, 1674–1683 [DOI] [PubMed] [Google Scholar]
- 24.Kim, C. S., Hwang, C. K., Choi, H. S., Song, K. Y., Law, P. Y., Wei, L. N., and Loh, H. H. ( 2004) Neuron-restrictive silencer factor (NRSF) functions as a repressor in neuronal cells to regulate μ opioid receptor gene. J. Biol. Chem. 279, 46464–46473 [DOI] [PubMed] [Google Scholar]
- 25.Hwang, C. K., Wu, X., Wang, G., Kim, C. S., and Loh, H. H. ( 2003) Mouse μ opioid receptor distal promoter transcriptional regulation by SOX proteins. J. Biol. Chem. 278, 3742–3750 [DOI] [PubMed] [Google Scholar]
- 26.Görg, A., Obermaier, C., Boguth, G., Harder, A., Scheibe, B., Wildgruber, R., and Weiss, W. ( 2000) The current state of two-dimensional electrophoresis with immobilized pH gradients. Electrophoresis 21, 1037–1053 [DOI] [PubMed] [Google Scholar]
- 27.Patterson, S. D., and Aebersold, R. ( 1995) Mass spectrometric approaches for the identification of gel-separated proteins. Electrophoresis 16, 1791–1814 [DOI] [PubMed] [Google Scholar]
- 28.Ritchie, S. A., Pasha, M. K., Batten, D. J., Sharma, R. K., Olson, D. J., Ross, A. R., and Bonham, K. ( 2003) Identification of the SRC pyrimidine-binding protein (SPy) as hnRNP K: implications in the regulation of SRC1A transcription. Nucleic Acids Res. 31, 1502–1513 [DOI] [PMC free article] [PubMed] [Google Scholar]
- 29.Thakur, S., Nakamura, T., Calin, G., Russo, A., Tamburrino, J. F., Shimizu, M., Baldassarre, G., Battista, S., Fusco, A., Wassell, R. P., Dubois, G., Alder, H., and Croce, C. M. ( 2003) Regulation of BRCA1 transcription by specific single-stranded DNA binding factors. Mol. Cell Biol. 23, 3774–3787 [DOI] [PMC free article] [PubMed] [Google Scholar]
- 30.Kim, S. S., Pandey, K. K., Choi, H. S., Kim, S. Y., Law, P. Y., Wei, L. N., and Loh, H. H. ( 2005) Poly(C) binding protein family is a transcription factor in μ-opioid receptor gene expression. Mol. Pharmacol. 68, 729–736 [DOI] [PubMed] [Google Scholar]
- 31.Choi, H. S., Kim, C. S., Hwang, C. K., Song, K. Y., Law, P. Y., Wei, L. N., and Loh, H. H. ( 2007) Novel function of the poly(C)-binding protein αCP3 as a transcriptional repressor of the mu opioid receptor gene. FASEB J. 21, 3963–3973 [DOI] [PubMed] [Google Scholar]
- 32.Makeyev, A. V., and Liebhaber, S. A. ( 2002) The poly(C)-binding proteins: a multiplicity of functions and a search for mechanisms. RNA 8, 265–278 [DOI] [PMC free article] [PubMed] [Google Scholar]
- 33.Gaillard, C., Cabannes, E., and Strauss, F. ( 1994) Identity of the RNA-binding protein K of hnRNP particles with protein H16, a sequence-specific single strand DNA-binding protein. Nucleic Acids Res. 22, 4183–4186 [DOI] [PMC free article] [PubMed] [Google Scholar]
- 34.Tomonaga, T., and Levens, D. ( 1995) Heterogeneous nuclear ribonucleoprotein K is a DNA-binding transactivator. J. Biol. Chem. 270, 4875–4881 [DOI] [PubMed] [Google Scholar]
- 35.Lau, J. S., Baumeister, P., Kim, E., Roy, B., Hsieh, T. Y., Lai, M., and Lee, A. S. ( 2000) Heterogeneous nuclear ribonucleoproteins as regulators of gene expression through interactions with the human thymidine kinase promoter. J. Cell. Biochem. 79, 395–406 [DOI] [PubMed] [Google Scholar]
- 36.Zhu, J., and Chen, X. ( 2000) MCG10, a novel p53 target gene that encodes a KH domain RNA-binding protein, is capable of inducing apoptosis and cell cycle arrest in G2-M. Mol. Cell. Biol. 20, 5602–5618 [DOI] [PMC free article] [PubMed] [Google Scholar]
- 37.Gao, B., and Kunos, G. ( 1998) Cell type-specific transcriptional activation and suppression of the α1B adrenergic receptor gene middle promoter by nuclear factor 1. J. Biol. Chem. 273, 31784–31787 [DOI] [PubMed] [Google Scholar]
- 38.Hwang, C. K., D'Souza, U. M., Eisch, A. J., Yajima, S., Lammers, C. H., Yang, Y., Lee, S. H., Kim, Y. M., Nestler, E. J., and Mouradian, M. M. ( 2001) Dopamine receptor regulating factor, DRRF: a zinc finger transcription factor. Proc. Natl. Acad. Sci. U. S. A. 98, 7558–7563 [DOI] [PMC free article] [PubMed] [Google Scholar]
- 39.Rice, K. L., Kees, U. R., and Greene, W. K. ( 2008) Transcriptional regulation of FHL1 by TLX1/HOX11 is dosage, cell-type and promoter context-dependent. Biochem. Biophys. Res. Commun. 367, 707–713 [DOI] [PubMed] [Google Scholar]
- 40.Michelotti, E. F., Michelotti, G. A., Aronsohn, A. I., and Levens, D. ( 1996) Heterogeneous nuclear ribonucleoprotein K is a transcription factor. Mol. Cell. Biol. 16, 2350–2360 [DOI] [PMC free article] [PubMed] [Google Scholar]
- 41.Kim, C. S., Choi, H. S., Hwang, C. K., Song, K. Y., Lee, B. K., Law, P. Y., Wei, L. N., and Loh, H. H. ( 2006) Evidence of the neuron-restrictive silencer factor (NRSF) interaction with Sp3 and its synergic repression to the mu opioid receptor (MOR) gene. Nucleic Acids Res. 34, 6392–6403 [DOI] [PMC free article] [PubMed] [Google Scholar]
- 42.Korner, M., Rattner, A., Mauxion, F., Sen, R., and Citri, Y. ( 1989) A brain-specific transcription activator. Neuron 3, 563–572 [DOI] [PubMed] [Google Scholar]
- 43.Kovarik, A., Peat, N., Wilson, D., Gendler, S. J., and Taylor-Papadimitriou, J. ( 1993) Analysis of the tissue-specific promoter of the MUC1 gene. J. Biol. Chem. 268, 9917–9926 [PubMed] [Google Scholar]
- 44.Ogata, H., Inoue, N., and Podolsky, D. K. ( 1998) Identification of a goblet cell-specific enhancer element in the rat intestinal trefoil factor gene promoter bound by a goblet cell nuclear protein. J. Biol. Chem. 273, 3060–3067 [DOI] [PubMed] [Google Scholar]


