Abstract
Rationale and Objectives
Diffusion MRI with hyperpolarized 3He gas is a powerful technique for probing the characteristics of the lung microstructure. A key parameter for this technique is the diffusion time, which is the period during which the atoms are allowed to diffuse within the lung for measurement of the signal attenuation. The relationship between diffusion time and the length scales that can be explored is discussed, and representative, preliminary results are presented from ongoing studies of the human lung for diffusion times ranging from milliseconds to several seconds.
Materials and Methods
3He diffusion MR imaging of the human lung was performed on a 1.5T Siemens Sonata scanner. Using gradient-echo-based and stimulated-echo-based techniques for short and medium-to-long diffusion times, respectively, measurements were performed for times ranging from 2 ms to 6.5 s in two healthy subjects, a subject with sub-clinical chronic obstructive pulmonary disease and a subject with bronchopulmonary dysplasia.
Results
In healthy subjects, the apparent diffusion coefficient decreased by about 10-fold, from approximately 0.2 to 0.02 cm2/s, as the diffusion time increased from approximately 1 ms to 1 s. Results in subjects with disease suggest that measurements made at diffusion times substantially longer than 1 ms may provide improved sensitivity for detecting certain pathological changes in the lung microstructure.
Conclusion
With appropriately designed pulse sequences it is possible to explore the diffusion of hyperpolarized 3He in the human lung over more than a 1000-fold variation of the diffusion time. Such measurements provide a new opportunity for exploring and characterizing the microstructure of the healthy and diseased lung.
Keywords: MRI of lung, diffusion MRI, hyperpolarized helium
INTRODUCTION
The lung parenchyma and airspaces are poorly visualized with conventional, proton-based magnetic resonance imaging (MRI) due to the low concentration of water and the inhomogeneous magnetic environment, both of which diminish the strength of the MR signal compared to that from other organs in the body. In contrast, inhalation of hyperpolarized helium-3 (3He) gas provides a strong signal from the lung airspaces that permits high-spatial-resolution MR imaging (1, 2). Prior to performing an MRI examination with 3He, the gas is polarized outside of the scanner using a dedicated, laser-based device within which, over a period of minutes to hours (depending on the quantity of gas and details of system design), the nuclear polarization of the 3He atoms builds up to tens of percent. This polarization is several orders of magnitude larger than that achieved for protons when the human body is placed in an MRI scanner, and offsets the low density of the gas so that high-quality MR images of 3He in the airspaces of the lung can be obtained.
A number of imaging strategies have been used for hyperpolarized 3He MRI of the lung to investigate diseases such as asthma and emphysema (3–5). Of particular interest is the application of diffusion MRI techniques to probe the characteristics of the lung microstructure. These methods provide a measurement that reflects the random Brownian motion of the 3He gas atoms within the airspaces of the lung (as opposed to the trans-membrane diffusion of the gas) and the degree to which this random motion is restricted by the structure of the lung tissue. Diffusion results in attenuation of the MR signal, from which an apparent diffusion coefficient (ADC) can be calculated. The measured ADC varies inversely with the degree to which the diffusion of the gas is restricted. For example, the ADC for 3He gas in healthy lung parenchyma is substantially smaller than the corresponding diffusion coefficient in an unrestricted space, and the ADC measured in a lung with severe emphysema is larger than that for a healthy lung, reflecting the enlargement of airspaces caused by the tissue destruction that occurs with emphysema. Thus, regional changes of the microstructure that occur in pulmonary diseases such as emphysema can be characterized by measuring the ADC of 3He gas in the lung (5, 6). Further, appropriately designed measurement protocols permit representative structural dimensions to be determined (7, 8), and recent evidence suggests that ADC measurements may permit detection of subtle, sub-clinical structural changes before they become apparent on high-resolution computed tomography (9).
The ADC derived from a hyperpolarized 3He diffusion measurement depends on the details of the imaging procedure. One of the key parameters is the diffusion time, which is the period during which the atoms are allowed to diffuse within the lung for the measurement of signal attenuation. The distance that the atoms diffuse is determined by the diffusion time, increasing as the diffusion time is increased, and by the degree of restriction imposed by the lung microstructure. The vast majority of ADC measurements have been performed by using a diffusion time of a few milliseconds, which corresponds to a diffusion distance of a few hundred microns in healthy lung. (The diameter of an alveolus in a healthy adult lung is approximately 250 µm.) Although preliminary results from this technique appear very promising, such short-time-scale measurements interrogate a region the size of only a few healthy alveoli, and therefore provide little information about the connectivity among the airspaces. Considering the underlying complex, interconnected structure of the lung, it is reasonable to expect that the ADC will remain dependent on the diffusion time for periods up to at least several seconds (10). Measurements with diffusion times of tens of milliseconds (medium time scale) to several seconds (long time scale) may thus offer improved sensitivity for the detection of pathological changes that affect airspace connectivity (11, 12) and permit characterization of structural changes that are not accessible with short-time-scale measurements.
The purpose of this work is to discuss the relationship between the diffusion time and the length scales that can be explored within the lung, and to present preliminary, representative results from ongoing studies at our institution of ADC measurements in the human lung over time scales ranging from milliseconds to several seconds. To provide the reader who is unfamiliar with the details hyperpolarized-gas diffusion methods with the requisite background, we begin with a brief overview of the most common method for measuring the ADC of 3He gas in the lung.
ADC MEASUREMENT AND DIFFUSION TIME
Several approaches have been evaluated for measuring the ADC of 3He gas in the lung (5, 11, 13). Of these, the most commonly-used approach involves applying a matched pair of magnetic-field gradient pulses to the transverse magnetization in a manner analogous to that described for proton diffusion MRI many years ago by Stejskal and Tanner (14). The basic framework for making an ADC measurement based on a gradient-echo pulse sequence is illustrated in Fig 1a. After transverse magnetization is generated by an excitation radio-frequency (RF) pulse, a gradient pulse is applied along a selected direction and imparts a position dependent phase tag to the transverse magnetization. Subsequently, the atoms are allowed to diffuse during a waiting period (the diffusion time) after which a second gradient pulse is applied to unwind the phase tag imparted by the first gradient pulse. In the absence of diffusion (and ignoring effects of relaxation), the signal measured following the second gradient pulse will be the same as that which would have been measured just after the excitation RF pulse. However, in the presence of diffusion, the positions of the atoms will change between the two gradient pulses. Thus, the second gradient pulse cannot completely unwind the phase tag imparted by the first gradient pulse and the signal measured following the second gradient pulse will be attenuated compared to that measured in the absence of diffusion.
Figure 1.
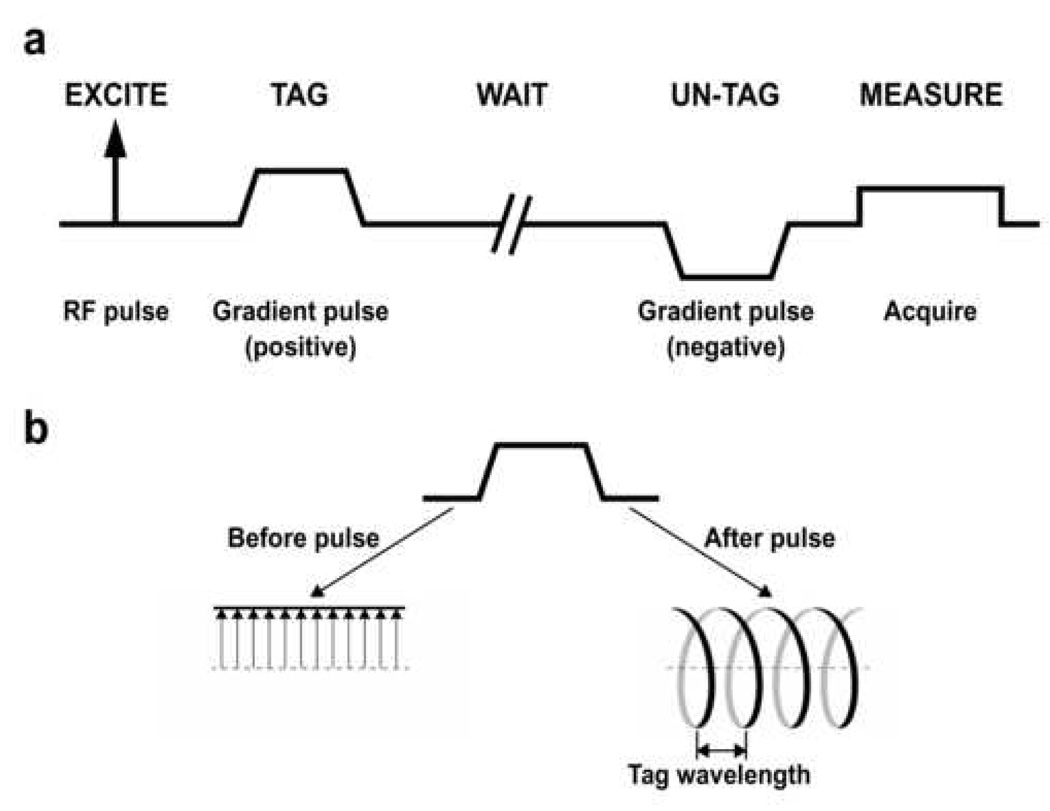
a: Basic framework for making an ADC measurement based on a gradient-echo pulse sequence. Spatial encoding gradients, which would be applied following the “un-tag” gradient pulse, are omitted for simplicity. b: The effect of the tagging gradient pulse on the transverse magnetization. The left side of the diagram shows a series of representative transverse magnetization vectors before application of the tagging pulse. The tips of these magnetization vectors fall along a straight line. The gradient twists the magnetization vectors into a helical pattern as shown on the right side of the diagram.
The effect of the tagging gradient pulse on the transverse magnetization is illustrated in Fig 1b. During the gradient pulse, the precession frequency of the transverse magnetization varies linearly with distance. As a result, the gradient pulse twists the magnetization vectors into a helical pattern that is characterized by the tag wavelength as shown. The tag wavelength is inversely proportional to the strength and duration of the tagging gradient pulse.
Together, the “tag” and “un-tag” gradient pulses that are shown in Fig 1a form what is commonly referred to as a bipolar gradient. The degree to which these gradient pulses and the intervening time delay result in attenuation of the MR signal due to diffusion is characterized by the b value; a higher b value corresponds to greater attenuation due to diffusion. For the case when the ramp times of the gradient pulses can be neglected, the b value for a bipolar gradient is proportional to the diffusion time and the square of the area under the tagging gradient pulse.
For the gradient-echo pulse-sequence configuration illustrated in Fig 1a, the maximum achievable diffusion time is limited by T2* decay of the 3He transverse magnetization in the lung. At 1.5 Tesla, which is the field strength that has been used for the majority of 3He imaging studies in humans, T2* is on the order of 20 ms (15). To overcome this limitation on the diffusion time, a stimulated-echo pulse-sequence configuration can be used (10, 16). Recall that a stimulated echo is formed by three RF pulses, wherein the phase state of the transverse magnetization is stored along the longitudinal axis between the second and third RF pulses, and thus the signal decay between these pulses is governed by T1 relaxation. Since the T1 for 3He gas in the lung is approximately 20 s (~1,000 times larger than T2*), much longer diffusion times can be accessed by using a stimulated-echo-based measurement.
The basic framework for making an ADC measurement based on a stimulated-echo pulse sequence is outlined in Fig 2. Compared to the gradient-echo-based method shown in Fig 1a, an RF pulse is applied following the “tag” gradient pulse to store the phase-tagged magnetization along the longitudinal axis. After the waiting period, the third RF pulse returns the phase-tagged magnetization to the transverse plane for measurement. Additional details on the implementation of this method for ADC measurements with hyperpolarized 3He gas can be found in reference (10).
Figure 2.

Basic framework for making an ADC measurement based on a stimulated-echo pulse sequence. Spatial encoding gradients are omitted for simplicity. The “un-tag” gradient pulse is positive (instead of negative) because the second RF pulse phase conjugates the magnetization in the process of storing it.
As noted above, the diffusion time determines the distance that the atoms are allowed to probe during the measurement. Given the free diffusion coefficient (D) of the gas mixture of interest, the mean distance (xRMS) that the atoms diffuse in an unrestricted environment can be calculated from the well-known relationship , where t is the time that the atoms are allowed to diffuse within a three-dimensional environment. (Actually, we calculate the square root of mean squared distance, termed the RMS distance, since the mean distance is zero.) The corresponding diffusion coefficient for dilute 3He in air is approximately 0.85 cm2/s.
Figure 3 shows the RMS diffusion distances for 3He in air for diffusion times ranging from 0.1 ms to 10 s. For the diffusion time corresponding to typical short-time-scale ADC measurements (~1 ms), the corresponding RMS distance for freely diffusing 3He in air is equivalent to only about three alveolar diameters, whereas the length of an acinus is several millimeters. Within the healthy lung parenchyma, the motion of 3He atoms is significantly restricted and thus the diffusion distances are less than those for the unrestricted case. For example, the ADC measured in the lungs of healthy human adults for a diffusion time of approximately 1 ms is roughly 0.2 cm2/s (5, 6). Using this value in the equation above, the corresponding RMS distance is 350 µm. Therefore, diffusion times much greater than a few milliseconds are required to permit the 3He atoms to explore the connectivity among the smallest generations of airways (e.g., acini) as well as any collateral ventilation pathways that may exist (17, 18).
Figure 3.
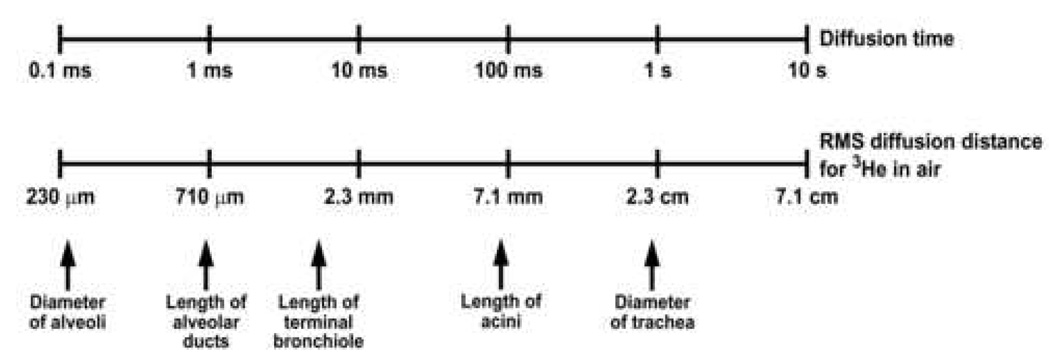
Relationship between the diffusion time and the RMS distance that 3He atoms in air diffuse in an unrestricted environment. The approximate dimensions of several structures in the human lung are indicated for comparison.
MATERIALS AND METHODS
3He diffusion MR imaging was performed using a 1.5-T commercial scanner (Magnetom Sonata, Siemens Medical Solutions, Malvern, PA) that included the multi-nuclear imaging package and a vest-shaped RF coil (Clinical MR Solutions, Brookfield, WI) tuned to the 3He resonant frequency of 48.5 MHz. All studies were performed under a physician’s Investigational New Drug application (IND 57,866) for imaging with hyperpolarized 3He using a protocol approved by our institutional review board. All subjects gave written informed consent prior to participation in the study. The subject’s heart rate and oxygen saturation level were monitored (Omni-Track Vital Signs Monitoring System, model 3100; Invivo Research Inc., Orlando FL) throughout the imaging session. All studies were supervised by a physician.
Representative ADC results obtained over a range of diffusion times are presented for 4 subjects, including 2 healthy volunteers (1 male, 1 female; ages 55, 66 yrs), 1 subject with sub-clinical chronic obstructive pulmonary disease (COPD) (male, age 70 yrs, FEV1 106 %predicted, GOLD Stage 0), and 1 subject with bronchopulmonary dysplasia (BPD) (female, age 6 yrs, FEV1 37 %predicted). (The subject with “sub-clinical” COPD has imaging findings that are indicative of early emphysema, but has normal spirometry and no clinical symptoms of lung disease.) The forced vital capacity (FVC) and forced expiratory volume in one second (FEV1) were measured in each subject on the day of imaging using a model PB100 spirometer (Puritan Bennett; Lenexa, KS) and the Knudson 1983 reference tables for predicted normal limits (19).
3He gas was polarized to a level of approximately 30% by collisional spin exchange with an optically pumped rubidium vapor using a commercial system (Model 9600 Helium Polarizer; Magnetic Imaging Technologies Inc., Durham, NC). The desired volume of hyperpolarized 3He gas (approximately 50 ml for global measurements, 200 ml for projection images and 400 ml for multi-slice measurements) was dispensed into a Tedlar plastic bag (Jensen Inert Products, Coral Springs, FL) and diluted with N2 to a total volume of approximately 1 liter, transported to the scanner room and inhaled by the subject. The total volume of gas prepared for each subject was directly proportional to the subject’s FVC, such that an inhalation volume of 1 liter corresponded to an FVC of 3.5 liters.
Short-time-scale ADC measurements were performed by using a gradient-echo-based diffusion technique as outlined in Fig 1a and described in reference (5). Medium- and long-time-scale ADC measurements were performed by using a stimulated-echo-based diffusion technique as outlined in Fig 2. This pulse sequence also included (not shown in Fig 2) the measurement of calibration data just prior to the first RF pulse of the stimulated-echo preparation. The calibration data permitted the measured signal decay to be corrected for the effects of relaxation and the RF pulses, and thus the corresponding ADC could be calculated from a single application of the pulse sequence, which is critical for practical use in human subjects. Additional technical details of the stimulated-echo-based pulse sequences can be found in references (10) and (20). Pulse-sequence parameter values for each of the ADC measurements are provided in the respective figure captions.
RESULTS AND DISCUSSION
Global (i.e., not spatially encoded and therefore integrated over the whole lung) ADC values from the lung of a healthy human volunteer for diffusion times ranging from 20 ms to 6.5 s are shown in Fig 4. ADC values for diffusion times from 20 ms to 1.5 s were measured during a breath-hold using a tag wavelength of 5 mm (solid line in Fig 4), and ADC values for diffusion times from 200 ms to 6.5 s were measured during a second breath-hold using a tag wavelength of 10 mm (dashed line in Fig 4). Both measurements were performed using a stimulated-echo-based pulse sequence. To obtain sufficient signal attenuation for an accurate measurement at short diffusion times, a relatively short tag wavelength of 5 mm was used. However, the signal attenuation with this tag wavelength for diffusion times on the order of 1 s was so large that accurate measurements could not be obtained for relatively long diffusion times. Therefore, a longer tag wavelength of 10 mm was used (during a separate breath-hold period) to obtain ADC values for diffusion times up to 6.5 s.
Figure 4.
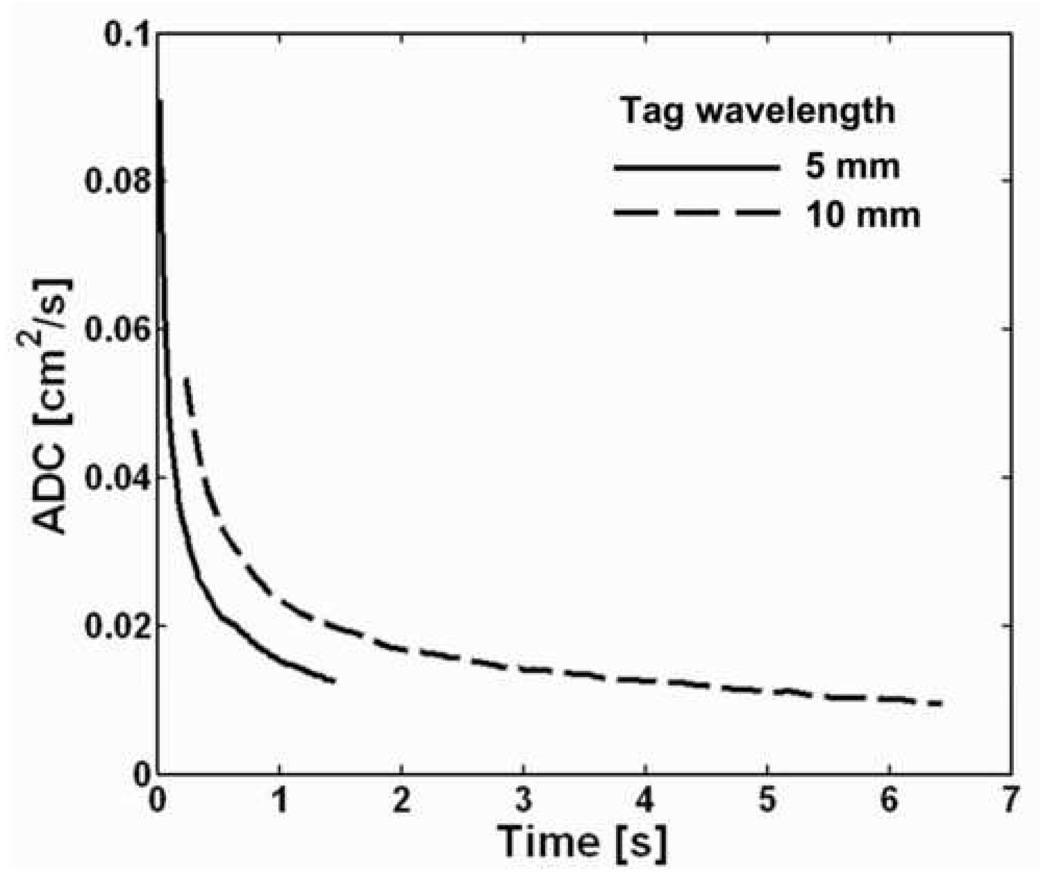
Global ADC values from the lung of a healthy human volunteer for diffusion times ranging from 20 ms to 6.5 s. ADC values for diffusion times from 20 ms to 1.5 s were measured during a breath-hold using a tag wavelength of 5 mm. ADC values for diffusion times from 200 ms to 6.5 s were measured during a second breath-hold using a tag wavelength of 10 mm. For a given tag wavelength, the ADC decreased monotonically with increasing diffusion time. Each of the two measurements was performed using a single application of a stimulated-echo-based pulse sequence with the following parameters: TR, 62 ms; TE for stimulated echoes, 6.0 ms; TE for calibration data, 0.5 ms; flip angle, 5°; number of ADC values per measurement, 24 (5-mm tag wavelength) or 102 (10-mm tag wavelength).
We observe that the ADC decreased monotonically and substantially as the diffusion time increased. For a tag wavelength of 5 mm, the ADC decreased by approximately 9-fold as the diffusion time increased from 20 ms to 1.5 s, and for a tag wavelength of 10 mm the ADC decreased by approximately 5-fold as the diffusion time increased from 200 ms to 6.5 s. The consistency of this general behavior – a smooth and substantial decrease in ADC with increasing diffusion time – has been verified in a group of ten healthy subjects by Wang et al (10).
Comparing the ADC versus diffusion time curves for the two tag wavelengths, we see that for a given diffusion time the ADC for the 10-mm tag wavelength is always greater than that for the 5-mm tag wavelength. A previous study (10) explored this behavior for tag wavelengths ranging from 6 to 15 mm and also found that for a given diffusion time the ADC increased as the tag wavelength increased. The b value is inversely proportional to the tag wavelength, and thus the observed behavior can be equivalently stated as: the ADC from a two-point measurement (i.e., reference signal and signal corresponding to a given b value) increases as the b value decreases. This same behavior has been observed for short-time-scale measurements by several investigators (7, 21, 22). The dependence of (two-point) ADC values on tag wavelength (or, equivalently, b value) highlights the fact that there is need to agree on standardized diffusion-sensitization schemes to permit quantitative comparison of ADC measurements among research groups as illustrated, for example, by the data in reference (23). On the other hand, the dependence of the ADC on b value provides an opportunity to derive additional useful information about the microstructure. This has already been demonstrated for short-time-scale measurements by Yablonskiy et al. (7); additional research is needed to determine what can be learned from similar measurements at medium or long time scales.
Coronal projection ADC maps from the lung of a healthy human volunteer for diffusion times ranging from 2 ms to 1.5 s are shown in Fig 5. The short-time-scale ADC map was acquired using the b-value pair 0 and 1.6 s/cm2, and the medium- and long-time-scale ADC maps were acquired using a tag wavelength of 5 mm (diffusion time: 50 or 200 ms) or 10 mm (diffusion time: 1.5 s). Each ADC map was acquired during a separate breath-hold period. Consistent with the behavior observed in Fig. 4 for the global ADC values, the ADC values in the maps of Fig. 5 decreased monotonically and substantially as the diffusion time increased; the mean ADC decreased by approximately 12-fold as the diffusion time increased from 2 ms to 1.5 s. The mean ADC values in the medium- and long-time-scale ADC maps of Fig. 5 were similar to the global ADC values in Fig. 4 at the corresponding diffusion times. (The results shown in Fig 4 and Fig 5 are from different subjects.)
Figure 5.
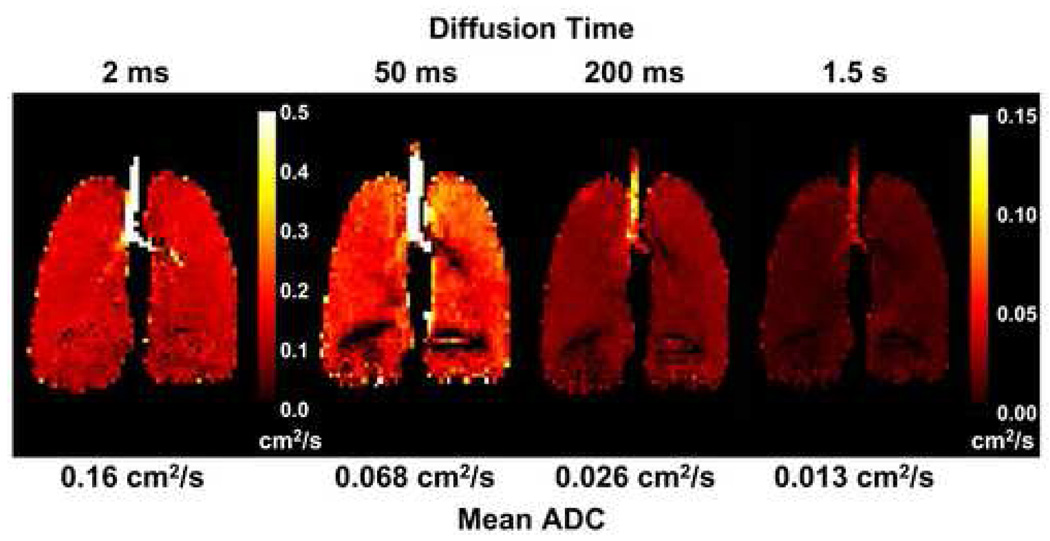
Coronal projection ADC maps from the lung of a healthy human volunteer for diffusion times ranging from 2 ms to 1.5 s. Each ADC map was acquired during a separate breath-hold period. The short-time-scale ADC map (diffusion time: 2 ms) was acquired using a gradient-echo-based pulse sequence, and the medium- and long-time-scale ADC maps (diffusion times: 50, 200 and 1500 ms) were acquired using a stimulated-echo-based pulse sequence. The ADC values decreased monotonically with increasing diffusion time, consistent with the behavior for global ADC values illustrated in Fig 4. The artifactual dark regions near the base of the lung were caused by the large susceptibility interface at the diaphragmatic surface. Parameters for the gradient-echo acquisition included: TR, 6.3 ms; TE, 4.5 ms; flip angle, 10°; b values, 0 and 1.6 s/cm2; diffusion-sensitization direction, anterior-posterior. Parameters for the stimulated-echo acquisition included: TR, 8.0 ms; TE for stimulated echo, 7.0 ms; TE for diffusion-weighted image, 2.3 ms; TE for calibration data, 3.6 ms; flip angle, 5°; tag wavelength, 5 mm (diffusion time 50 or 200 ms) or 10 mm (diffusion time 1500 ms); diffusion-sensitization direction, anterior-posterior. Parameters common to both acquisitions included: in-plane resolution, 5.9 × 5.9 mm2; slice thickness, projection. Adapted from Fig 2 in reference (20).
Figure 6 illustrates the appearance of short-time-scale (Fig 6a) and long-time-scale (Fig 6b) ADC maps in a subject with sub-clinical COPD. Overall, the relative increase in the ADC values in the long-time-scale map compared to those for a healthy subject (mean ADC 0.039 cm2/s for Fig 6b versus 0.013 cm2/s for Fig 5, right; 200% increase) was substantially larger than that for the ADC values in the short-time-scale ADC map (mean ADC 0.31 cm2/s for Fig 6a versus 0.16 cm2/s for Fig 5, left; 94% increase). In addition, as seen in Fig 6, the regional elevation of the ADC values in the lung apices was more conspicuous on the long-time-scale ADC map than on the short-time-scale ADC map. The ADC values along the dashed lines through the mid-section of the lung were 0.036 cm2/s and 0.34 cm2/s, respectively, whereas those along the dotted lines through the apices were 0.050 cm2/s (39% increase) and 0.41 cm2/s (21% increase), respectively (10). This result suggests that long-time-scale ADC measurements may be more sensitive than short-time-scale ADC measurements for detecting the microstructural alterations that occur in emphysema, and is consistent with measurements made in canine and explanted human lungs by Woods et al (11, 12) using a somewhat different technique for measuring the long-time-scale ADC; recent studies in additional human subjects continue to support this hypothesis (24).
Figure 6.
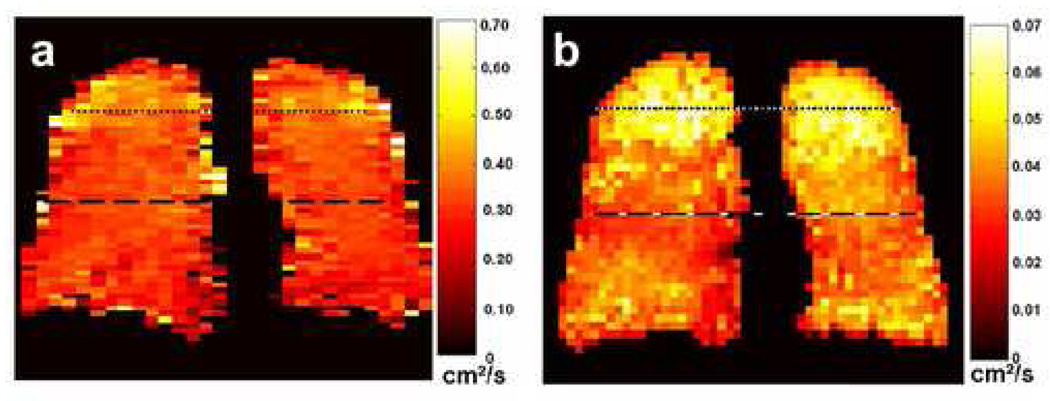
Coronal short-time-scale (a) and long-time-scale (b) ADC maps from a subject with sub-clinical COPD. The diffusion times were 2 ms and 1.5 s for the short-time-scale and long-time-scale measurements, respectively. The long-time-scale ADC map exhibits markedly elevated ADC values in the lung apices; the values in the mid-section and base of the lung are also elevated compared to those for a healthy subject (e.g., Fig 5, right-most ADC map). In contrast, the short-time-scale ADC values in the lung apices are only mildly elevated compared to those in the rest of the lung. Parameters for the short-time-scale, gradient-echo acquisition included: TR, 6.3 ms; TE, 4.5 ms; flip angle, 10°; in-plane resolution, 5.0 × 10.0 mm2; slice thickness, projection; b values, 0 and 1.6 s/cm2; diffusion-sensitization direction, anterior-posterior. Parameters for the long-time-scale, stimulated-echo acquisition included: TR, 6.4 ms; TE for stimulated echoes, 7.0 ms; TE for calibration data, 1.3 ms; flip angle, 5°; in-plane resolution, 6.3 × 7.3 mm2; slice thickness, projection; tag wavelength, 10 mm; diffusion-sensitization direction, anterior-posterior. Adapted from Fig 9 in reference (10).
Our final example is a 6-year-old child with a clinical history of BPD. The ADC maps shown in Fig 7 are from a series of axial slices that were obtained during a single breath-hold with a pulse sequence that acquired both short-time-scale and long-time-scale measurements by using a gradient-echo-based technique immediately followed by a stimulated-echo-based technique (25). The ADC values within the lung parenchyma are fairly uniform in the short-time-scale ADC map; the elevated values in the central region correspond to 3He gas in large airways. In contrast, local elevations in ADC values are seen in both lungs in the long-time-scale ADC map, and include a region of particularly elevated values in the lateral aspect of the left lung. Analogous to the results observed for early emphysema, it appears that long-time-scale ADC measurements may be more sensitive than short-time-scale ADC measurements for detecting certain microstructural alterations that occur in BPD.
Figure 7.
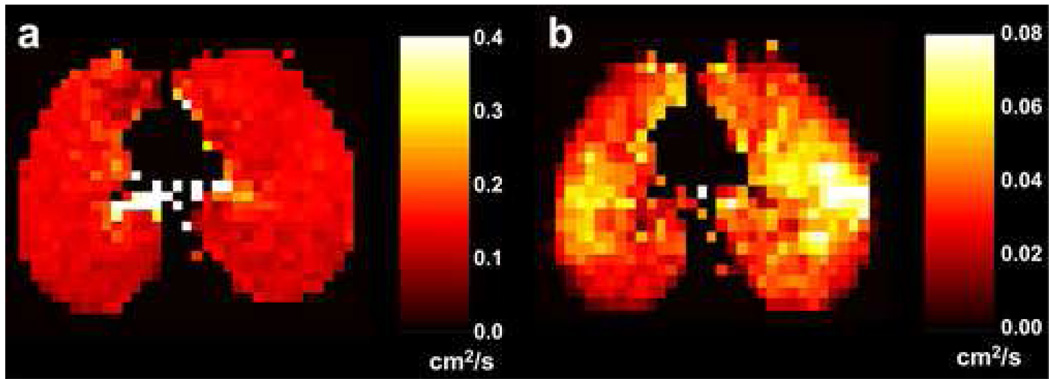
Axial short-time-scale (a) and long-time-scale (b) ADC maps from a subject with bronchopulmonary dysplasia. The diffusion times were 2 ms and 1.0 s for the short-time-scale and long-time-scale measurements, respectively. The ADC values are quite uniform within the lung parenchyma in the short-time-scale ADC map (the elevated values are gas within large airways), while local elevations of the ADC are seen in both lungs in the long-time-scale ADC map. Parameters for the short-time-scale, gradient-echo acquisition included: TR, 11.0 ms; TE, 6.7 ms; flip angle, 3°; b values, 0 and 1.6 s/cm2; diffusion-sensitization direction, head-foot. Parameters for the long-time-scale, stimulated-echo acquisition included: TR, 6.4 ms; TE for stimulated echoes, 7.0 ms; TE for calibration data, 1.3 ms; flip angle, 5°; tag wavelength, 10 mm; diffusion-sensitization direction, head-foot. Parameters common to both acquisitions included: in-plane resolution, 5.9 × 5.9 mm2; slice thickness, 40 mm.
CONCLUSIONS
By using a combination of gradient-echo-based and stimulated-echo-based pulse sequences, it is possible to explore the diffusion of hyperpolarized 3He in the human lung over more than a 1000-fold variation of the diffusion time. Diffusion measurements made over such a range of time scales provide a new opportunity to explore the microstructure of the healthy and diseased lung. In healthy human subjects, the ADC decreases by more than 10-fold as the diffusion time increases from approximately 1 ms to 1 s; the ADC remains dependent on diffusion time for times up to at least approximately 10 seconds. Preliminary experimental results suggest that measurements made at diffusion times substantially longer than 1 ms may be more sensitive for detecting certain pathological changes in the microstructure of the lung, such as those that occur in emphysema or bronchopulmonary dysplasia. Additional studies with these techniques are needed in both healthy and diseased lungs to better understand the relationship between microstructural changes and variations in the ADC with diffusion time, and to determine appropriate parameter combinations for optimum detection and characterization of pathological changes.
ACKNOWLEDGEMENTS
The authors thank John M. Christopher, RT(R)(MR), Doris A. Harding, RN and Joanne C. Gersbach, RN for valuable assistance with the MR experiments and scheduling of subjects, and Dr. Jing Cai for his expert operation of the helium polarization system.
Supported by grants R01-HL066479 and R01-HL079077 from the National Heart, Lung, and Blood Institute, a Clinical Innovator Award from the Flight Attendant Medical Research Institute and Siemens Medical Solutions. The content is solely the responsibility of the authors and does not necessarily represent the official views of the National Heart, Lung, and Blood Institute or the National Institutes of Health.
Footnotes
Publisher's Disclaimer: This is a PDF file of an unedited manuscript that has been accepted for publication. As a service to our customers we are providing this early version of the manuscript. The manuscript will undergo copyediting, typesetting, and review of the resulting proof before it is published in its final citable form. Please note that during the production process errors may be discovered which could affect the content, and all legal disclaimers that apply to the journal pertain.
REFERENCES
- 1.Moller HE, Chen XJ, Saam B, et al. MRI of the lungs using hyperpolarized noble gases. Magn Reson Med. 2002;47(6):1029–1051. doi: 10.1002/mrm.10173. [DOI] [PubMed] [Google Scholar]
- 2.van Beek EJ, Wild JM, Kauczor HU, et al. Functional MRI of the lung using hyperpolarized 3-helium gas. J Magn Reson Imaging. 2004;20(4):540–554. doi: 10.1002/jmri.20154. [DOI] [PubMed] [Google Scholar]
- 3.Altes TA, Powers PL, Knight-Scott J, et al. Hyperpolarized 3He MR lung ventilation imaging in asthmatics: preliminary findings. J Magn Reson Imaging. 2001;13(3):378–384. doi: 10.1002/jmri.1054. [DOI] [PubMed] [Google Scholar]
- 4.de Lange EE, Altes TA, Patrie JT, et al. Evaluation of asthma with hyperpolarized helium-3 MRI: correlation with clinical severity and spirometry. Chest. 2006;130(4):1055–1062. doi: 10.1378/chest.130.4.1055. [DOI] [PubMed] [Google Scholar]
- 5.Saam BT, Yablonskiy DA, Kodibagkar VD, et al. MR imaging of diffusion of 3He gas in healthy and diseased lungs. Magn Reson Med. 2000;44(2):174–179. doi: 10.1002/1522-2594(200008)44:2<174::aid-mrm2>3.0.co;2-4. [DOI] [PubMed] [Google Scholar]
- 6.Salerno M, de Lange EE, Altes TA, et al. Emphysema: hyperpolarized helium 3 diffusion MR imaging of the lungs compared with spirometric indexes--initial experience. Radiology. 2002;222(1):252–260. doi: 10.1148/radiol.2221001834. [DOI] [PubMed] [Google Scholar]
- 7.Yablonskiy DA, Sukstanskii AL, Leawoods JC, et al. Quantitative in vivo assessment of lung microstructure at the alveolar level with hyperpolarized 3He diffusion MRI. Proc Natl Acad Sci U S A. 2002;99(5):3111–3116. doi: 10.1073/pnas.052594699. [DOI] [PMC free article] [PubMed] [Google Scholar]
- 8.Shanbhag DD, Altes TA, Miller GW, et al. q-Space analysis of lung morphometry in vivo with hyperpolarized 3He spectroscopy. J Magn Reson Imaging. 2006;24(1):84–94. doi: 10.1002/jmri.20618. [DOI] [PubMed] [Google Scholar]
- 9.Fain SB, Panth SR, Evans MD, et al. Early emphysematous changes in asymptomatic smokers: detection with 3He MR imaging. Radiology. 2006;239(3):875–883. doi: 10.1148/radiol.2393050111. [DOI] [PubMed] [Google Scholar]
- 10.Wang C, Miller GW, Altes TA, et al. Time dependence of 3He diffusion in the human lung: Measurement in the long-time regime using stimulated echoes. Magn Reson Med. 2006;56(2):296–309. doi: 10.1002/mrm.20944. [DOI] [PubMed] [Google Scholar]
- 11.Woods JC, Yablonskiy DA, Chino K, et al. Magnetization tagging decay to measure long-range 3He diffusion in healthy and emphysematous canine lungs. Magn Reson Med. 2004;51(5):1002–1008. doi: 10.1002/mrm.20070. [DOI] [PMC free article] [PubMed] [Google Scholar]
- 12.Woods JC, Yablonskiy DA, Choong CK, et al. Long-range diffusion of hyperpolarized 3He in explanted normal and emphysematous human lungs via magnetization tagging. J Appl Physiol. 2005;99(5):1992–1997. doi: 10.1152/japplphysiol.00185.2005. [DOI] [PMC free article] [PubMed] [Google Scholar]
- 13.Fichele S, Paley MN, Woodhouse N, et al. Measurements and modeling of long range 3He diffusion in the lung using a "slice-washout" method. J Magn Reson. 2005;174(1):28–33. doi: 10.1016/j.jmr.2004.12.011. [DOI] [PubMed] [Google Scholar]
- 14.Stejskal EO, Tanner JE. Spin diffusion measurements: Spin echoes in the presence of a time-dependent field gradient. J Chem Phys. 1965;42(1):288–292. [Google Scholar]
- 15.Salerno M, Brookeman JR, de Lange EE, et al. Hyperpolarized 3He lung imaging at 0.5 and 1.5 Tesla: a study of susceptibility-induced effects. Magn Reson Med. 2005;53(1):212–216. doi: 10.1002/mrm.20329. [DOI] [PubMed] [Google Scholar]
- 16.Tanner JE. Use of the stimulated echo in NMR diffusion studies. J Chem Phys. 1970;52(5):2523–2526. [Google Scholar]
- 17.Terry PB, Traystman RJ, Newball HH, et al. Collateral ventilation in man. N Engl J Med. 1978;298(1):10–15. doi: 10.1056/NEJM197801052980103. [DOI] [PubMed] [Google Scholar]
- 18.Conradi MS, Yablonskiy DA, Woods JC, et al. 3He diffusion MRI of the lung. Acad Radiol. 2005;12(11):1406–1413. doi: 10.1016/j.acra.2005.07.006. [DOI] [PMC free article] [PubMed] [Google Scholar]
- 19.Knudson RJ, Lebowitz MD, Holberg CJ, et al. Changes in the normal maximal expiratory flow-volume curve with growth and aging. Am Rev Respir Dis. 1983;127(6):725–734. doi: 10.1164/arrd.1983.127.6.725. [DOI] [PubMed] [Google Scholar]
- 20.Wang C, Miller GW, Altes TA, et al. Measuring medium- and long-time-scale regional 3He diffusion using stimulated echoes. Proceedings of the 15th Annual Meeting of ISMRM; Berlin, Germany. 2007. p. 458. [Google Scholar]
- 21.Fichele S, Paley MN, Woodhouse N, et al. Investigating 3He diffusion NMR in the lungs using finite difference simulations and in vivo PGSE experiments. J Magn Reson. 2004;167(1):1–11. doi: 10.1016/j.jmr.2003.10.019. [DOI] [PubMed] [Google Scholar]
- 22.Altes TA, Mata J, de Lange EE, et al. Assessment of lung development using hyperpolarized helium-3 diffusion MR imaging. J Magn Reson Imaging. 2006;24(6):1277–1283. doi: 10.1002/jmri.20723. [DOI] [PubMed] [Google Scholar]
- 23.Fain SB, Altes TA, Panth SR, et al. Detection of age-dependent changes in healthy adult lungs with diffusion-weighted 3He MRI. Acad Radiol. 2005;12(11):1385–1393. doi: 10.1016/j.acra.2005.08.005. [DOI] [PubMed] [Google Scholar]
- 24.Wang C, Altes TA, Miller GW, et al. Short-time-scale and long-time-scale 3He diffusion MRI in emphysema: Which is more sensitive?. Proceedings of the 15th Annual Meeting of ISMRM; Berlin, Germany. 2007. p. 941. [Google Scholar]
- 25.Wang C, Miller GW, Altes TA, et al. Measurement of the diffusion of hyperpolarized 3He in human lungs over short and long time scales during one breath hold. Proceedings of the 15th Annual Meeting of ISMRM; Berlin, Germany. 2007. p. 1284. [Google Scholar]


