

Abstract
Trypanosoma brucei has two DNA compartments: the nucleus and the kinetoplast. DNA replication of these two compartments only partially coincides. Woodward and Gull [J Cell Sci 1990;95:49-57] comprehensively studied the relative timing of the replication and segregation of nuclear and kinetoplast DNA. Others have since assumed the consistency of morphological indicators of cell-cycle stage among strains and conditions. We report the use of quantitative DAPI imaging to determine the cell-cycle stage of individual procyclic cells. Using this approach, we found that kinetoplast elongation occurs mainly during nuclear S phase and not during G2, as previously assumed. We confirmed this finding by sorting cells by DNA content, followed by fluorescence microscopy. In addition, simultaneous quantitative imaging at two wavelengths can be used to determine the abundance of cell-cycle-regulated proteins during the cell cycle. We demonstrate this technique by co-staining for the non-acetylated state of lysine 4 of histone H4 (H4K4), which is enriched during nuclear S phase.
Keywords: Cell cycle, Deconvolution microscopy, DNA quantification, Fluorescence-activated cell sorting, Histone modification, Trypanosoma brucei
Members of the order Kinetoplastidae are characterized by the presence of the kinetoplast, the uniquely structured mitochondrial DNA that consists of an interlocked network of several thousand minicircles and more than twenty maxicircles. Understanding the mechanism of kinetoplast DNA (kDNA) replication has been of great interest [1,2]. Initiation of kDNA and nuclear DNA (nDNA) replication probably coincide, but kDNA segregation is completed before the onset of mitosis [3]. Any cell can hence be assigned to a specific cell-cycle stage by comparing nuclear and kinetoplast morphology. For example, cells with an elongated kinetoplast would be in the G2. However, our recent studies suggested that elongated kinetoplasts exist in nuclear S phase as well as [4].
The goal of this study was to determine the cell-cycle stage of individual cells solely by their nDNA content. Using modern fluorescence microscopy and deconvolution algorithms, we quantified nDNA by 4,6-diamidino-2-phenylindole (DAPI) staining. In contrast to Woodward and Gull [3], we found that many cells with elongated kinetoplasts are still in nuclear S phase. This approach allows cell-cycle stage determination without relying on kDNA morphology, and avoids the more complicated approach of antibody staining for known cell-cycle markers. It also can be used to quantify the abundance of cell-cycle-regulated proteins or protein modifications, during the cell cycle. To validate our cell-cycle assignments, we performed fluorescence microscopy on sorted live cells whose DNA was stained with DyeCycle Orange (DCO: Invitrogen). Advances in FACS technology and the development of new dyes make cell sorting a good approach for analysis of cells that cannot be easily synchronized.
Quantification of images requires images of high quality. Spherical aberration, nonuniform illumination, and differential response of sensor pixels, need to be avoided or corrected for. Spherical aberration occurs when light waves passing through the periphery of an objective are focused to a different position on the Z-axis than those passing through the center of the objective. This creates a significant asymmetry of the point-spread function (the observed 3-dimensional distribution of light intensity from an ideal point source). In practice, this asymmetry appears as a series of rings on either side of the focal plane (depending on imaging conditions). Spherical aberration can best be identified when rotating the Z-stack of images and looking along the Z-axis [5,6]. The image should be symmetric; out-of-focus light appearing as much below as above the focal plane. Most modern objectives are designed to minimize spherical aberration artifacts under specific conditions such as coverslip thickness (generally 170 μm), short distance between specimen and coverslip (less than a few microns), specified temperature (generally 25°C), and immersion-oil refractive index (RFI), usually 1.516 – 1.518.
We used a DeltaVision image restoration system to acquire Z-stacks of images. In order to image a large number of cells, we chose an objective lens with 60-fold magnification and number 1.5 glass coverslips (Fisher Scientific). Fisher and other vendors supply coverslips within a thickness range, which is supposedly 160-190 μm for number 1.5 coverslips. Using a micrometer (Mitutoyo Digimatic), we measured several of our coverslip batches and found them to be between 180 μm and 190 μm. Differences in what the objective ‘expects’ and what is provided can be compensated for by changing the RFI of the immersion oil accordingly. 10 μm of extra coverslip thickness can be compensated for by reducing the RFI of the immersion oil by 0.007. Similarly, an increase of temperature should be accompanied by a drop of RFI (0.001 per 2.5°C). To reduce the distance between coverslip and specimen, cells were not settled onto the slide but were settled directly onto aminopropyltriethoxysilane-coated coverslips, as described previously [4]. In addition, the attached cells were centrifuged at 800 × g for 2 min at room temperature, to achieve flat adhesion, as spherical aberration increases with specimen thickness. Coverslips were mounted in antifade solution containing DAPI (Vectashield, Vecta Laboratories). Different mounting media did not seem to affect spherical aberration, which we minimized by using a graded set of immersion oils (Applied Precision).
Statistically valid cell-cycle analysis requires comparison of several hundred cells across many images. Even after careful alignment of the light bulb, we noticed uneven illumination of the field of view. Uneven illumination can be best seen after strongly increasing the contrast of the image. To compensate for uneven illumination and differential response of pixels, we used a calibration slide (Applied Precision), focused within the slide, to avoid variations on the slide surface, and generated a calibration standard according to the manufacturer’s instructions. Once the calibration standard has been recorded, it can be applied automatically to all images during the imaging process. Calibrations need to be performed for each wavelength and image frame resolution. Since image quality was visibly better towards the center of the maximum image frame of 1024 × 1024 pixels, we decided to use an image frame of 768 × 768 pixels.
Three-dimensional deconvolution microscopy [7] requires acquisition of a stack of images at narrowly spaced parallel focal planes. Microscope objectives also collect light from out-of-focus objects, which normally blurs each image. For a stack of images, deconvolution algorithms iteratively approximate the true distribution of objects by reassigning out-of-focus light, using a point spread function previously measured for each objective. This sharpens the image and preserves the total light intensity. We use a proprietary deconvolution algorithm included in the softWoRx 3.51 software package (Applied Precision). SoftWoRx contains different deconvolution algorithms and, after comparison of the default ‘ratio’ and the milder ‘enhanced additive’ methods, we chose the latter, as this seemed to better handle residual spherical aberration apparent at the top or bottom of the specimen. Residual mismatch between the observed image and the expected image based on the inferred true distribution of objects reached its best value after about seven deconvolution iterations, which we confirmed visually.
To test the suitability of our image-based quantification, we analyzed two sets of 22 Z-stacks. Z-stacks containing 100 images were acquired at 100 nm z-intervals. To achieve consistency among images, each set of Z-stacks was recorded in one session from one coverslip, at a constant temperature and constant exposures. Temperature was kept at 25°C using a Weather Station (Precision Control). To avoid pixel saturation, optimal exposure was determined prior to image acquisition. On average, a Z-stack yielded ~12 usable cells in which the kinetoplast did not overlap with the nucleus in the Z-projection (Fig. 1C). Cells for which the nDNA content could be measured were grouped manually, based on the presence of one short kinetoplast, one elongated kinetoplast, or two short kinetoplasts. For the purpose of this study, late mitotic cells and cells with completely separated nuclei were grouped with G1/G0 cells. We classified all kinetoplasts that were clearly elongated, dumbbell shaped, or bi-lobed, as elongated. Surprisingly, the majority of cells with an elongated kinetoplast had a nDNA content corresponding to nuclear S phase (Fig. 1A).
Fig. 1.
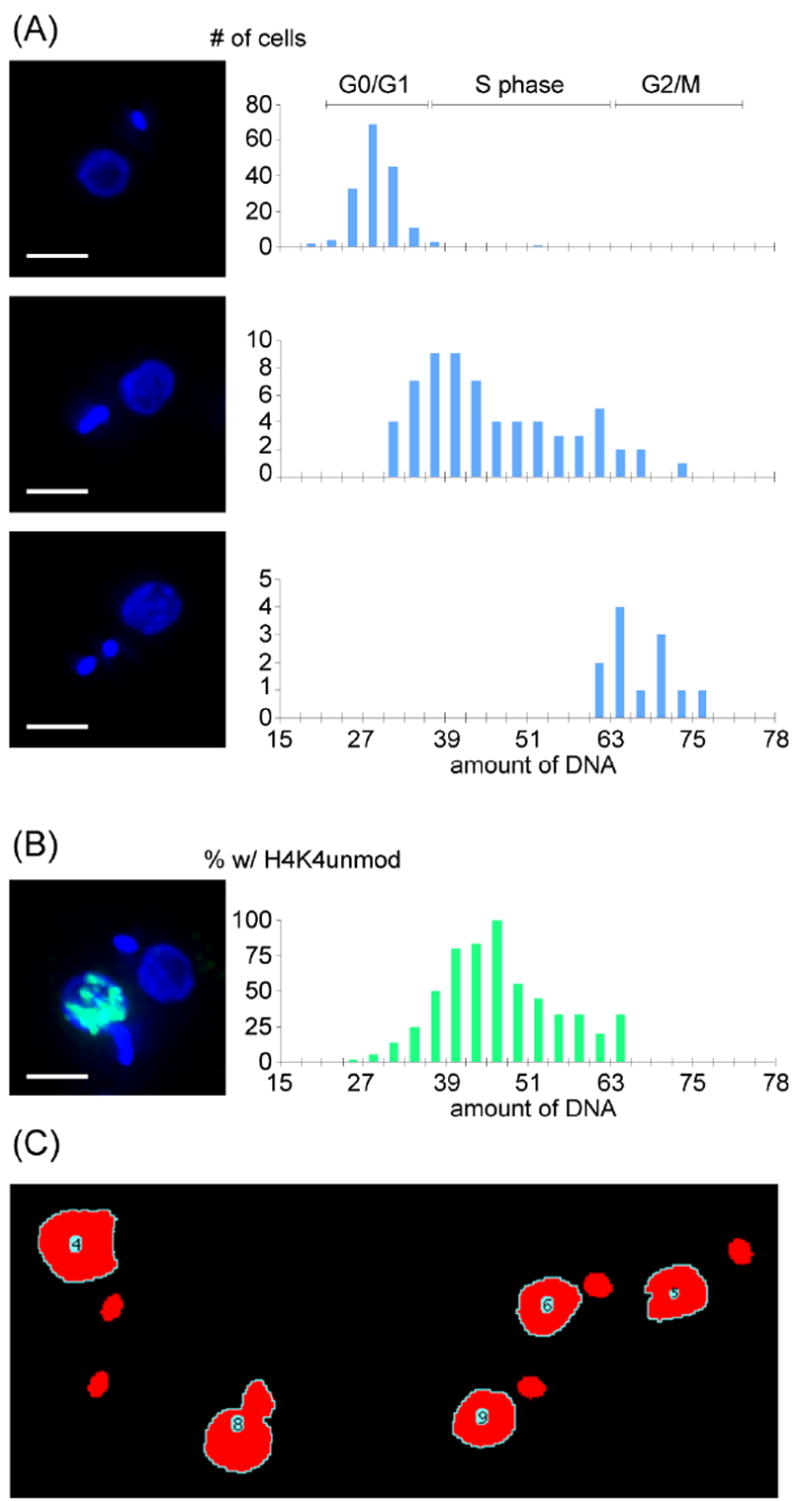
Fluorescence microscopy and signal quantification. Exponentially growing (~1.0 ×10⁷ ml-1) procyclic forms of T. brucei strain Lister 427 were used for all experiments. Images were acquired on a DeltaVision image restoration system (IX70 Olympus microscope) with a Plan Apo N 60x/1.42 NA objective (Olympus) and Photometrics CoolSnap QE camera. Deconvolution and pseudo-coloring were performed using softWoRx™ v3.5.1. (A) Representative images are shown. For 244 cells, signal intensity was measured using imageJ 1.38v, as illustrated in panel (C). (B) Images from 230 cells were collected and quantified as in (A) with additional quantification of unmodified H4K4 stained with a specific rabbit antibody and a secondary antibody conjugated to Alexa Fluor 488. Scale bar represents 3 μm. (C) To measure DAPI fluorescence from individual cells, background fluorescence was subtracted and fluorescent objects were identified in the individual image layers based on a signal intensity threshold. Next, the layer intensities were summed, signal from the kinetoplast was excluded based on a size threshold, and all remaining objects were numbered. To automate this process, we wrote a script for the freely available imaging program, imageJ (http://rsb.info.nih.gov/ij/). The figure shows the nuclear boundary and numbering determined by the automated script.
Our data contain two internal controls. First, G0/G1 cells should have the same nDNA content. We found a coefficient of variation (CV) of 13.5 % (n=168) for the DAPI emission intensity of these cells. For mitotic cells, the CV was 7.7% (n=12). Since our cultures were not synchronized, we could also compare the nDNA content of mitotic and G0/G1 cells, and should observe a ratio of 2. In practice, we found the M:G0/G1 ratio was 2.48 +/- 0.06. These results differ from those of Borst et al. [8], who determined nDNA content of T. brucei by Feulgen staining after strong denaturation (5N HCl for 60 min). Borst et al. observed similar CVs and a 1.9 fold G0/G1:M ratio. Using Friend Leukemia cells, it was demonstrated that even short treatment with 0.1 N HCl increased DAPI staining by 45%, indicating that DAPI has limited access to DNA in non-denatured cells [9]. Similar effects of denaturation were demonstrated using human amniocytes [10]. Likewise, chromatin condensation affects DAPI staining [11]. Presumably, then, chromatin condensation and protein-DNA interaction differences between G0/G1 and M phase cells explain the observed discrepancy between G0/G1 and M phase. In IF microscopy, however, denaturation or protease treatment is undesirable, and it seems wise to instead use the G0/G1 peak and mitotic cells as internal controls within a sample of interest.
nDNA fluorescence-based cell-cycle assignment could be especially useful for quantification of cell-cycle regulation of proteins or protein modifications. To test this application, we imaged cells fluorescently stained with an antibody to the unmodified histone H4 lysine 4 site (H4K4unmod). This histone mark is strongly enriched during nuclear S phase [4]. If fluorescence emission is measured at different wavelengths, it is important to correct for chromatic aberration. Both magnification and focal length vary with wavelength, so objects may appear not to co-localize even if they actually do. This is especially important in three-dimensional microscopy, as most microscopes are corrected only for lateral aberration [6]. In addition, even most modern microscopes are only properly corrected for chromatic aberration between green and red wavelengths [6]. To correct for chromatic aberration, we took advantage of the long emission tail of the DAPI signal. We excited DAPI at 360 nm and measured its light emission not only at its peak (457: filter bandwidth 50 nm) but also in the green (528: filter bandwidth 38 nm) area of the spectrum. In the absence of chromatic aberration, the images recorded at 457 nm and 528 nm should co-localize. For the objective used, the blue and green images were displaced by 0.6 μm in the Z plane. We corrected for this shift using softWoRx, then scored nuclei as either positive or negative for antibody staining, based on the summed intensity in the green channel over DAPI-positive pixels. To remove background signal, we only counted nuclei as positive for H4K4unmod staining if the summed intensity was above 50,000 relative light units (18.6% of the maximum intensity observed). Results indicating that unmodified H4K4 is enriched in S phase cells are shown in Fig. 1B.
Lastly, we validated our findings using flow cytometry. DNA of fixed or live cells was stained with propidium iodide or with DCO, respectively. Cells were sorted according to their total DNA content (this reflects nDNA content because kDNA represents only ~5% of total DNA in T. brucei [8]), then analyzed the sorted cells by fluorescence microscopy, as described previously [4]. Tubes to collect the sorted cells were coated with bovine serum albumin, to prevent cells from sticking to the wall of the tubes. The sorted cells were fixed in suspension with formaldehyde and analyzed by fluorescence microscopy as described previously [4]. In agreement with published literature [3], G1 cells contained one nucleus and one kinetoplast and G2/M cells contained one nucleus and two kinetoplast (Fig. 2A, top and bottom panels). The majority of nuclear S-phase cells contained an elongated kinetoplast (Fig. 2A, middle panel), confirming our observations from nDNA fluorescence-based cell-cycle determination and agreeing with our recent findings [4]. Results from fixed and live cells were comparable, but FACS sorting of live cells generated significantly cleaner sorts, maybe because they are less sticky than fixed cells. Post-sort analysis of live cells confirmed very homogenous populations and no further cell-cycle progression was observed (Fig. 2B).
Fig. 2.
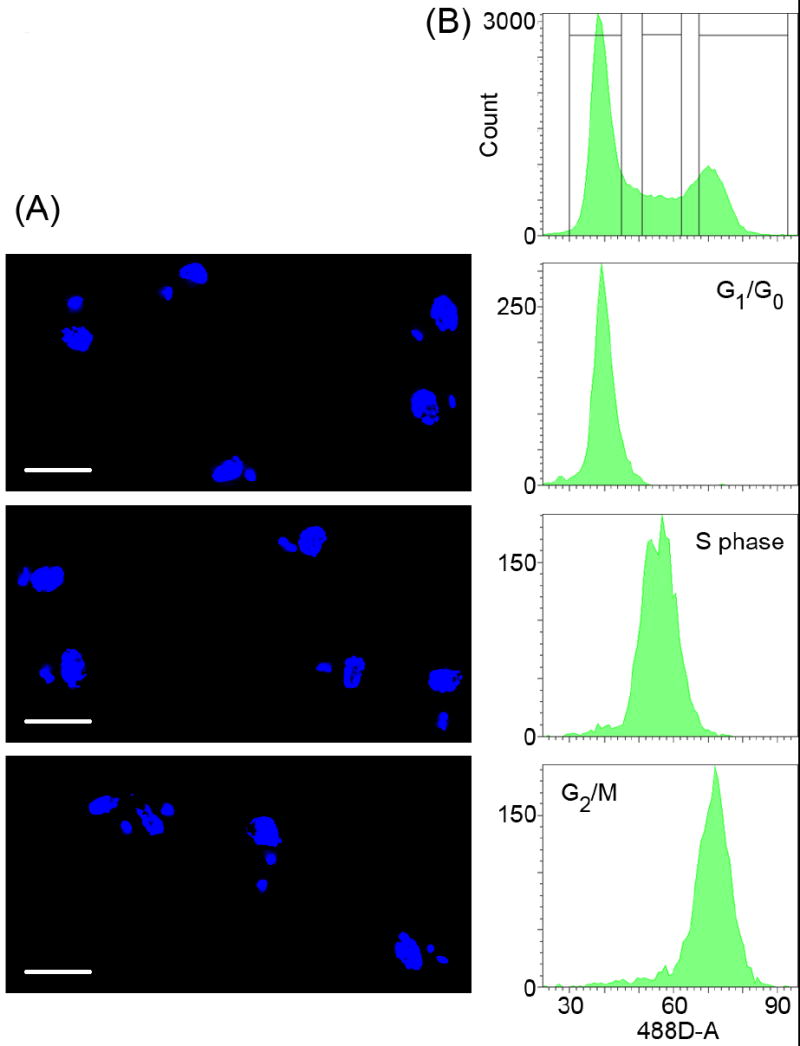
FACS sorting followed by immunofluorescence microscopy. Live procyclic forms (~1.3 × 10⁷ ml-1) were stained with in 5 mM DCO in SDM-79 [14] for 30 min at 27°C and sorted by total relative DNA content, using a FACSAria (BD Biosciences). (A) The sorted cells were fixed with formaldehyde and imaged as described in Fig. 1. Panels from top to bottom represent cells in nuclear G0/G1, S phase and G2/mitosis, respectively. Scale bar represents 5 μm. (B) FACS profiles for unsorted (top panel) and sorted cell populations (lower panels).
Previously, the non-coincident division of the nucleus and kinetoplast has served as a convenient marker for cell-cycle determination. In their seminal studies, Woodward and Gull [3] outlined the relationship between nuclear DNA replication and kinetoplast replication and division, and observed kinetoplast division (elongated kinetoplast) during G2. By our approach of image-based cell-cycle determination, we surprisingly found that the majority of cells with an elongated kinetoplast were in nuclear S phase. FACS sorting of cells based on relative DNA content followed by fluorescence microscopy confirmed this finding. The observed difference may be due to differences in cell-doubling time. The cells used in the original studies had a doubling time of 8.65 h compared to 12.5 h in our experiments. It has been observed that inhibition of nuclear S phase but not kinetoplast S phase leads to an increase in 1N2K cells, suggesting that kinetoplast division can proceed despite nuclear S-phase arrest [12,13]. If nuclear and kinetoplast cell-cycle progression are uncoupled, a longer nuclear G0/G1 or S phase may lead to a relatively earlier onset of kinetoplast division, which would explain the observed difference.
In this study, we have established a method for image-based cell-cycle determination. This approach can be used to assign a cell-cycle-regulated protein to a specific cell-cycle stage. Since the cell-cycle determination was based solely on DNA fluorescent staining and did not rely on any other markers, no additional emission channels were occupied. This leaves both the green and red channel to stain proteins of interest. By measuring the fluorescence from DAPI and H4K4unmod, we were able to prove the feasibility of the approach and to confirm that H4 unmodified at lysine 4 is strongly enriched in S-phase cells, where visual inspection of the kinetoplast would misleadingly have assigned these cells to G2.
Previously, we established a protocol for FACS sorting live cells [4]. The advantages of using live cells include faster set-up, cleaner sorts, and easy post-sort analysis by SDS-page. FACS sorting of live cells followed by SDS page analysis appears to be a good alternative to synchronizing cells, which has been a great challenge in T. brucei [4].
Acknowledgments
We thank all members of the Cross lab, especially Luisa Figueiredo and Michael Scahill, for discussions and comments on the manuscript. We would also like to thank Svetlana Mazel (The Rockefeller University Flow Cytometry Resource Center) for invaluable help in sorting cells, Alison North and Mathieu Marchand (Bio-Imaging) for help with Deltavision microscopy, and Jannika Siegel for help with data analysis. This work was supported by the National Institutes of Health (AI 21729) and by fellowships from Boehringer Ingelheim Fonds and the David Rockefeller Graduate Program.
Abbreviations
- DAPI
4,6-diamidino-2-phenylindole
- DCO
DyeCycle Orange
- FACS
fluorescence-activated cell sorting
- H4K4
histone H4 lysine 4
Footnotes
Publisher's Disclaimer: This is a PDF file of an unedited manuscript that has been accepted for publication. As a service to our customers we are providing this early version of the manuscript. The manuscript will undergo copyediting, typesetting, and review of the resulting proof before it is published in its final citable form. Please note that during the production process errors may be discovered which could affect the content, and all legal disclaimers that apply to the journal pertain.
References
- 1.Barry JD, McCulloch R, Mottram JC, Acosta-Serrano A. Trypanosomes After the Genome. Horizon Bioscience; Norfolk: 2007. [Google Scholar]
- 2.Liu B, Liu Y, Motyka SA, Agbo EE, Englund PT. Fellowship of the rings: the replication of kinetoplast DNA. Trends Parasitol. 2005;21:363–9. doi: 10.1016/j.pt.2005.06.008. [DOI] [PubMed] [Google Scholar]
- 3.Woodward R, Gull K. Timing of nuclear and kinetoplast DNA replication and early morphological events in the cell cycle of Trypanosoma brucei. J Cell Sci. 1990;95:49–57. doi: 10.1242/jcs.95.1.49. [DOI] [PubMed] [Google Scholar]
- 4.Siegel TN, Kawahara T, Degrasse JA, Janzen CJ, Horn D, Cross GAM. Acetylation of histone H4K4 is cell cycle regulated and mediated by HAT3 in Trypanosoma brucei. Mol Microbiol. 2008;67(4):762–71. doi: 10.1111/j.1365-2958.2007.06079.x. [DOI] [PMC free article] [PubMed] [Google Scholar]
- 5.Hiraoka Y, Sedat JW, Agard DA. Determination of three-dimensional imaging properties of a light microscope system. Partial confocal behavior in epifluorescence microscopy. Biophys J. 1990;57:325–33. doi: 10.1016/S0006-3495(90)82534-0. [DOI] [PMC free article] [PubMed] [Google Scholar]
- 6.North AJ. Seeing is believing? A beginners’ guide to practical pitfalls in image acquisition. J Cell Biol. 2006;172:9–18. doi: 10.1083/jcb.200507103. [DOI] [PMC free article] [PubMed] [Google Scholar]
- 7.Agard DA, Hiraoka Y, Sedat JW. Three-dimensional light microscopy of diploid Drosophila chromosomes. Cell Motil Cytoskeleton. 1988;10:18–27. doi: 10.1002/cm.970100106. [DOI] [PubMed] [Google Scholar]
- 8.Borst P, van der Ploeg M, van Hoek JF, Tas J, James J. On the DNA content and ploidy of trypanosomes. Mol Biochem Parasitol. 1982;6:13–23. doi: 10.1016/0166-6851(82)90049-4. [DOI] [PubMed] [Google Scholar]
- 9.Darzynkiewicz Z, Traganos F, Kapuscinski J, Staiano-Coico L, Melamed MR. Accessibility of DNA in situ to various fluorochromes: relationship to chromatin changes during erythroid differentiation of Friend leukemia cells. Cytometry. 1984;5:355–63. doi: 10.1002/cyto.990050411. [DOI] [PubMed] [Google Scholar]
- 10.Mongelard F, Vourc’h C, Robert-Nicoud M, Usson Y. Quantitative assessment of the alteration of chromatin during the course of FISH procedures. Fluorescent in situ hybridization. Cytometry. 1999;36:96–101. doi: 10.1002/(sici)1097-0320(19990601)36:2<96::aid-cyto2>3.3.co;2-o. [DOI] [PubMed] [Google Scholar]
- 11.Heng HH, Tsui LC. Modes of DAPI banding and simultaneous in situ hybridization. Chromosoma. 1993;102:325–32. doi: 10.1007/BF00661275. [DOI] [PubMed] [Google Scholar]
- 12.Ploubidou A, Robinson DR, Docherty RC, Ogbadoyi EO, Gull K. Evidence for novel cell cycle checkpoints in trypanosomes: kinetoplast segregation and cytokinesis in the absence of mitosis. J Cell Sci. 1999;112:4641–50. doi: 10.1242/jcs.112.24.4641. [DOI] [PubMed] [Google Scholar]
- 13.Ono T, Nakabayashi T. Studies on the effect of bleomycin on Trypanosoma gambiense. Biken J. 1980;23:143–55. [PubMed] [Google Scholar]
- 14.Brun R, Schonenberger Cultivation and in vitro cloning or procyclic culture forms of Trypanosoma brucei in a semi-defined medium. Short communication. Acta Trop. 1979;36:289–92. [PubMed] [Google Scholar]