

Abstract
Low serum HDL-cholesterol (HDL-C) is a major risk factor for coronary artery disease. We performed targeted genotyping of a 12.4 Mb linked region on 16q to test for association with low HDL-C by using a regional-tag SNP strategy. We identified one SNP, rs2548861, in the WW-domain-containing oxidoreductase (WWOX) gene with region-wide significance for low HDL-C in dyslipidemic families of Mexican and European descent and in low-HDL-C cases and controls of European descent (p = 6.9 × 10⁻⁷). We extended our investigation to the population level by using two independent unascertained population-based Finnish cohorts, the cross-sectional METSIM cohort of 4,463 males and the prospective Young Finns cohort of 2,265 subjects. The combined analysis provided p = 4 × 10⁻⁴ to 2 × 10⁻⁵. Importantly, in the prospective cohort, we observed a significant longitudinal association of rs2548861 with HDL-C levels obtained at four different time points over 21 years (p = 0.003), and the T risk allele explained 1.5% of the variance in HDL-C levels. The rs2548861 resides in a highly conserved region in intron 8 of WWOX. Results from our in vitro reporter assay and electrophoretic mobility-shift assay demonstrate that this region functions as a cis-regulatory element whose associated rs2548861 SNP has a specific allelic effect and that the region forms an allele-specific DNA-nuclear-factor complex. In conclusion, analyses of 9,798 subjects show significant association between HDL-C and a WWOX variant with an allele-specific cis-regulatory function.
Introduction
A low level of serum HDL-C is an independent risk factor for coronary artery disease (CAD [MIM 607339]).1 Approximately half of the variance observed in HDL-C levels is attributable to genetic factors; heritability estimates are 40%–60%.2,3 Low HDL-C is also a trait of a common dyslipidemia, familial combined hyperlipidemia (FCHL [MIM 144250]).1 We previously reported a linkage of the low HDL-C trait to chromosome 16q23-q24 in the combined analysis of genome-wide scans of Finnish and Dutch FCHL families.4 Linkage of HDL-C to this same region has also been observed in several additional studies, including a study of Finnish low-HDL-C families,5 Mexican Americans of the San Antonio Family Heart Study,6 the Framingham Heart Study7 and a study of French Canadian low-HDL families,8 suggesting that this region harbors one or more genes that regulate serum HDL-C levels.
The antiatherogenic properties of HDL-C are well established and include reverse cholesterol transport (RCT), as well as antithrombotic, profibrinolytic, antioxidant, and anti-inflammatory properties.9 Mutations in the gene for apolipoprotein A-I (APOA1 [MIM 107680), the most abundant apolipoprotein of HDL particles, as well as genes of the RCT pathway, including ATP-binding cassette, sub-family A member 1 (ABCA1 [MIM 600046), lecithin-cholesterol acyltransferase (LCAT [MIM 606967]), and cholesteryl ester transport protein (CETP [MIM 118470]), have been shown to underlie Mendelian forms of familial hyperalphalipoproteinemia (MIM 143470) and hypoalphalipoproteinemia (FHA [MIM 604091), including fish-eye disease (FED [MIM 136120]).10 The LCAT and CETP genes are located 10.1 Mb and 21.1 Mb centromeric to the region within one LOD of the linkage peak observed on chromosome 16q in the Finnish and Dutch FCHL families.4
Genome-wide association studies (GWAS) of predominantly type 2 diabetes (T2DM [MIM 125853]) cases and controls were recently analyzed for lipid traits, including HDL-C.11,12 These studies identified seven loci and also confirmed several genes previously known to be involved in lipid metabolism.11,12 The types of genes identified in a GWAS naturally reflect the ascertainment and phenotypic characteristics of the stage 1 samples. Because these studies were mostly based on type 2 diabetes as the disease of interest in stage 1, it is likely that some additional dyslipidemia-specific variants and genes will be identified in actual hyperlipidemic study samples. Moreover, the fact that all of the variants identified in the meta-analyses of these three studies together accounted for 5%–8% of the variation for the investigated lipid traits12 demonstrates that the SNPs identified by the GWAS approach account for a small fraction of the total genetic contribution. To identify additional genes and pathways that account for the unexplained variance, the importance of less significant GWAS signals can be further evaluated with alternative strategies that incorporate multiple lines of evidence, including association studies of linked regions, functional studies, and extension to the general population.
In the current study, we followed up on a region for HDL-C on chromosome 16q23-q24 that has been consistently replicated for HDL-C in numerous independent linkage studies.4–8 We performed targeted genotyping of tag SNPs in the 12.4 Mb LOD –1 region of linkage to test for association in stage 1, and we followed up on potentially positive signals in stage 2. Our two-stage study design utilizing European-descended dyslipidemic families and European-descended HDL-C cases and controls identified one region-wide significant SNP, rs2548861, in the WW domain-containing oxidoreductase (WWOX [MIM 605131]) gene for HDL-C. Next, we examined the population effect of rs2548861 in two independent unascertained population-based study samples: a Finnish population-based cohort of males and a Finnish population-based prospective cohort. Altogether, the variant was analyzed in 9,798 individuals. We also show functional evidence of an allelic effect of rs2548861 in WWOX by using an in vitro luciferase reporter assay and a comparative electrophoretic mobility-shift assay (EMSA).
Material and Methods
Study Participants
All participants gave written informed consent, and the institutional review board of each site approved the study protocol according to the Declaration of Helsinki principles.
Stage 1 and 2 Study Samples
The Finnish dyslipidemic families comprised of 60 FCHL and 39 low HDL-C families, were collected and phenotyped as previously described.4,5 For the stage 1 analysis, we selected the 33 Finnish FCHL and 17 low-HDL families that had a positive LOD score (LOD > 0) for microsatellites in the 16q23-q24 region on the basis of our previous genome-wide linkage analysis,4 and this resulted in a total of 50 Finnish dyslipidemic families (322 genotyped individuals). The rs2548861 SNP was subsequently genotyped and analyzed in all available participants of the 60 Finnish FCHL families (719 genotyped individuals).
Stage 2 study samples consisted of European-descended dyslipidemic families, comprised of Dutch FCHL and French Canadian low-HDL-C families and low-HDL-C cases and controls of European descent. The 31 Dutch FCHL families were collected at the Lipid Clinic of the Utrecht Academic University Hospital and in Maastricht, the Netherlands, as previously described.4,13 The 24 Dutch FCHL families (144 genotyped individuals) that had a positive linkage score to 16q23-q24 in our previous study4 were selected for the stage 2 analysis. The SNP rs2548861 was subsequently genotyped and analyzed in all available participants of the 31 Dutch FCHL families (546 individuals available for genotyping). The 28 French Canadian low-HDL-C families (467 genotyped individuals) were collected at the Cardiovascular Genetics Laboratory, McGill University Health Center, Royal Victoria Hospital in Montreal, as previously described.8 The Finnish age- and sex-specific population tenth percentiles of HDL-C were used for classifying all families of stage 1 and 2 analyses for the qualitative HDL-C trait.4 The European-descended HDL-C case-control study sample consists of 252 cases and 223 controls from the Clinique de Prévention Secondaire (CPS) cohort, collected at the Preventive Cardiology/Lipid Clinic at the McGill University Health Center, Royal Victoria Hospital in Montreal, Canada14 and from the University of California San Francisco (UCSF) Genomic Resource in Arteriosclerosis (GRA) and collected at the UCSF,15 as previously described. Cases were defined as having serum HDL-C levels below the age- and sex-specific tenth percentile, and controls had HDL-C levels above the age- and sex-specific 25th percentile based on the Lipid Research Clinics Population Studies Data Book.16
Mexican FCHL Families
Mexican FCHL families consist of 55 families (759 genotyped individuals) recruited at the Instituto Nacional de Ciencias Médicas y Nutrición Salvador Zubirán in Mexico City; the inclusion and exclusion criteria used were as described previously.17 The Mexican age- and sex-specific tenth percentiles for HDL-C were used for classifying the HDL-C affection status.18 We estimated the power of this study sample with 44 low-HDL-C affected subjects (≤10th age-sex population percentile) to be 30% by using the PBAT software package.19 Therefore, we included these Mexican FCHL families in the overall combined analysis rather than analyzing them alone.
Finnish METSIM Cohort
The METSIM (metabolic syndrome in men) cohort consists of 4,917 subjects (4,463 genotyped subjects) of the ongoing METSIM Study comprised of males, age 50–70 years, randomly selected from the population of Kuopio in Eastern Finland (population 95,000).20 Recruitment, data collection, and phenotypic determinations were performed at the University of Kuopio. All participants underwent an evaluation of their disease history, drug treatment, and cardiovascular risk factors. A fasting blood sample was taken from all participants and tested for an extensive panel of lipid, glucose, and other metabolic traits. Serum HDL-C levels were measured by the enzymatic colorimetric method (Konelab 20XTi Clinical Chemistry Analyzer, Vantaa, Finland).
The Cardiovascular Risk in Young Finns Cohort
The Young Finns cohort is a Finnish longitudinal population study sample on the evolution of cardiovascular risk factors from childhood to adulthood.21 The first cross-sectional survey was conducted in 1980 in five Finnish university cities and their rural surroundings and included 3,596 participants who were in the age groups of 3, 6, 9, 12, 15, and 18 years and were randomly chosen from the national population register; equal ratios of males and females were selected in each age group. Between 1980 and 1992, these cohorts were re-examined in 3–6 year intervals. In the latest follow-up in 2001, a total of 2,283 participants (of which DNA is available from 2,265 participants) were examined for numerous study variables, including serum lipoproteins, glucose, insulin, obesity indices, blood pressure, life-style factors, smoking status, alcohol use and general health status.
SNP Selection
To select the most informative and nonredundant SNPs for the first-stage genotyping, we utilized a tag SNP strategy in the 12.5 Mb linked region by using the HapMap pre-Phase I data.22 Tag SNPs were selected for the CETP and LCAT genes, including a 10 Kb region upstream of each gene. We used the LDSelect program23 to select 1,349 tag SNPs with minor allele frequency (MAF) > 0.1 and an r2 threshold of 0.85. In addition, 63 nonsynonymous SNPs were selected from genes within the region for a total of 1,412 SNPs that were genotyped in the first stage.
In the second stage, we selected 15 SNPs within or near the A-T binding factor 1 (ATBF1 [MIM 104155]), contactin-associated protein-like 4 (CNTNAP4 [MIM 610518]), ADAM metallopeptidase with thrombospondin type 1 (ADAMTS18 [MIM 607512]), WWOX, cadherin 13 (CDH13 [MIM 601364]) and in the intergenic region between v-maf musculoaponeurotic fibrosarcoma oncogene (MAF [MIM 177075]) and the dynein light chain roadblock-type 2 (DYNLRB2 [MIM 607168]) genes that provided evidence of association with p ≤ 0.01, as well as ten SNPs within these genes with p < 0.05, resulting in a total of 25 SNPs selected for stage 2.
Genotyping
The stage 1 genotyping of 1,412 SNPs was performed with the Illumina Goldengate custom panel (Illumina Inc.) at the Southern California Genotyping Consortium. We obtained a 97% success rate for the SNPs; there were 49 failed SNPs, 98% of the subjects were successfully genotyped, and six subjects were excluded from analysis. For the remaining SNPs, a genotyping call rate greater than 98% was obtained. Forty-two SNPs that were non-polymorphic and three SNPs with Hardy-Weinberg equilibrium (HWE) p value < 0.001 were excluded from the analysis, resulting in 1318 SNPs that were analyzed. Genotyping of the 25 second-stage replication SNPs was performed by deCODE with a deCODE/Nanogen customized SNP platform (deCODE, Reykjavik, Iceland), and a genotyping call rate greater than 90% was obtained for all SNPs. The rs2548861 SNP was genotyped in the METSIM and Young Finns cohorts with the TaqMan Allelic Discrimination Assays (Applied Biosystems, Foster City, California). In the Mexican FCHL families, rs2548861 was genotyped with the Pyrosequencing technique on the PSQ HS96A platform at the UCLA Genotyping and Sequencing Core Facility (GenoSeq) with a 94% genotyping call rate. The rs2548861 was in HWE (p > 0.5) in all population samples analyzed. The Pedcheck program was used for detecting Mendelian errors in the families.24
Resequencing
The exons and exon-intron boundaries of the three refseq validated isoforms of the WWOX gene were resequenced in 16 Finnish dyslipidemic probands from the families that provided the strongest signal for both linkage with microsatellite markers in the 16q23-q24 region and association with rs2548861 in the first-stage analysis. In addition, a 525 bp region surrounding rs2548861 was resequenced in 48 Finnish probands and 24 Dutch probands. The samples were amplified by PCR for the Applied Biosystems 3730 Capillary DNA Analyzer (Applied Biosystems). PCR primers were designed with the Primer3 program.25 Sequence contigs were assembled with the use of the Sequencher software (GeneCodes Corporation, Ann Arbor, MI).
Statistical Analysis
Because 16q is a known region of linkage for HDL-C, association analysis of the stage 1 and 2 families was performed with the empirical variance option –e of the family-based association test (FBAT) software26 that tests for association in the presence of linkage. The stage 1 and 2 dyslipidemic families were ascertained through a proband and at least one affected first-degree relative with dyslipidemia. We tested HDL-C as a binary trait because the variance of HDL-C is reduced for effective quantitative analysis in the stage 1 and 2 dyslipidemic families, which have on average five low-HDL-C affected individuals per family. We tested the additive model in stage 1 because several studies have shown that it is robust for detecting association even when the true genetic model is not additive.27–29 In the joint analysis of stage 1 and 2 families, we tested both the additive and dominant models and present the model that provided the more significant result (Table 1). The recessive model was not tested because our family study did not have sufficient power to detect susceptibility alleles with a recessive mode of inheritance. The case-control subjects of European descent were analyzed by logistic regression analysis for the additive and dominant models also, as implemented in the PLINK v1.01 software.30 We estimated the marginal effect size of rs2548861 on the basis of the logistic regression coefficient (β) and the sample average proportion (P), according to the equation MES = β × P (1 − P). We also performed a combined analysis of the family-based and case-control studies (n = 1,408) by using the Z method to combine the statistics for the 25 SNPs. We combined test statistics from the family-based and the case-control studies by using equal weights to calculate the corresponding combined p value.12,31 In addition, for the SNP rs2548861, all available subjects of the stage 1 and 2 families, the case-control subjects, and 55 Mexican FCHL families were included in an overall combined analysis (n = 3,070). To correct for the multiple tests performed, we adjusted for 1,318 SNPs tested in stage 1 and 25 SNPs tested for the additive and dominant models, resulting in Bonferroni correction for 1,368 independent tests in the combined analysis of stage 1 and 2 and for 1,369 tests in the overall combined analysis. We also estimated this p value empirically by combining the statistics from 50,000 random permutations of the case-control status and 50,000 random gene-dropping procedures in the families. We used the Mendel software for the gene-dropping procedure.32 To examine the evidence for linkage in families associated with the risk allele of rs2548861, we performed subset linkage analyses by using an approach similar to one described previously.33 We divided the families based on whether the family contributed positively to the Z score statistic of FBAT.26 The location score analysis of the SimWalk2 program34 v.2.91 was used for performing the parametric multipoint analysis for each subset and for the combined samples.
Table 1.
Association Results of Stage 1 and 2 Analyses for the Low-HDL-C Trait
| SNP | Nearest Gene | Allele | Frequencya | Stage 1 Families |
Modelb | Stage 1 and 2 Family-Based Joint Analysisc |
Stage 2 Cases and Controls |
Stage 1 and 2 Combined Analysis |
||||||
|---|---|---|---|---|---|---|---|---|---|---|---|---|---|---|
| Z | P | Z | P | Frequencyd | OR (95% CI)e | Z | P | Z | P | |||||
| rs1837020 | ATBF1 | A | 0.19 | −2.0 | 0.05 | A | −1.4 | ns | 0.19/0.16 | 0.9 (0.6–1.2) | −0.9 | ns | −1.6 | ns |
| rs2157786 | ATBF1 | A | 0.75 | 2.6 | 0.01 | A | 3.0 | 0.003 | 0.67/0.67 | 1.0 (0.7–1.3) | 0.2 | ns | 2.2 | 0.03 |
| rs8056528 | ATBF1 | C | 0.25 | −2.9 | 0.004 | D | −2.9 | 0.003 | 0.30/0.33 | 1.1 (0.8–1.7) | 0.8 | ns | −1.5 | ns |
| rs160952 | CNTNAP4 | T | 0.29 | 2.8 | 0.005 | A | 2.2 | 0.03 | 0.25/0.24 | 1.0 (0.7–1.3) | −0.2 | ns | 1.4 | ns |
| rs160948 | CNTNAP4 | T | 0.25 | 3.0 | 0.003 | A | 2.0 | 0.04 | 0.25/0.24 | 0.9 (0.7–1.3) | −0.4 | ns | 1.1 | ns |
| rs6564312 | CNTNAP4 | C | 0.63 | 2.5 | 0.01 | D | 2.0 | 0.04 | 0.65/0.65 | 0.7 (0.4–1.1) | 1.5 | ns | 2.5 | 0.01 |
| rs7196352 | CNTNAP4 | A | 0.39 | −1.9 | 0.05 | D | −1.5 | ns | 0.43/0.39 | 0.9 (0.6–1.4) | −0.3 | ns | −1.3 | ns |
| rs768503 | ADAMTS18 | A | 0.14 | −2.5 | 0.01 | A | −1.2 | ns | 0.10/0.12 | 1.2 (0.8–1.7) | 0.8 | ns | −0.3 | ns |
| rs8059387 | ADAMTS18 | T | 0.85 | −2.5 | 0.01 | D | −1.5 | ns | 0.86/0.88 | 0.9 (0.1–6.6) | 0.1 | ns | −1.0 | ns |
| rs7198627 | ADAMTS18 | C | 0.46 | 2.3 | 0.02 | D | 1.2 | ns | 0.45/0.46 | 1.0 (0.7–1.5) | 0.1 | ns | 0.9 | ns |
| rs2943768 | WWOX | G | 0.16 | 2.4 | 0.02 | A | 2.0 | 0.05 | 0.19/0.21 | 1.2 (0.9–1.6) | 1.0 | ns | 2.1 | 0.04 |
| rs2287951 | WWOX | C | 0.15 | 2.7 | 0.007 | D | 2.2 | 0.03 | 0.21/0.22 | 1.2 (0.8–1.7) | 0.9 | ns | 2.2 | 0.03 |
| rs2548861 | WWOX | T | 0.38 | 2.6 | 0.01 | D | 3.2 | 0.001 | 0.39/0.45 | 2.0 (1.4–3.0) | 3.6 | 0.0004 | 4.8 | 1.4 × 10⁻⁶ |
| rs2656612 | WWOX | C | 0.14 | 2.3 | 0.02 | D | 1.8 | 0.08 | 0.14/0.16 | 1.2 (0.8–1.8) | 0.9 | ns | 1.8 | 0.06 |
| rs1111230 | WWOX | C | 0.52 | 2.4 | 0.01 | D | 1.6 | ns | 0.52/0.47 | 0.9 (0.6–1.4) | −0.3 | ns | 1.0 | ns |
| rs4517809 | MAF | A | 0.38 | −2.3 | 0.02 | D | −1.8 | 0.07 | 0.43/0.35 | 0.6 (0.4–0.9) | −2.4 | 0.02 | −3.0 | 0.003 |
| rs1110789 | MAF | T | 0.48 | −2.7 | 0.006 | D | −2.0 | 0.04 | 0.48/0.49 | 1.2 (0.8–1.9) | 0.9 | ns | −0.8 | ns |
| rs1126264 | MAF | T | 0.15 | 2.4 | 0.02 | A | 1.7 | 0.08 | 0.14/0.16 | 1.1 (0.8–1.6) | 0.6 | ns | 1.6 | ns |
| rs1433157 | CDH13 | G | 0.52 | −2.3 | 0.02 | D | 2.1 | 0.04 | 0.52/0.52 | 1.0 (0.6–1.5) | 0.1 | ns | 1.5 | ns |
| rs8046812 | CDH13 | G | 0.22 | −2.3 | 0.02 | D | −1.8 | 0.08 | 0.22/0.23 | 1.0 (0.7–1.4) | −0.2 | ns | −1.4 | ns |
| rs4598906 | CDH13 | T | 0.40 | 3.2 | 0.001 | D | 1.3 | ns | 0.30/0.34 | 1.2 (0.8–1.7) | 0.9 | ns | 1.6 | ns |
| rs7498488 | CDH13 | G | 0.29 | −3.3 | 0.0008 | A | −1.6 | ns | 0.32/0.33 | 1.0 (0.8–1.3) | 0.2 | ns | −1.0 | ns |
| rs2228685 | CDH13 | A | 0.56 | 2.8 | 0.005 | D | 1.8 | 0.07 | 0.54/0.54 | 1.0 (0.6–1.6) | −0.04 | ns | 1.3 | ns |
| rs4366698 | CDH13 | C | 0.69 | 2.9 | 0.004 | D | 0.9 | ns | 0.69/0.68 | 0.7 (0.4–1.2) | 1.3 | ns | 1.5 | ns |
| rs4238692 | CDH13 | T | 0.28 | 2.2 | 0.03 | D | 2.6 | 0.009 | 0.28/0.28 | 1.1 (0.8–1.6) | 0.4 | ns | 2.1 | 0.03 |
Allele frequency in the stage 1 and 2 families combined.
Model indicates the genetic model that provided the most significant result in the joint analysis of the family-based samples. A indicates the additive model and D indicates the dominant model.
The 50 Finnish dyslipidemic stage 1 families and 52 European-descended dyslipidemic stage 2 families were included in this analysis.
Allele frequency in the European-descended dyslipidemic controls and cases.
OR (95% CI) indicates the odds ratio and 95% confidence interval. The SNP that was significant after Bonferroni correction for multiple testing is indicated in bold. ns indicates p ≥ 0.1.
All statistical analyses of the population-based cohorts were performed with the SPSS 15.0 software. Because the METSIM and Young Finns studies represent unascertained population-based samples, we assessed the effect of rs2548861 on continuous HDL-C measurements. We used independent t tests with a dominant model of inheritance coded as G/G = 0 and both T/T and G/T = 1 as an independent variable, consistent with the dominant mode of inheritance observed in the stage 1 and 2 analysis. We used standardized HDL-C residuals (Z scores, mean = 0 and standard deviation [SD] = 1) prepared separately by sex when applicable and adjusted for the ln(BMI) and age. In the Young Finns cohort we analyzed the average of the 4 HDL-C measurements taken in 1980, 1983, 1986, and 2001, as well as each year individually. In the METSIM cohort, we also performed the association analysis by excluding subjects reimbursed for medication for the treatment of T2DM or coronary heart disease (i.e., a lipid-lowering drug) as well as subjects with BMI greater than the Finnish age- and sex-specific 90th percentile35 because these factors are known to alter serum HDL-C levels. Marginal effect sizes (ES) were directly calculated on the basis of the t-statistics (ES = t × sqrt[[n0 + n1]/[n0 × n1]], ni = number of subjects coded as i). The effect size represents the proportion of one-standard-deviation change in standardized HDL residual (adjusted for covariates) for a carrier of the T risk allele. In the Young Finns cohort, the longitudinal data were analyzed by repeated-measures analysis of variance (RANOVA), for which we assumed a dominant model of inheritance as a categorical factor and used HDL-C measurements taken in 1980, 1983, 1986, and 2001 as dependent repeated variables. Consistent with the independent t test, we used age and ln(BMI) adjusted Z scores prepared separately by sex as the dependent variable in the model for the RANOVA analysis. In the METSIM cohort, HDL-C values greater than 4 standard deviations from the mean were excluded as outliers (ten subjects), and in the Young Finns cohort, only participants with complete data for the four different time points of the follow-up study were included (n = 1,561). We also performed a combined analysis of the METSIM and Young Finns cohorts by using a combined statistic. We calculated an overall statistic weighted by the square root of the proportion of individuals examined in each cohort to calculate the corresponding p value.12,31
Luciferase Reporter Assay
A 691 bp region of high conservation surrounding the associated rs2548861 and including the predicted cis-regulatory element was cloned into the TOPO-TA vector (Invitrogen, Carlsbad, CA) with the following primers: 5′-TCATGTTCCCTTCGGAAAAC-3′ and 5′-TTTGTGTGTACAGACTCCAGGTG-3′. The DNA fragments were subcloned into pGL3-promoter vector (Promega, Madison, WI) by use of the SalI- and BamHI-cloning sites downstream of the luciferase reporter transcript. The rs2738572-rs2548861 haplotypes C-G and A-T were produced from the haplotype C-T with the QuickChange site-directed mutagenesis kit (Stratagene, La Jolla, CA) according to the manufacturer's protocol. HepG2 cells were cultured in MEM supplemented with 10% fetal bovine serum, 100 I.U./ml penicillin, and 100 mg/ml streptomycin (Cellgro, Mediatech Inc., Manassas, VA) and transiently transfected by Lipofectamine 2000 reagent (Invitrogen) according to the manufacturer's protocol on 48-well plates. At approximately 80% confluence, each well was transfected with 400 ng of the experimental reporter gene (pGL3-promoter vector constructs) and 27 ng of the transfection control plasmid pRL-TK (Promega) encoding the renilla luciferase gene. Growth medium (200 μl) without penicillin and streptomycin was added 24 hr after transfection. The luciferase activity of each construct was measured six times, and the different constructs were compared with a two-tailed t test under an assumption of equal variance. Error bars represent the SD. The luciferase activity was measured with the dual-luciferase reporter assay system (Promega), which uses the renilla luciferase signal to normalize the luciferase intensity. Cells in each well were lysed with 100 μl lysis buffer, and luciferase activity was measured from 30 μl of cell lysate with a luminometer (GloMax 96 Microplate Luminometer, Promega).
EMSA
The nuclear proteins were extracted from the HepG2 cell line by NE-PER nuclear-extraction reagents (Pierce, Rockford, IL), and protein concentrations were quantified by the Bradford assay. Complementary 5′ biotinylated and unlabeled oligonucleotide probes 5′-ACCATTCAAATCTT(T/G)CCCTCACAGGACAAT-3′ and 5′-ATTGTCCTGTGAGGG(A/C)AAGATTTGAATGGT-3′, representing both alleles of rs2548861, were commercially obtained (Operon Biotechnologies). For the EMSA, nuclear proteins (5 μg) were preincubated in binding buffer (10 mM Tris-HCl [pH 7.5]; 50 mM NaCl; 1 mM dithiothreitol; 1 mM EDTA; and 5% glycerol) for 10 min with or without the unlabeled double-stranded specific competitor probe in 200-fold molar excess (4 pmol). Subsequently, the biotin-labeled double-stranded oligonucleotide probe (∼20 fmol) was added to 20 μl of total reaction volume, and the mixture was kept at room temperature for 30 min, followed by 15 min on ice. For the competition EMSA experiment, nuclear proteins were preincubated in binding buffer with unlabeled double-stranded allele-specific competitor probes in 25-, 50-, and 100-fold molar excess for 10 min. As a nonspecific competitor, an unlabeled scrambled oligonuceotide with the same base composition as that of the probes was used at 200-fold molar excess. Reactions were analyzed on a 6% Novex DNA retardation gel (Invitrogen) that was electroblotted onto a positively charged nylon membrane. The biotin-labeled probe (∼20 fmol) in binding buffer without the addition of nuclear protein extract and competitor probe was used as the negative control. Detection of a shift in the mobility of the biotin-labeled probe was achieved after incubation of the membrane with streptavidin-horseradish peroxidase and development with luminol substrate (Pierce; Lightshift Chemiluminescent EMSA kit). Light emission was captured on X-ray film.
Expression Analysis of WWOX
The expression of the full-length isoform 1 of WWOX was analyzed by RT-PCR with the Human Multiple Tissue cDNA panel 1 (MTC-1) (Clontech, Mountain View, CA) and cDNA obtained from adipose tissue (Invitrogen, Carlsbad, CA). A 106 bp fragment was amplified with primer pairs 5′-ATGGTGCACATGTGATCTTGGCCT-3′ and 5′-AGGGTCATTGCTTCTACCTTGGCT-3′, under the following conditions: 94°C for 10 min, 35 cycles of 94°C for 30 s, 61°C for 30 s, 72°C for 30 s, and then by 72°C for 8 min. A 983 bp fragment of the housekeeping gene glyceraldehyde-3-phosphate dehydrogenase (GAPDH [MIM 138400]) was also amplified from the same cDNAs under the same PCR conditions with primers provided by the manufacturer (Clontech, Mountain View, CA). The PCR products were then electrophoresed on a 1.5% agarose/EtBr gel.
Results
Stage 1 Association Analysis
We utilized a two-stage design to investigate a 12.4 Mb region on chromosome 16q23-q24 with LOD scores within 1.0 of the highest LOD score in the combined Dutch/Finnish linkage analysis4 and including the Mexican American linkage peak.6 In this design, we genotyped all 1,318 regional tag SNPs in Finnish dyslipidemic families to screen for association signals in stage 1. We genotyped potentially positive signals in the stage 2 dyslipidemic families and case and control study samples, and we performed a combined analysis of the two stages to identify the variants that were of region-wide significance. Skol et al.31 originally introduced this design to reduce the cost of genotyping in stage 1 while maintaining the overall power of the study.
In stage 1, a total of 1,318 SNPs were tested for association via the additive model in 50 Finnish dyslipidemic families with positive evidence of linkage to the region for the low HDL-C trait; option −e of the FBAT software, which tests for association in the presence of linkage, was used. We also included tagSNPs for the LCAT and CETP genes, even though they are located outside of the LOD −1 region, because they are highly relevant functional candidates that were also implicated for HDL-C in the recent GWAS ascertained for T2DM.11,12 The clinical characteristics of all study samples are presented in Table S1. The most significant association was observed for rs7498488, within the CDH13 gene (p = 0.0008) (Figure 1, Table 1). In addition, 14 SNPs located within or near ATBF1, CNTNAP4, ADAMTS18, WWOX, and CDH13 and in the intergenic region between the MAF and DYNLRB2 genes were associated at a significance level of p ≤ 0.01 (Figure 1, Table 1). We selected 15 SNPs that provided p ≤ 0.01, as well as ten SNPs within these genes or intergenic regions with p values less than 0.05, resulting in a total of 25 SNPs that were studied again in stage 2. The SNPs within the CETP and LCAT genes did not result in p values < 0.05 in stage 1 for the qualitative low HDL-C trait in the Finnish families.
Figure 1.

Association Results of Stage 1 and Combined Analyses of Stages 1 and 2
The −log10 of the p values obtained from the stage 1 FBAT −e analysis and the combined analysis of stage 1 and 2 study samples are shown. Black circles represent the 25 stage 1 SNPs that were re-examined in the stage 2 study samples. Results of the combined analysis of stage 1 and 2 family-based and case-control samples are shown in larger open circles (for details of analysis model, see Table 1). The open triangle indicates the result of the overall combined analysis of all dyslipidemic samples (n = 3,070). Small gray circles are the 1293 stage 1 SNPs that were not re-examined in the stage 2 samples. p = 3.7 × 10⁻⁵ indicates the Bonferroni corrected significance threshold.
Stage 1 and 2 Association Analysis
The 25 SNPs selected from the stage 1 analysis were tested in a joint analysis of the stage 1 and 2 families by the same method as in stage 1, with FBAT option −e, and both the additive and dominant models were tested (Table 1). This analysis included a total of 102 dyslipidemic families (50 Finnish and 52 European-descended families; n = 933). The SNP rs2548861 within WWOX was the most significantly associated SNP, with p = 0.001 for the dominant model and the same T risk allele as in stage 1 (Table 1). We also analyzed the 25 SNPs in 475 European-descended low-HDL-C cases and controls for the additive and dominant models by using the logistic regression test. Consistent with the family-based results, the rs2548861 SNP in WWOX was also associated with the dominant model and the same T risk allele in the cases and controls (p = 0.0004, OR = 2.0, 95% CI = 1.4–3.0) (Table 1). Thus, one copy of the T allele of rs2548861 increases the probability for low HDL-C by approximately 17% in this case-control study sample. Two SNPs within ATBF1, rs2157786 and rs8056528, were also significant in the family-based analysis (p = 0.003 for both SNPs), but not in the case-control samples (p > 0.4) (Table 1). Next, we performed a combined analysis of the stage 1 and 2 family and case-control study samples for the 25 SNPs by combining the Z statistics, as described in the Material and Methods. We observed a significant association between rs2548861 and low HDL-C (p = 1.4 × 10⁻⁶) for the dominant model and the same T risk allele (Figure 1). This result is region-wide significant: It surpasses the Bonferroni correction for the 1318 SNPs tested in stage 1, as well as the two models tested for 25 SNPs in the combined analysis of stage 1 and 2 (Bonferroni adjusted p = 0.002) (Figure 1).
For the rs2548861 SNP that was identified to be region-wide significant by our two-stage study design, we included all available subjects of the stage 1 and 2 families, the case-control subjects, and 55 Mexican FCHL families in an overall combined analysis of family-based and case-control samples (n = 3,070) and observed a p value of 6.9 × 10⁻⁷ (Bonferroni adjusted p = 0.0009) (Figure 1). We also estimated the empirical significance of this overall combined statistic for rs2548861 in all of the dyslipidemic study samples (n = 3,070) by combining the statistics obtained from 50,000 random permutations of the case-control status and 50,000 random gene-dropping procedures in the families to estimate the p value. All 50,000 permuted statistics were less significant than Z = 4.96 obtained for rs2548861. Because the gene-dropping procedure is computationally intensive, we limited the number of permutations to 50,000, which is the number necessary for exceeding the Bonferroni correction of p = 3.7 × 10⁻⁵. To summarize, we observed an association of region-wide significance between rs2548861 and low HDL-C for the dominant model and the same risk allele consistently throughout our family-based and case-control study samples (n = 3,070).
We performed subset linkage analyses as previously described33 to examine whether the SNP rs2548861 explains the linkage at 16q23-q24 for low HDL-C.4 We used the viewstat -e option of FBAT to divide the 62 FCHL and low-HDL-C families of the original linkage study4 into associated and unassociated families based on whether the family contributed positively to the Z-score statistic of FBAT. For rs2548861, the 20 associated, the 42 unassociated, and all 62 families produced LOD scores of 2.6, 0.7, and 3.9, respectively, at the peak location (D16S518–D16S3096) (Figure S1), suggesting that rs2548861 explains much of the linkage. The WWOX gene is located directly under the linkage peak (Figure S1). However, a shoulder of the linkage signal (105–110 cM) remains unexplained by rs2548861 (Figure S1), suggesting that additional variants in the 16q23–q24 region might confer susceptibility for low-HDL-C levels.
Investigation of a Population Effect of rs2548861 in the METSIM and Young Finns Cohorts
To extend our investigation to nondyslipidemic and unascertained population study samples, we examined the rs2548861 SNP in two independent population-based cohorts for association with HDL-C levels. The dominant genetic model resulted in the most significant association in the stage 1 and 2 dyslipidemic study samples. In both the METSIM and Young Finns cohorts, the carriers of the T allele also had lower HDL-C levels than the GG genotype carriers (Table 2), further supporting the dominant model. Therefore, we compared the mean of the standardized HDL-C levels adjusted for BMI between the nonrisk GG carriers against the T risk allele carriers (TX, i.e., genotypes TT and TG) by an independent t test.
Table 2.
Association of rs2548861 in the METSIM and Young Finns Population-Based Cohorts
| Study Sample | N | Allele Frequency | HDL-C (mg/dl)c |
Pd | Effect size (SEM)e | ||
|---|---|---|---|---|---|---|---|
| GG | GT | TT | |||||
| METSIM Cross-Sectional Cohort of Finnish Males | |||||||
| ALL | 4,447 | 57.3 ± 0.43 | 56.3 ± 0.30 | 56.2 ± 0.42 | 0.03 | −0.08 (0.03) | |
| DM and CAD exclusiona | 3,727 | 0.49 | 58.5 ± 0.47 | 57.0 ± 0.33 | 57.2 ± 0.46 | 0.009 | −0.10 (0.04) |
| DM, CAD and BMI exclusiona,b | 3,403 | 59.4 ± 0.49 | 57.6 ± 0.35 | 57.9 ± 0.48 | 0.003 | −0.12 (0.04) | |
| Young Finns Study: Prospective Cohort of Young Finnish Subjects | |||||||
| 1980–2001 mean | 59.5 ± 0.48 | 58.2 ± 0.34 | 57.9 ± 0.48 | 0.004 | −0.14 (0.05) | ||
| 1980 | 62.0 ± 0.59 | 60.0 ± 0.42 | 60.0 ± 0.60 | 0.002 | −0.18 (0.06) | ||
| 1983 | 1,561 | 0.50 | 65.8 ± 0.65 | 64.9 ± 0.46 | 64.3 ± 0.65 | 0.08 | −0.10 (0.06) |
| 1986 | 59.8 ± 0.55 | 58.6 ± 0.39 | 57.7 ± 0.55 | 0.01 | −0.15 (0.06) | ||
| 2001 | 50.6 ± 0.54 | 49.2 ± 0.38 | 49.5 ± 0.55 | 0.04 | −0.12 (0.06) | ||
Exclusion of subjects receiving government-subsidized medication for the treatment of diabetes and CAD from the analysis.
Exclusion of subjects with BMI greater than the age- and sex-specific Finnish 90th percentiles.
Values shown are the estimated marginal mean ± SEM of HDL-C after adjustment for age, BMI, and sex, when applicable.
p values were obtained by independent t tests between the GG genotype and TX genotype carriers (i.e., TT and TG genotypes) by the use of standardized HDL-C residuals (mean = 0 and SD = 1) that were corrected for age, BMI, and sex, when applicable (see Material and Methods).
The effect size represents the proportion of 1 SD change in standardized HDL-C residual values for the presence of the T risk allele.
The METSIM cohort consists of Finnish males between 50 and 70 years of age. We observed a significant association between the rs2548861 genotype and HDL-C levels in the total study sample; lower HDL-C levels were observed in the TX genotype carriers (p = 0.03, n = 4,447) (Table 2). The effect size as calculated directly based on the t statistic was −0.08 (SEM = 0.03) which corresponds to −0.08 of the standard deviation in standardized HDL-C residual for a carrier of the T risk allele. Exclusion of subjects receiving government-subsidized medication for the treatment of diabetes or coronary heart disease (i.e., lipid-lowering drugs), which are known to alter serum HDL-C levels, improved the association (p = 0.009, n = 3,727) and increased the effect size (−0.10, SEM = 0.04) (Table 2). Furthermore, exclusion of obese subjects with age- and sex-specific BMI greater than the Finnish population 90th percentile provided additional significance to the association (p = 0.003, n = 3,403) and further increased the effect size (−0.12, SEM = 0.04) (Table 2).
The Young Finns study sample is a population-based prospective cohort of young Finns who were aged 3–18 years at the time of enrollment in the study in 1980 and were followed for 21 years. Adjusting for sex and measurement-specific age and BMI , we analyzed the mean of the four HDL-C measurements obtained between 1980 and 2001 for the dominant model of inheritance. We excluded from the analysis subjects receiving treatment for diabetes (n = 8) and lipid-lowering drugs (n = 3). We observed a significant association between rs2548861 and the mean of the four HDL-C measurements; lower HDL-C levels were observed in the TX genotype carriers (p = 0.004, n = 1,561), and there was an effect size of −0.14 (SEM = 0.05). The TX genotype explains 1.5% of the variance in HDL-C levels in these subjects, representative of the unascertained population of both sexes and a broad age range. To fully utilize the prospective feature of the phenotypic data, we examined the longitudinal effect of rs2548861 on HDL-C levels by RANOVA and found a significant association between the dominant model of rs2548861 and the variance of HDL-C levels observed in four repeated measurements obtained over a span of 21 years (p = 0.003) (Figure 2).
Figure 2.

A Profile Plot of the General Linear Model Showing the Longitudinal Effect of rs2548861 on HDL-C Levels in the Young Finns Cohort
The circles represent the estimated marginal means of the standardized HDL-C residual values of measurements obtained in the corresponding year for the GG genotype carriers and the squares represent the TX carriers. TX indicates carriers of the T risk allele, i.e., genotypes TT and TG. The p value was obtained by RANOVA analysis for the standardized HDL-C residuals corrected for age, sex, and BMI.
We performed a combined analysis of the METSIM and Young Finns cohorts by using a combined statistic weighted by the proportion of the cohorts and using similar exclusion criteria aimed at eliminating users of diabetes and lipid-lowering drugs. In the combined statistic of 5,288 subjects, we obtained a p value of 0.0004 for the association between rs2548861 and HDL-C. Exclusion of obese subjects with age- and sex-specific BMI greater than the population 90th percentile from both cohorts increased the significance to p = 1.95 × 10⁻⁵ (n = 4,828).
Resequencing of the WWOX Gene
We resequenced the exons and exon-intron boundaries of WWOX in 16 probands of the Finnish dyslipidemic families that provided evidence of microsatellite linkage to 16q23-q24 and evidence of association with the rs2548861 SNP. We identified one nonsynonymous SNP, rs12918952 in exon 6 of isoform 1; this SNP has a minor allele frequency (MAF) of 0.44 and results in Ala179Val substitution (Table S2). This SNP was tagged by rs4888786 (r2 = 0.88, D′ = 0.96), which was analyzed in our stage 1 Finnish dyslipidemic families and was not significantly associated with the low-HDL-C trait (p = 0.63). In addition, we identified one rare synonymous variant, ss104806834 in exon 7 (MAF = 0.03), as well as twelve intronic SNPs and seven SNPs in the 3′ UTR (Table S2). None of the variants identified by sequencing are in LD with the associated rs2548861 (r2 ≤ 0.1, D′ ≤ 0.26) and, therefore, cannot account for the association observed in our genetic analysis.
Functional Analysis of rs2548861
The extent of LD across the WWOX gene in the 50 probands of the stage 1 Finnish dyslipidemic families and association results for the WWOX SNPs in the two stages are shown in Figure S2A. The LD (r2 > 0.5, D′ > 0.7) extends to tag SNPs immediately surrounding the rs2548861 SNP (Figure S2A). However, because the association evidence obtained with our two-stage design was most significant for rs2548861, we prioritized this particular HDL-C-associated variant for our functional investigation. The rs2548861 is a tag SNP that captures two additional SNPs, rs2738577 and rs2550606, with r2 of 0.93 (D′ = 1.0) and 0.96 (D′ = 1.0), respectively, in the European-descended CEU subjects of the HapMap project. All three SNPs are located in the large intron 8 of WWOX. We focused our functional analysis on rs2548861 because it is located within a 235 bp predicted conserved element by the phastCons program36 on the basis of whole-genome alignments of vertebrates (LOD = 734 out of a possible 1,000), as well as the placental-mammal subset of species (LOD = 431) (UCSC Genome Browser). Additionally, 211 bp of the same region was computationally predicted to function as a cis-regulatory element because of the significant conservation observed for the human-mouse-chicken and human-mouse-frog alignments (p < 0.001), as well as the absence of overlap with exons of any known genes, mRNA, or spliced expressed sequence tags (VISTA Enhancer Browser)37 (Figure S2B).
We resequenced a 525 bp region surrounding the predicted regulatory element in 48 Finnish dyslipidemic and 24 Dutch FCHL probands. We identified an additional common variant, rs2738572 (MAF = 0.35 and r2 = 0.49 [D′ = 0.86] with rs2548861). The variant rs2738572 is located 162 bp centromeric to rs2548861 and 70 bp outside of the predicted regulatory element, but still within a region of high conservation. We followed up on this SNP in the stage 1 Finnish dyslipidemic families and observed no evidence of single-SNP- or haplotype-based association with rs2548861 for the HDL-C trait (p > 0.1). In summary, rs2548861 is the only common variant within the 211 bp predicted cis-regulatory element and within the larger 526 bp conserved region to be associated with the low-HDL-C trait.
We performed a luciferase reporter assay to test the function of this conserved, predicted regulatory element. We cloned a 691 bp region that includes the rs2548861 SNP and the predicted cis-regulatory region into the pGL-3 promoter vector downstream of the luciferase reporter gene. We tested the three common regional haplotypes of rs2738572–rs2548861 (H1–H3) with frequency > 0.05 in the forward and reverse orientation in the HepG2 cell line. H1 represents a haplotype of C-G alleles, H2 of A-T, and H3 of C-T for the SNPs rs2738572–rs2548861, respectively. The haplotypes H2 and H3 contain the T risk allele of rs2548861, and the haplotype H1 has the non-risk G allele. We used HepG2 cells for these experiments, because the liver is a highly relevant tissue involved in HDL metabolism. We used RT-PCR to verify the expression of WWOX in HepG2 cells (data not shown), as well as in normal liver cells (Figure S3). We assayed for luciferase activity 48 hr after transfection and observed a significant reduction in the reporter activity for the H1, H2, and H3 haplotype constructs in the reverse orientation when these were compared to the empty vector, suggesting that this region functions as a cis-regulatory element (p = 0.008, 0.003, 0.002, respectively) (Figure 3A). We also observed a highly significant allelic effect of rs2548861 on the reporter activity: Haplotypes H2 and H3 carrying the T risk allele of rs2548861 had significantly lower luciferase activity than the H1 haplotype with the nonrisk G allele (p = 0.0004, 5.3 × 10⁻⁶, respectively) (Figure 3A). This significant effect was observed in three independent experiments. Consistent with our association results for the rs2738572–rs2548861 haplotype, we did not observe any differences in the reporter activity between the H2 and H3 haplotypes that have the T risk allele of rs2548861 versus either the A or C allele of rs2738572 (p = 0.3) (Figure 3A). Therefore, the 691 bp region surrounding the rs2548861 SNP functions as a cis-regulatory element in vitro, and rs2548861 has a significant allelic effect on this regulatory function.
Figure 3.
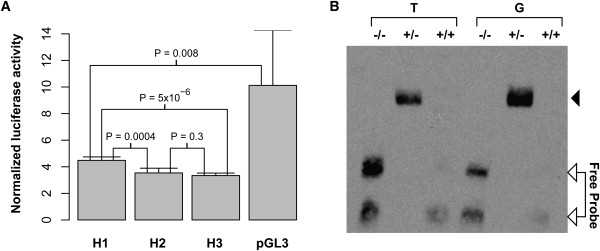
Evidence of rs2548861 Allele-Specific Cis-Regulatory Function
(A) A luciferase reporter assay demonstrates a cis-regulatory function for the 691 bp region surrounding rs2548861, and a significant allelic effect is observed. H1–H3 represent the common haplotypes of the SNPs rs2738572 and rs2548861 with frequency greater than 0.05 that were identified in the region by resequencing. The H1 haplotype is composed of the C-G alleles, H2 of A-T, and H3 of C-T for the rs2738572–rs2548861 haplotypes, respectively. The haplotypes H2 and H3 contain the T risk allele of rs2548861, and the haplotype H1 has the nonrisk G allele. Error bars represent the SD.
(B) A comparative EMSA demonstrates the formation of a DNA-nuclear-factor complex in the 25 bp sequence surrounding the rs2548861 SNP with preferential nuclear-factor binding for the G allele. The lanes T and G indicate the allele of rs2548861 contained in the 25 bp biotin-labeled probe. The position of the unbound probe is indicated. An arrowhead indicates the position of the DNA-nuclear factor complex; −/−, the negative control; +/−, the addition of nuclear extract; and +/+, the addition of nuclear extract and a 200-fold excess of unlabeled competitor probe in the binding reactions, respectively.
We also examined the 25 bp region surrounding the SNP rs2548861 by comparative EMSA by using HepG2 cell nuclear extract that had been used in the reporter assay. We observed the presence of a DNA-nuclear-factor complex with both the G and T alleles (Figure 3B). However, binding of the nuclear factor appeared to be preferential for the nonrisk G allele in three independent experiments (Figure 3B). To further assess the difference in binding affinity between the G and T alleles in a more quantitative manner, we performed a competition EMSA experiment by using unlabeled allele-specific competitor that was titrated in 25-, 50-, and 100-fold molar excess of the biotin-labeled probe. These data show that the unlabeled allele-specific competitor disrupts the shift of the T-allele probe at a lower molar excess than the G-allele probe (Figure S4A). The DNA-nuclear-factor complex also appears to be specific given that a 200-fold molar excess of the nonspecific competitor did not compete for binding as effectively as the specific competitor (Figure S4B). The EMSA data are representative of at least three independent experiments. Thus, the sequence immediately surrounding rs2548861 binds nuclear factors in an allele-specific manner, providing additional evidence that the rs2548861 SNP might influence the putative cis-regulatory function of the surrounding region.
Lastly, we performed expression analysis of the WWOX transcript by using cDNA obtained from a panel of human tissues by RT-PCR. These data show normal expression of WWOX in the liver and other tissues relevant for HDL metabolism, including the adipose, pancreas, and skeletal muscle (Figure S3).
Comparison with the GWAS Results for HDL-C Levels
Recently, the GWAS data of the Diabetes Genetics Initiative (DGI), the FUSION study of type 2 diabetes, and the SardiNIA study of aging-associated variables cohorts were analyzed for lipid traits, including HDL-C.11,12 We examined these publicly available GWAS results for association evidence for HDL-C in the 12.4 Mb linked region on 16q23–q24. We observed that rs2548861 SNP or SNPs in LD were not significant in these GWAS studies predominantly ascertained for T2DM.12 However, a WWOX SNP, rs2667590, located in the same intron as our associated SNP rs2548861, was the most significantly associated SNP in the 12.4 Mb region (p = 2.3 × 10⁻⁵), and it ranked 344th among 2,559,602 SNPs tested for HDL-C in the entire GWAS study, which was mostly based on T2DM cases and controls.12 There is no LD between rs2667590 and rs2548861 in the CEU subjects of the HapMap Project (r2 < 0.02). This SNP rs2667590 (MAF = 0.03) represents a cluster of SNPs in tight LD, and none of these SNPs were included in our study because our tagging strategy focused on SNPs with a MAF > 0.10.
Discussion
In the current study, we observed a region-wide significant association between HDL-C and a WWOX variant that has an allele-specific cis-regulatory function. We performed targeted genotyping of a region of linkage on chromosome 16q23–q24 by utilizing a two-stage association analysis of regional tag SNPs. We identified an association of region-wide significance between rs2548861 within WWOX and low HDL-C in dyslipidemic families and case-control subjects. Furthermore, we observed a significant population effect of this SNP rs2548861 on the HDL-C levels in a cross-sectional cohort of Finnish males of age 50–70 years (METSIM cohort), as well as a longitudinal effect on the HDL-C levels in the prospective Young Finns cohort, whose subjects were followed for 21 years. Overall, our genetic analysis showed significant associations between HDL-C levels and rs2548861 for the same risk allele and dominant model in a total of 9,798 subjects analyzed for this variant. The multiple lines of evidence obtained from a diverse array of study samples, ranging from ascertained dyslipidemic families and case-control subjects to population-based cross-sectional and prospective cohorts, further substantiates a role of rs2548861 in determining serum HDL-C levels.
We observed that a copy of the T allele of rs2548861 increased the probability of having low HDL-C by 17% in the low-HDL-C case-control study sample. In the unascertained Young Finns population cohort, one copy of the T allele explains 1.5% of the variance in HDL-C levels. Because numerous genetic and environmental factors contribute to the expression of serum HDL-C levels, the effect of the rs2548861 susceptibility allele is likely to be more pronounced in comparisons of low-HDL-C individuals carrying additional risk factors with healthy controls. Our data suggest that this SNP rs2548861 alone is not a major HDL-C determinant but rather that it is a modifier variant that influences serum HDL-C levels, in line with rapidly accumulating evidence that numerous common variants each with a minor to modest effect size contribute to the expression of a complex trait.11,12,38–41 Although the association with rs2548861 explains much of the original linkage evidence, a shoulder of linkage signal remains unexplained by rs2548861. Therefore, it is possible that other genes residing in the 16q23–q24 region also contribute to the linkage results observed for HDL-C in different study samples. Clarifying the overall role of WWOX on HDL-C levels warrants extensive resequencing in larger study samples of low-HDL-C cases and controls so that rare variants of large effect on HDL-C levels can be identified. The effect sizes observed in our population-based study samples (−0.08 to −0.18) are in the same range as the effect sizes (−0.07 to −0.18) observed for HDL-C-associated variants in the recent GWASs predominantly ascertained for T2DM.11,12 It is worth noting that our study estimated the effect at the population level, whereas the estimated effects of the GWASs11,12 do not reflect the general population and cannot be directly extended to unascertained populations.
The SNP rs2667590 resulted in a p value of 2.3 × 10⁻⁵ for HDL-C in the meta-analysis of the GWAS on the basis of T2DM cases and controls.12 Importantly, this SNP was the most significantly associated SNP in the GWAS12 for the 12.4 Mb region that we analyzed in the present study. However, rs2548861 was not significantly associated with HDL-C levels in this GWAS for lipid traits when an additive model was used.11,12 It is possible that different variants of the same gene influence HDL-C levels in subjects with T2DM and dyslipidemia. We observed that 49% of the DGI and 40% of the FUSION subjects of the GWAS stage 1 had T2DM12 but that 7% of subjects had T2DM in our stage 1 dyslipidemic families. Furthermore, our association with rs2548861 was consistently observed with the dominant model throughout the 9,798 study samples, whereas the additive model was used for analyzing this SNP in the GWASs.12 Moreover, in our analysis of the two population-based METSIM and Young Finns cohorts, exclusion of individuals with diabetes and/or high BMI improved our association signal, suggesting that the presence of diabetes or the highly related obesity trait might confound the association with rs2548861. However, the presence of two independently associated variants located in the same intron 8 of the WWOX gene for HDL-C levels in our study and the GWAS of the predominantly T2DM-based study sample analyzed for lipids12 is particularly noteworthy because it provides independent, yet complementary, support of a role of the WWOX gene in HDL-C metabolism.
Previously, in vivo enhancer analysis of human conserved noncoding sequences in transgenic mice identified a functional enhancer element also located in intron 8 of WWOX.42 Moreover, cell lines derived from the gastric adenocarcinoma AGS exhibit three distinct regions of homozygous deletions in intron 8 of WWOX.43 Our functional data obtained from the reporter assay and EMSA implicate a cis-regulatory function of the intron 8 conserved region where rs2548861 resides. The cis-regulatory function and the allelic effects warrant further investigation because these artificial in vitro systems do not necessarily reflect the normal physiological state. However, the statistically significant reporter assay results and the EMSA experiments are intriguing first lines of evidence that implicate a functional variant within a functional cis-regulatory element that influences serum HDL-C levels.
The WWOX gene encodes a 46 kDa protein that contains two WW domains and a short-chain oxidoreductase (SDR) domain.44 WWOX regulates transcription by binding to the proline-rich ligand of its targeted transcription factors via the WW domain in the cytoplasm and preventing translocation into the nucleus. The SDR domain suggests a role in steroid metabolism, as evidenced by upregulation of in vitro expression of WWOX by sex steroids, as well as the observation of impaired in vivo steroidogenesis in the Wwox knockout mice.45 The highest normal expression of WWOX has been observed in hormonally regulated tissues, including testis, ovaries, and prostate.46,47 Much of the previous literature implicates WWOX in cancer biology.45 WWOX is located within the second-most-active common fragile site, FRA16D, and deletions or translocations of WWOX have been observed in many cancer types.48 Recently, Wwox was shown to function as a tumor suppressor in mice heterozygous for a targeted deletion of Wwox.47 In that study, the authors suggested that the homozygous knockout mice that die by 4 weeks of age might suffer from a severe metabolic defect: They observed dramatic changes in the serum levels of lipids, carbohydrates, and proteins in these mice and, although they performed a thorough histological survey of the major organs, they could not identify any lesions that could have accounted for the premature death.47 However, the underlying mechanism(s) by which WWOX influences HDL-C levels is currently unknown, and further studies are warranted to elucidate these molecular mechanisms.
In conclusion, we have identified, within the WWOX gene on chromosome 16q23–q24, a variant that is significantly associated with HDL-C levels in dyslipidemic families and low-HDL-C cases and controls, as well as in population-based cross-sectional and prospective cohorts. We also demonstrate that the variant, rs2548861, appears to reside in a functional cis-regulatory element that forms a DNA-nuclear factor complex and that there is a significant allelic effect of rs2548861 on the regulatory function. Taken together, these genetic and functional data identify an HDL-C-associated WWOX variant with an allele-specific cis-regulatory function.
Supplemental Data
Four figures and two tables are available with this article online at http://www.ajhg.org/.
Supplemental Data
Web Resources
The URLs for data presented herein are as follows:
Online Mendelian Inheritance in Man (OMIM), http://www.ncbi.nlm.nih.gov/Omim
Primer3, http://frodo.wi.mit.edu/
Mendel v8.0.1, http://www.genetics.ucla.edu/software/
UCSC Genome Browser (PhastCons), http://www.genome.ucsc.edu/
VISATA Enhancer Browser, http://enhancer.lbl.gov/frnt_page.shtml
Acknowledgments
We thank the patients and family members for their participation in this study. We thank L. Peltonen, K. Porkka, and I. Nuotio for sample collection; E. Nikkola, M. Lupsakko, L. Riba, and I. Ruel for laboratory technical assistance; and N. Zanesi and T. Palumbo for their contribution. This research was supported by National Institutes of Health grants HL-28481 and HL082762, the AHA grant 0430180N, the Kimmel Scholar Award, The Fondation Leducq, California Discovery Grant 02-10251, and the Dhanem Foundation. D.W.-V. is supported by National Human Genome Research Institute grant T32 HG02536; M.K. by a grant from the Academy of Finland; A.H.-V. by the American Hearth Association grant 072523Y; B.E.A by the American Hearth Association grant 0465005Y; abd R.I.A by Ohio Cancer Research Associates. M.-R.T. is supported by the Clinical Research Institute, Helsinki University Central Hospital and the Finnish Heart Foundation, and T.L. is supported by the Tampere University Hospital Medical Fund. The Young Finns Study is supported by the Academy of Finland grants 77841 and 210283. J.G, M.M., and J.C.E are supported by grant CIHR MOP 62834 from the Canadian Institutes of Health Research; J.G. holds the McGill University-Novartis Chair in Medicine; M.M. and J.C.E. are recipients of a Fonds de la recherche en santé du Québec (FRSQ) research scholarship. The authors have no competing financial interests to disclose. T.W.A.d.B. has been employed by GlaxoSmithKline. GlaxoSmithKline did not provide any financial support for this study.
References
- 1.Genest J.J., Martin-Munley S.S., McNamara J.R., Ordovas J.M., Jenner J., Myers R.H., Silberman S.R., Wilson P.W., Salem D.N., Schaefer E.J. Familial lipoprotein disorders in patients with premature coronary artery disease. Circulation. 1992;85:2025–2033. doi: 10.1161/01.cir.85.6.2025. [DOI] [PubMed] [Google Scholar]
- 2.Friedlander Y., Kark J.D., Stein Y. Heterogeneity in multifactorial inheritance of plasma lipids and lipoproteins in ethnically diverse families in Jerusalem. Genet. Epidemiol. 1986;3:95–112. doi: 10.1002/gepi.1370030205. [DOI] [PubMed] [Google Scholar]
- 3.Heller D.A., de Faire U., Pedersen N.L., Dahlen G., McClearn G.E. Genetic and environmental influences on serum lipid levels in twins. N. Engl. J. Med. 1993;328:1150–1156. doi: 10.1056/NEJM199304223281603. [DOI] [PubMed] [Google Scholar]
- 4.Pajukanta P., Allayee H., Krass K.L., Kuraishy A., Soro A., Lilja H.E., Mar R., Taskinen M.R., Nuotio I., Laakso M. Combined analysis of genome scans of Dutch and Finnish families reveals a susceptibility locus for high-density lipoprotein cholesterol on chromosome 16q. Am. J. Hum. Genet. 2003;72:903–917. doi: 10.1086/374177. [DOI] [PMC free article] [PubMed] [Google Scholar]
- 5.Soro A., Pajukanta P., Lilja H.E., Ylitalo K., Hiekkalinna T., Perola M., Cantor R.M., Viikari J.S., Taskinen M.R., Peltonen L. Genome scans provide evidence for low-HDL-C loci on chromosomes 8q23, 16q24.1–24.2, and 20q13.11 in Finnish families. Am. J. Hum. Genet. 2002;70:1333–1340. doi: 10.1086/339988. [DOI] [PMC free article] [PubMed] [Google Scholar]
- 6.Mahaney M.C., Almasy L., Rainwater D.L., VandeBerg J.L., Cole S.A., Hixson J.E., Blangero J., MacCluer J.W. A quantitative trait locus on chromosome 16q influences variation in plasma HDL-C levels in Mexican Americans. Arterioscler. Thromb. Vasc. Biol. 2003;23:339–345. doi: 10.1161/01.atv.0000051406.14162.6a. [DOI] [PubMed] [Google Scholar]
- 7.Shearman A.M., Ordovas J.M., Cupples L.A., Schaefer E.J., Harmon M.D., Shao Y., Keen J.D., DeStefano A.L., Joost O., Wilson P.W. Evidence for a gene influencing the TG/HDL-C ratio on chromosome 7q32.3-qter: A genome-wide scan in the Framingham study. Hum. Mol. Genet. 2000;9:1315–1320. doi: 10.1093/hmg/9.9.1315. [DOI] [PubMed] [Google Scholar]
- 8.Dastani Z., Quiogue L., Plaisier C., Engert J.C., Marcil M., Genest J., Pajukanta P. Evidence for a gene influencing high-density lipoprotein cholesterol on chromosome 4q31.21. Arterioscler. Thromb. Vasc. Biol. 2006;26:392–397. doi: 10.1161/01.ATV.0000198243.83781.a3. [DOI] [PubMed] [Google Scholar]
- 9.Assmann G., Gotto A.M. HDL cholesterol and protective factors in atherosclerosis. Circulation. 2004;109:III8–III14. doi: 10.1161/01.CIR.0000131512.50667.46. [DOI] [PubMed] [Google Scholar]
- 10.Miller M., Rhyne J., Hamlette S., Birnbaum J., Rodriguez A. Genetics of HDL regulation in humans. Curr. Opin. Lipidol. 2003;14:273–279. doi: 10.1097/00041433-200306000-00007. [DOI] [PubMed] [Google Scholar]
- 11.Kathiresan S., Melander O., Guiducci C., Surti A., Burtt N.P., Rieder M.J., Cooper G.M., Roos C., Voight B.F., Havulinna A.S. Six new loci associated with blood low-density lipoprotein cholesterol, high-density lipoprotein cholesterol or triglycerides in humans. Nat. Genet. 2008;40:189–197. doi: 10.1038/ng.75. [DOI] [PMC free article] [PubMed] [Google Scholar]
- 12.Willer C.J., Sanna S., Jackson A.U., Scuteri A., Bonnycastle L.L., Clarke R., Heath S.C., Timpson N.J., Najjar S.S., Stringham H.M. Newly identified loci that influence lipid concentrations and risk of coronary artery disease. Nat. Genet. 2008;40:161–169. doi: 10.1038/ng.76. [DOI] [PMC free article] [PubMed] [Google Scholar]
- 13.Cantor R.M., de Bruin T., Kono N., Napier S., van Nas A., Allayee H., Lusis A.J. Quantitative trait loci for apolipoprotein B, cholesterol, and triglycerides in familial combined hyperlipidemia pedigrees. Arterioscler. Thromb. Vasc. Biol. 2004;24:1935–1941. doi: 10.1161/01.ATV.0000142358.46276.a7. [DOI] [PubMed] [Google Scholar]
- 14.Weber M., McNicoll S., Marcil M., Connelly P., Lussier-Cacan S., Davignon J., Latour Y., Genest J. Metabolic factors clustering, lipoprotein cholesterol, apolipoprotein B, lipoprotein (a) and apolipoprotein E phenotypes in premature coronary artery disease in French Canadians. Can. J. Cardiol. 1997;13:253–260. [PubMed] [Google Scholar]
- 15.Aouizerat B.E., Engler M.B., Natanzon Y., Kulkarni M., Song J., Eng C., Huuskonen J., Rivera C., Poon A., Bensley M. Genetic variation of PLTP modulates lipoprotein profiles in hypoalphalipoproteinemia. J. Lipid Res. 2006;47:787–793. doi: 10.1194/jlr.M500476-JLR200. [DOI] [PubMed] [Google Scholar]
- 16.The Lipid Research Clinics Program Epidemiology Committee Plasma lipid distributions in selected North American populations: The Lipid Research Clinics Program Prevalence Study. Circulation. 1979;60:427–439. doi: 10.1161/01.cir.60.2.427. [DOI] [PubMed] [Google Scholar]
- 17.Huertas-Vazquez A., Plaisier C., Weissglas-Volkov D., Sinsheimer J., Canizales-Quinteros S., Cruz-Bautista I., Nikkola E., Herrera-Hernandez M., Davila-Cervantes A., Tusie-Luna T. TCF7L2 is associated with high serum triacylglycerol and differentially expressed in adipose tissue in families with familial combined hyperlipidaemia. Diabetologia. 2008;51:62–69. doi: 10.1007/s00125-007-0850-6. [DOI] [PubMed] [Google Scholar]
- 18.Aguilar-Salinas C.A., Rojas R., Gomez-Perez F.J., Garcia E., Valles V., Rios-Torres J.M., Franco A., Olaiz G., Sepulveda J., Rull J.A. Prevalence and characteristics of early-onset type 2 diabetes in Mexico. Am. J. Med. 2002;113:569–574. doi: 10.1016/s0002-9343(02)01314-1. [DOI] [PubMed] [Google Scholar]
- 19.Lange C., DeMeo D., Silverman E.K., Weiss S.T., Laird N.M. PBAT: Tools for family-based association studies. Am. J. Hum. Genet. 2004;74:367–369. doi: 10.1086/381563. [DOI] [PMC free article] [PubMed] [Google Scholar]
- 20.Zeggini E., Scott L.J., Saxena R., Voight B.F., Marchini J.L., Hu T., de Bakker P.I., Abecasis G.R., Almgren P., Andersen G. Meta-analysis of genome-wide association data and large-scale replication identifies additional susceptibility loci for type 2 diabetes. Nat. Genet. 2008;40:638–645. doi: 10.1038/ng.120. [DOI] [PMC free article] [PubMed] [Google Scholar]
- 21.Raitakari O.T., Juonala M., Ronnemaa T., Keltikangas-Jarvinen L., Rasanen L., Pietikainen M., Hutri-Kahonen N., Taittonen L., Jokinen E., Marniemi J. Cohort Profile: The Cardiovascular Risk in Young Finns Study. Int. J. Epidemiol. 2008 doi: 10.1093/ije/dym225. in press. Published online February 8, 2008. [DOI] [PubMed] [Google Scholar]
- 22.The International HapMap Consortium A haplotype map of the human genome. Nature. 2005;437:1299–1320. doi: 10.1038/nature04226. [DOI] [PMC free article] [PubMed] [Google Scholar]
- 23.Carlson C.S., Eberle M.A., Rieder M.J., Yi Q., Kruglyak L., Nickerson D.A. Selecting a maximally informative set of single-nucleotide polymorphisms for association analyses using linkage disequilibrium. Am. J. Hum. Genet. 2004;74:106–120. doi: 10.1086/381000. [DOI] [PMC free article] [PubMed] [Google Scholar]
- 24.O'Connell J.R., Weeks D.E. PedCheck: A program for identification of genotype incompatibilities in linkage analysis. Am. J. Hum. Genet. 1998;63:259–266. doi: 10.1086/301904. [DOI] [PMC free article] [PubMed] [Google Scholar]
- 25.Rozen S., Skaletsky H. Primer3 on the WWW for general users and for biologist programmers. Methods Mol. Biol. 2000;132:365–386. doi: 10.1385/1-59259-192-2:365. [DOI] [PubMed] [Google Scholar]
- 26.Lake S.L., Blacker D., Laird N.M. Family-based tests of association in the presence of linkage. Am. J. Hum. Genet. 2000;67:1515–1525. doi: 10.1086/316895. [DOI] [PMC free article] [PubMed] [Google Scholar]
- 27.Horvath S., Laird N.M. A discordant-sibship test for disequilibrium and linkage: No need for parental data. Am. J. Hum. Genet. 1998;63:1886–1897. doi: 10.1086/302137. [DOI] [PMC free article] [PubMed] [Google Scholar]
- 28.Knapp M. A note on power approximations for the transmission/disequilibrium test. Am. J. Hum. Genet. 1999;64:1177–1185. doi: 10.1086/302334. [DOI] [PMC free article] [PubMed] [Google Scholar]
- 29.Tu I.P., Balise R.R., Whittemore A.S. Detection of disease genes by use of family data. II. Application to nuclear families. Am. J. Hum. Genet. 2000;66:1341–1350. doi: 10.1086/302852. [DOI] [PMC free article] [PubMed] [Google Scholar]
- 30.Purcell S., Neale B., Todd-Brown K., Thomas L., Ferreira M.A., Bender D., Maller J., Sklar P., de Bakker P.I., Daly M.J. PLINK: a tool set for whole-genome association and population-based linkage analyses. Am. J. Hum. Genet. 2007;81:559–575. doi: 10.1086/519795. [DOI] [PMC free article] [PubMed] [Google Scholar]
- 31.Skol A.D., Scott L.J., Abecasis G.R., Boehnke M. Joint analysis is more efficient than replication-based analysis for two-stage genome-wide association studies. Nat. Genet. 2006;38:209–213. doi: 10.1038/ng1706. [DOI] [PubMed] [Google Scholar]
- 32.Lange K., Cantor R., Horvath S., Perola M., Sabatti C., Sinsheimer J., Sobel E. Mendel version 4.0: A complete package for the exact genetic analysis of discrete traits in pedigree and population data sets. Am. J. Hum. Gen. 2001;69(Suppl):A1886. [Google Scholar]
- 33.Weissglas-Volkov D., Huertas-Vazquez A., Suviolahti E., Lee J., Plaisier C., Canizales-Quinteros S., Tusie-Luna T., Aguilar-Salinas C., Taskinen M.R., Pajukanta P. Common hepatic nuclear factor-4alpha variants are associated with high serum lipid levels and the metabolic syndrome. Diabetes. 2006;55:1970–1977. doi: 10.2337/db06-0035. [DOI] [PubMed] [Google Scholar]
- 34.Sobel E., Lange K. Descent graphs in pedigree analysis: Applications to haplotyping, location scores, and marker-sharing statistics. Am. J. Hum. Genet. 1996;58:1323–1337. [PMC free article] [PubMed] [Google Scholar]
- 35.Vartiainen E., Puska P., Jousilahti P., Korhonen H.J., Tuomilehto J., Nissinen A. Twenty-year trends in coronary risk factors in north Karelia and in other areas of Finland. Int. J. Epidemiol. 1994;23:495–504. doi: 10.1093/ije/23.3.495. [DOI] [PubMed] [Google Scholar]
- 36.Siepel A., Bejerano G., Pedersen J.S., Hinrichs A.S., Hou M., Rosenbloom K., Clawson H., Spieth J., Hillier L.W., Richards S. Evolutionarily conserved elements in vertebrate, insect, worm, and yeast genomes. Genome Res. 2005;15:1034–1050. doi: 10.1101/gr.3715005. [DOI] [PMC free article] [PubMed] [Google Scholar]
- 37.Prabhakar S., Poulin F., Shoukry M., Afzal V., Rubin E.M., Couronne O., Pennacchio L.A. Close sequence comparisons are sufficient to identify human cis-regulatory elements. Genome Res. 2006;16:855–863. doi: 10.1101/gr.4717506. [DOI] [PMC free article] [PubMed] [Google Scholar]
- 38.Scott L.J., Mohlke K.L., Bonnycastle L.L., Willer C.J., Li Y., Duren W.L., Erdos M.R., Stringham H.M., Chines P.S., Jackson A.U. A genome-wide association study of type 2 diabetes in Finns detects multiple susceptibility variants. Science. 2007;316:1341–1345. doi: 10.1126/science.1142382. [DOI] [PMC free article] [PubMed] [Google Scholar]
- 39.Zeggini E., Weedon M.N., Lindgren C.M., Frayling T.M., Elliott K.S., Lango H., Timpson N.J., Perry J.R., Rayner N.W., Freathy R.M. Replication of genome-wide association signals in UK samples reveals risk loci for type 2 diabetes. Science. 2007;316:1336–1341. doi: 10.1126/science.1142364. [DOI] [PMC free article] [PubMed] [Google Scholar]
- 40.Kooner J.S., Chambers J.C., Aguilar-Salinas C.A., Hinds D.A., Hyde C.L., Warnes G.R., Gomez Perez F.J., Frazer K.A., Elliott P., Scott J. Genome-wide scan identifies variation in MLXIPL associated with plasma triglycerides. Nat. Genet. 2008;40:149–151. doi: 10.1038/ng.2007.61. [DOI] [PubMed] [Google Scholar]
- 41.Saxena R., Voight B.F., Lyssenko V., Burtt N.P., de Bakker P.I., Chen H., Roix J.J., Kathiresan S., Hirschhorn J.N., Daly M.J. Genome-wide association analysis identifies loci for type 2 diabetes and triglyceride levels. Science. 2007;316:1331–1336. doi: 10.1126/science.1142358. [DOI] [PubMed] [Google Scholar]
- 42.Pennacchio L.A., Ahituv N., Moses A.M., Prabhakar S., Nobrega M.A., Shoukry M., Minovitsky S., Dubchak I., Holt A., Lewis K.D. In vivo enhancer analysis of human conserved non-coding sequences. Nature. 2006;444:499–502. doi: 10.1038/nature05295. [DOI] [PubMed] [Google Scholar]
- 43.Ried K., Finnis M., Hobson L., Mangelsdorf M., Dayan S., Nancarrow J.K., Woollatt E., Kremmidiotis G., Gardner A., Venter D. Common chromosomal fragile site FRA16D sequence: Identification of the FOR gene spanning FRA16D and homozygous deletions and translocation breakpoints in cancer cells. Hum. Mol. Genet. 2000;9:1651–1663. doi: 10.1093/hmg/9.11.1651. [DOI] [PubMed] [Google Scholar]
- 44.Bednarek A.K., Laflin K.J., Daniel R.L., Liao Q., Hawkins K.A., Aldaz C.M. WWOX, a novel WW domain-containing protein mapping to human chromosome 16q23.3–24.1, a region frequently affected in breast cancer. Cancer Res. 2000;60:2140–2145. [PubMed] [Google Scholar]
- 45.Aqeilan R.I., Croce C.M. WWOX in biological control and tumorigenesis. J. Cell. Physiol. 2007;212:307–310. doi: 10.1002/jcp.21099. [DOI] [PubMed] [Google Scholar]
- 46.Nunez M.I., Ludes-Meyers J., Aldaz C.M. WWOX protein expression in normal human tissues. J. Mol. Histol. 2006;37:115–125. doi: 10.1007/s10735-006-9046-5. [DOI] [PMC free article] [PubMed] [Google Scholar]
- 47.Aqeilan R.I., Trapasso F., Hussain S., Costinean S., Marshall D., Pekarsky Y., Hagan J.P., Zanesi N., Kaou M., Stein G.S. Targeted deletion of Wwox reveals a tumor suppressor function. Proc. Natl. Acad. Sci. USA. 2007;104:3949–3954. doi: 10.1073/pnas.0609783104. [DOI] [PMC free article] [PubMed] [Google Scholar]
- 48.O'Keefe L.V., Richards R.I. Common chromosomal fragile sites and cancer: Focus on FRA16D. Cancer Lett. 2006;232:37–47. doi: 10.1016/j.canlet.2005.07.041. [DOI] [PubMed] [Google Scholar]
Associated Data
This section collects any data citations, data availability statements, or supplementary materials included in this article.