

Abstract
The defining characteristic of recessive disorders is the absence of disease in heterozygous carriers of the mutant alleles. However, it has been recognized that recessive carriers may differ from noncarriers in some phenotypes. Here, we studied ataxia telangiectasia (AT), a classical recessive disorder caused by mutations in the ataxia telangiectasia mutated (ATM) gene. We compared the gene and microRNA expression phenotypes of noncarriers, AT carriers who have one copy of the ATM mutations, and AT patients with two copies of ATM mutations. We found that some phenotypes are more similar between noncarriers and AT carriers compared to AT patients, as expected for a recessive disorder. However, for some expression phenotypes, AT carriers are more similar to the patients than to the noncarriers. Analysis of one of these expression phenotypes, TNFSF4 level, allowed us to uncover a regulatory pathway where ATM regulates TNFSF4 expression through MIRN125B. In AT carriers and AT patients, this pathway is disrupted. As a result, the level of MIRN125B is lower and the level of its target gene, TNFSF4, is higher than in noncarriers. A decreased level of MIRN125B is associated with breast cancer, and an elevated level of TNFSF4 is associated with atherosclerosis. Thus, our findings provide a mechanistic suggestion for the increased risk of breast cancer and heart disease in AT carriers. By integrating molecular and computational analyses of gene and microRNA expression, we show the complex consequences of a human gene mutation.
Introduction
Autosomal-recessive disorders are diseases that are expressed in individuals with two copies of the mutant alleles. Carriers who have one copy of a mutant allele do not have phenotypes that differ from noncarriers. However, as early as the 1940s, there were suggestions that heterozygous carriers of recessive mutations may have phenotypic manifestations.1 More recently, population-based studies have shown that carriers of autosomal-recessive disorders such as cystic fibrosis, Gaucher disease, and ataxia telangiectasia (AT; MIM 208900) have increased risk of asthma,2 parkinsonism,3 and breast cancer,4,5 respectively. Although there are not many patients with recessive disorders, there are many carriers of recessive mutations in the population. In the case of AT, the carrier frequency is ∼1 in 100. Therefore, if heterozygous mutations lead to distinct phenotypes, then carriers of these mutations contribute significantly to overall phenotypic diversity and probably to disease susceptibility. Patients with AT, which is caused by mutations in the ataxia telangiectasia mutated (ATM, MIM 607585) gene, have cerebellar ataxia, oculocutaneous telangiectases, immune deficiency, and predisposition to malignancy. The parents of AT patients are obligate carriers and do not have features on physical exams that distinguish them from noncarriers. However, as a group, they have an increased risk of breast cancer and heart disease.4,6 Mice heterozygous for ATM mutations also have an increased risk for cancer7 and metabolic syndrome.8 Genetic studies have identified ATM mutations as susceptibility alleles for breast cancer,4,9 and molecular effects of genetic variants and/or mutations in the ATM gene10–12 have also been studied. However, little progress has been made in understanding the functional consequences of heterozygous ATM mutations. To address this, we have carried out a genome-scale analysis.
Advances in genomics allow large-scale study of gene-expression patterns. The result is a much improved understanding of how gene expression relates to cellular phenotypes. Gene-expression studies have the advantage of resolution and scale that is difficult to match in clinical studies. Recently, we and others have shown that expression levels of genes, like other quantitative phenotypes, are heritable,13–15 and thus their regulation can be genetically dissected. These studies show that allelic forms of gene-expression regulators lead to different expression levels of their target genes.16,17 This offers an opportunity to determine the effect of gene mutations on downstream targets, pathways, and, ultimately, cellular phenotypes.
With this as a premise, we investigated the effect of heterozygous and homozygous ATM mutations on gene and microRNA expression. The results did not show a simple recessive pattern. Instead, we found that some genes and pathways require only one copy of wild-type ATM for normal function, and therefore exhibit a recessive pattern. Others require two copies of wild-type ATM and show a dominant pattern. To better understand the unexpected dominant gene-expression phenotypes, we further analyzed one of them, TNFSF4 (MIM 603594) level, and showed that it is regulated by ATM through MIRN125B. Previous studies have shown that MIRN125B18 and TNFSF419 are associated with breast cancer and heart disease. Thus, our results show the differential effects of ATM mutations on its target genes and suggest a mechanism for the susceptibility of AT carriers to breast cancer and heart disease.
Material and Methods
Tissue Culture and Radiation Treatment
Lymphoblastoid cell lines (Coriell Cell Repositories, Camden, NJ) from eight controls (ATM +/+), eight obligate heterozygous AT carriers (ATM+/−), and eight AT patients (ATM−/−) (Table S1 available online) were grown at a density of 5 × 10⁵ cells/mL in RPMI 1640 with 15% fetal bovine serum, 2 mM L-glutamine, and 100 U/mL penicillin-streptomycin and irradiated at 5 Gy in a 137Cs irradiator. Cells were harvested prior to radiation and at 4 and 24 hr after exposure to ionizing radiation (IR).
mRNA Expression Measurements and Analysis
Total RNA samples were extracted with the RNeasy Mini Kit (QIAGEN, Valencia, CA) and were used for probe preparation and hybridization onto Affymetrix Human Genome Focus GeneChip arrays according to the manufacturer's suggestions (Affymetrix, Santa Clara, CA). Signal intensities and expression calls were calculated with the dCHIP program with the rank-invariant normalization and the perfect match (PM) options.20
For further analysis, we selected for genes that (1) are expressed in lymphoblastoid cells and (2) are expressed at different levels among controls, carriers, and/or patients at baseline and in response to IR. Expressed genes are those that are called “present” in 65 or more samples (out of 72), and differentially expressed genes are those that showed > 1.5-fold difference relative to the baseline ATM+/+ samples.
Two-Way Analysis of Variance
To identify genes with recessive and dominant expression profiles, we performed two-way analysis of variance; the two factors were genotype and time point. Genes whose expression levels across time points were significantly different between ATM+/+ and ATM−/− and also between ATM+/− and ATM−/−, but were not significantly different between ATM+/+ and ATM+/−, were considered to have a “recessive” expression profile. Genes whose expression levels across time points were significantly different between ATM+/+ and ATM−/− and also between ATM+/+ and ATM+/− but not significantly different between ATM+/− and ATM−/− were considered to have a “dominant” expression profile. A threshold of p < 0.01 was used for the gene-expression analysis.
miRNA Expression Measurements
Cell lines from the same eight ATM+/+, eight ATM+/−, and eight ATM−/− individuals as above were used to measure miRNA expression levels. miRNA fractions were extracted from the cells with the PureLink miRNA Isolation Kit (Invitrogen, Carlsbad, CA). miRNA samples were pooled according to ATM genotype and post-IR time point. The Applied Biosystems Early Access Taqman qRT-PCR miRNA panel was used to quantify the level of mature miRNAs.21 Reverse transcription and real-time PCR reactions with 17 ng of miRNA per reaction were performed for 157 human miRNA according to the manufacturer's instructions (Applied Biosystems, Foster City, CA). Each measurement was done in quadruplicate.
Analysis of miRNA Expression
Only miRNAs that showed measurable signals in all of samples were considered for analysis. Normalization of miRNA expression levels was performed by rank-invariant method. MIRN21 was found to be the least variable among the samples and is used for normalization of other miRNAs. For each gene, four replicate measurements were obtained for each sample. In order to avoid arbitrary or subjective definition of outliers, we identified and removed one replicate value that was most deviant from the mean of the replicates. Similar to mRNA analysis, we filtered out miRNA that showed < 1.5-fold difference when compared to the baseline measurement in the control samples. Then, we carried out two-way analysis of variance as above. A threshold of p < 0.001 was used for the miRNA analysis.
Analysis of Potential mRNA-miRNA Interactions
To identify potential targets of miRNAs in human genes, we used the Target-Combo program, which compiles prediction results from PicTar, TargetScanS, and miRanda.
TNFSF4 ELISA Assay
TNFSF4 proteins levels were quantified with human OX40 Ligand/TNFSF4 Immunoassays (R&D Systems, Minneapolis, MN). Assay was performed according to the manufacturer's instructions.
Transfection Experiments
Lymphoblastoid cell lines were transfected with the Amaxa Cell Line Nucleofector Kit V following the manufacturer's instructions (Amaxa Biosystems, Gaithersburg, MD). pMIR-REPORT-TNFSF4-3′UTR WT and pMIR-REPORT-TNFSF4-3′UTR MUT plasmids were generated by the cloning of double-stranded oligonucleotides containing MIRN125B target sequence from TNFSF4 3′UTR with and without a deletion of a seed sequence into a pMIR-REPORT miRNA Expression Reporter Vector (Ambion, Austin, TX). The following oligonucleotides were used for the cloning: M125WT-FOR 5′-AATGCACTAGTCCTCCCGCCCCCACCCCTCAGGGATATTTAAAACTTATTTTATATAAGCTTAATGC-3′, M125WT-REV 5′-GCATTAAGCTTATATAAAATAAGTTTTAAATATCCCTGAGGGGTGGGGGCGGGAGGACTAGTGCATT-3′, M125MUT-FOR 5′-AATGCACTAGTCCTCCCGCCCCCACCCACTTATTTTATATAAGCTTAATGC-3′, and M125MUT-REV 5′-GCATTAAGCTTATATAAAATAAGTGGGTGGGGGCGGGAGGACTAGTGCATT-3′. Prior to cloning, appropriate oligonucleotides were annealed and digested with HindIII and SpeI restriction endonucleases (New England Biolabs, Ipswich, MA). pMIR-REPORT-TNFSF4-3′UTR or pMIR-REPORT-TNFSF4-3′UTR MUT plasmids along with Renilla luciferase control pRL-TK vector (Promega, Madison, WI) were transfected into ATM+/+ cells in triplicate. Cells were harvested 24 hr after transfection and analyzed with Dual-Glo Luciferase Assay System (Promega, Madison, WI). Expression of Renilla luciferase was used as a normalization control.
For the overexpression assay, double-stranded human MIRN125B mimic and C. elegans MIRN67 control mimic (Dharmacon, Lafayette, CO) were transfected into four ATM−/− lymphoblastoid cell lines. All experiments were done in duplicate. Cells were harvested 48 hr after transfection. RNA was extracted with RNeasy kit (QIAGEN, QIAGEN, Valencia, CA) and converted to cDNA, and TNFSF4 expression was measured by real-time PCR. Expression of beta-actin was used as a normalization control. The following primers were used: TNFSF4-FOR 5′-ATGAACCAACCCCTGGAAGC-3′, TNFSF4-REV 5′-GTTTGGAGGCTGGGAAAGC-3′, ACTB-FOR 5′-AAGATCATTGCTCCTCCTGAGC-3′, and ACTB-REV 5′-CATACTCCTGCTTGCTGATCCA-3′.
Analysis of miRNA Promoter Sequences
Promoter sequences defined as 1000 bp upstream of the transcription start site were obtained from the UCSC Genome Browser. Then, we used MATCH program in TRANSFAC database (version 9.3) and the vertebrate matrices to identify transcription-factor binding sites. Significance of overrepresentation of binding site between categories was evaluated with the Fisher's Exact Test.
Quantitative Real-Time PCR and Chromatin Immunoprecipitations
CDX2 expression was measured in eight ATM+/+, eight ATM+/−, and eight ATM−/− lymphoblastoid cell lines by quantitative PCR with the following primers: CDX2-FOR 5′-TCTCTTCCCTTCCCAGACCA-3′ and CDX2-REV 5′-CACCCTGTGCATACACCAGC-3′. Expression of beta-actin was used as a normalization control. Chromatin immunoprecipitation (ChIP) was performed with CDX2 antibodies (BioGenex Laboratories, San Ramon, CA) according to the protocol developed by Affymetrix. In brief, 3 × 10⁷ cells were harvested per sample and crosslinked with formaldehyde at a final concentration of 1% for 20 min. The formaldehyde reaction was quenched; the cells were washed and lyzed. Then, the samples were sonicated to shear the DNA to 100–500 bp fragments with a Branson Sonifier 450 (12 cycles, 30 s, 70% duty cycle, output 4). Approximately 25 ug of CDX2 antibody was used for each immunoprecipitation reaction. Immunocomplexes were recovered with protein A Sepharose CL-4B (GE Healthcare, Piscataway, NJ). Products from the immunoprecipitation reactions were analyzed by quantitative real-time PCR with the following primer pairs: MIRN125B2-FOR 5′-GGGCCCACCTTACCAGTTGT-3′ and MIRN125B2-REV 5′-AATTTTGCTTCCCATTACACTGC-3′ (designed to amplify a region in human MIRN125B2 promoter with the putative CDX2 binding site as indicated by the MATCH program in TRANSFAC) and MIRN125B2-UPST-FOR 5′-AGCTCAGGAAACTGGATCTTGG-3′ and MIRN125B2-UPST-REV 5′-TCTTTGACCTTATGTGCCCCTT-3′ (designed to amplify a region upstream of MIRN125B2 promoter). Input samples that were crosslinked and fragmented but did not undergo immunoprecipitation were used for normalization. Enrichment of CDX2 binding site in the MIRN125B2 promoter was assessed by qRT-PCR and normalized to the level in the preimmunoprecipitated input DNA. Two independent cell lines were analyzed for each genotype.
Results
Gene-Expression Phenotypes in AT
ATM is known to play a role in cellular response to ionizing radiation. We began by comparing the gene-expression phenotypes of irradiated cells from individuals with zero, one, or two mutated ATM alleles. We exposed lymphoblastoid cells from eight controls, eight obligate heterozygous AT carriers, and eight AT patients (Table S1 available online) to 5 Gy of IR and collected cells at baseline and 4 and 24 hr after exposure. Then, for each individual, RNA samples were extracted and hybridized onto Affymetrix gene-expression microarrays. This gave us data from 72 microarrays (8 samples/genotype × 3 genotypes × 3 time points).
Among the genes on the microarrays, there are 954 genes that showed at least a 1.5-fold difference in expression level compared to that of controls at baseline; we focused on these genes for subsequent analyses. We carried out analysis of variance (ANOVA) to determine the effect of ATM genotype on IR-induced gene-expression phenotypes. Phenotypes are categorized as recessive when the IR response patterns are similar between AT carriers and noncarriers but significantly different (p < 0.01 by ANOVA) from AT patients (Figure 1A). Dominant phenotypes are those where the IR-induced expressions are different between AT carriers and noncarriers (p < 0.01 by ANOVA) but the expression is similar between AT carriers and AT patients (Figure 1B).
Figure 1.
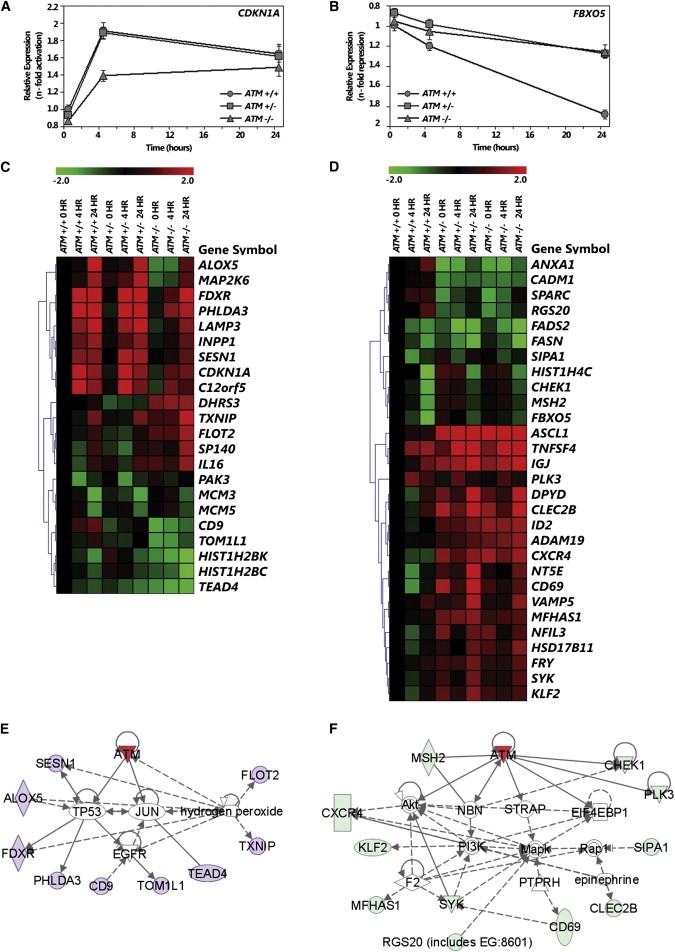
Gene-Expression Phenotypes of Noncarriers, AT Carriers, and AT Patients
(A and B) An example of a gene, CDKN1A, that shows recessive pattern of expression (A) and a gene, FBXO5, that shows dominant pattern of expression (B) in response to radiation.
(C and D) Twenty-two gene-expression phenotypes that show a recessive pattern of expression (C) and 29 gene-expression phenotypes that show a dominant pattern of expression (D).
(E and F) Expression values were obtained with gene-expression microarrays and are presented as n-fold change relative to that of noncarriers at baseline. Two-way ANOVA was performed (p < 0.01, see Material and Methods); eight individuals per genotype were analyzed. Pathways identified with the Ingenuity program show that genes with recessive pattern (in purple) belong to the TP53-ATM pathway (E) and genes with dominant pattern (in light green) belong to the AKT-ATM pathway (F).
Because AT is a recessive disorder, we had expected to find gene-expression phenotypes that exhibit recessive patterns. But instead, we found both recessive and dominant expression phenotypes. At the significance threshold of p < 0.01 (ANOVA), we found 22 mRNAs that showed a recessive pattern (Figure 1C) and 29 with a dominant pattern (Figure 1D). Among the recessive phenotypes are ones that play a role in DNA replication, such as MCM3 (MIM 602693) and MCM5 (MIM 602696) (minichromosome maintenance), and in regulation of apoptosis, such as C12orf5 (also known as TIGAR, MIM 610775).22 The dominant phenotypes include the mismatch repair gene, MSH2 (MIM 609309), and genes involved in lipid metabolism, FADS2 (fatty acid desaturase, MIM 606149) and FASN (fatty acid synthase, MIM 600212).
Pathway analyses of the genes show that many of the recessive gene-expression phenotypes belong to the ATM-p53 pathway (Figure 1E) whereas the dominant gene-expression phenotypes belong to the ATM-AKT pathway (Figure 1F). These findings suggest that even though the expression level of the ATM gene is not significantly different (p > 0.4) between carriers and noncarriers, there are functional differences. Transcriptional activation of some p53-mediated pathways can be achieved with one wild-type copy of ATM, but components of other pathways such as the AKT pathway require two functional copies of ATM.
MicroRNA Expression Phenotypes in AT
Since the discovery of miRNA in 1993,23 many studies have shown that these short (∼21–23 nucleotides) single-stranded RNA molecules play a critical role in regulating gene expression in different organisms from C. elegans to humans (reviewed in 24,25). The role of miRNAs in development and growth regulation are well documented (reviewed in 26). However, their role in disorders that are caused by germline mutations is less well studied. We compared the miRNA expression phenotypes to determine whether they differ among individuals with different ATM genotypes and whether they influence gene-expression phenotypes.
We extracted miRNA from lymphoblastoid cells from the same 24 individuals of three ATM genotypes described above (eight controls, eight AT carriers, and eight AT patients). MiRNA was collected before irradiation and at 4 and 24 hr after IR, as in the gene-expression study. The cells were then pooled by genotype and time point. miRNA expression was studied with a quantitative real-time PCR (qRT-PCR) panel that allowed us to measure the expression levels of 157 miRNAs. Among them, there are 79 miRNAs that are expressed in lymphoblastoid cell lines and whose expression levels after irradiation differ by 1.5-fold or more compared to expression level of controls at baseline (Table S2). We carried out an ANOVA (similar to the gene-expression analysis) on these miRNA to compare the IR-induced miRNA expression patterns among individuals with different ATM genotypes. As with the gene-expression phenotypes, we observed both recessive and dominant phenotypes. There were 15 miRNAs with recessive patterns where the IR-induced expression patterns were similar between noncarriers and AT carriers but were significantly different (p < 0.001) from AT patients (Figure 2A). Among these 15 miRNAs are MIRN181A2 and MIRN195, which are known to play a role in tumorigenesis27 and regulation of stress-induced cell growth.28 In addition, there were seven miRNAs that exhibit dominant IR-induced patterns where the profiles were similar between carriers and AT patients but were significantly different (p < 0.001) from noncarriers (Figure 2B). Of these seven miRNAs, MIRN125B is of particular interest because it has been shown to be dysregulated in breast cancer tissue18 and AT carriers have increased risk of breast cancer (MIM 111480).4,5,7 The results were obtained in pooled samples, so we validated the findings for MIRN125B in individual samples (Figure S1). Previous work showed that MIRN125B regulates gene expression by deadenylation of its target genes, which leads to rapid mRNA decay.29
Figure 2.
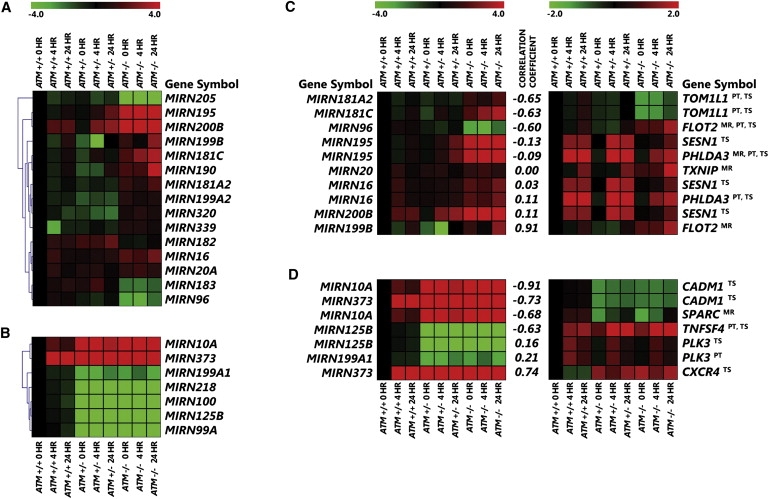
MicroRNA Phenotypes of Noncarriers, AT Carriers, and AT Patients
Fifteen miRNA expression phenotypes that show a recessive pattern of expression (A), and seven miRNA phenotypes that show a dominant pattern of expression (B). Expression values were obtained with qRT-PCR and are presented as n-fold change relative to that of noncarriers at baseline. Two-way ANOVA was performed (p < 0.001, see Material and Methods); eight individuals per genotype were analyzed. miRNAs and their target genes that show recessive (C) and dominant (D) patterns of expression. The programs that predicted the miRNA and target-gene relationship are shown (PT = PicTar, TS = TargetScan, and MR = miRanda). Correlation coefficients for expression levels between the miRNAs and their targets are also shown.
mRNA-MicroRNA Pairs with the Same Mode of Inheritance
Thus far, we have analyzed gene expression and miRNA separately; next, we combined the two datasets to determine whether we can attribute the gene-expression phenotypes to the miRNAs that regulate their expression. We used TargetCombo, a computer program that compiles results from several miRNA target computational prediction programs such as miRanda,30 PicTar,31 and TargetScans,32 to determine whether the gene-expression phenotypes with recessive patterns are targets of the miRNAs with recessive patterns, and similarly for the dominant phenotypes. Figures 2C and 2D show the pairs of miRNAs and their predicted target genes that exhibit recessive and dominant patterns of expressions, respectively. Some of the target genes were identified by two or more prediction programs and therefore are more likely to be “true” target genes.
Because miRNAs are mostly negative regulators of gene expression, we would expect a negative correlation between the expression levels of the miRNAs and their target genes. To examine this, we calculated correlation coefficients between the expression levels of the miRNAs and their potential targets (Figures 2C and 2D). In some cases, we found the expected negative correlation in expression levels of the miRNAs and their target genes. For example, the correlation coefficient between MIRN125B and TNFSF4 was −0.63. However, positive correlations were also found; these could be due to indirect regulatory effects, upregulation of target genes by miRNAs,33 or false-positive miRNA target identification.
MIRN125B Targets TNFSF4
Because the dominant expression phenotypes are unexpected, we followed up one of the findings by molecular analysis. We selected MIRN125B and its potential target TNFSF4 (also known as OX40L) for further study. MIRN125B and TNFSF4 are of interest because they have been implicated in breast cancer18 and heart disease19,34 (MIM 608446), the diseases that were found to be associated with AT heterozygosity.5,6,7,35
Our mRNA expression-profiling results showed that mRNA level of TNFSF4 is significantly (p < 0.005) higher in AT carriers and patients compared to controls at baseline and after exposure to IR (Figure 1D). We confirmed the microarray result by qRT-PCR (Figure S2). The protein expression of TNFSF4 as assessed by ELISA assay is also higher in cells derived from AT carriers and patients (Figure 3A). Sequence analysis showed a binding site of MIRN125B in the 3′ end of TNFSF4. This putative binding site is highly conserved in multiple species including mouse, dog, and human (Figure 3B).
Figure 3.
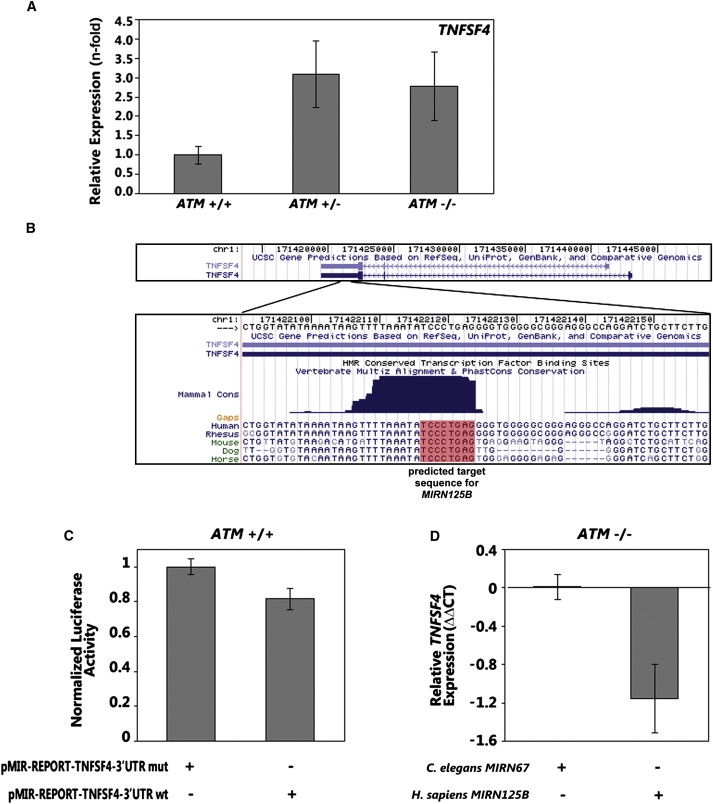
TNFSF4 Is a Target Gene of MIRN125B
(A) Protein level of TNFSF4 at baseline in AT carriers and patients as compared to noncarriers (n = 3 of each genotype).
(B) The consensus binding sequence of MIRN125B located in the 3′UTR of TNFSF4 is shown. The sequence is highly conserved among species.
(C) Luciferase-reporter assays in cells from noncarriers with wild-type binding sequence of MIRN125B in the 3′ UTR of TNFSF4 or mutant sequence where conserved binding site of MIRN125B was deleted (n = 3).
(D) TNFSF4 mRNA levels in AT cells transfected with C.elegans miRNA or MIRN125B (n = 4).
Error bars represent standard error of the mean.
We carried out molecular analysis to determine whether TNFSF4 is a target of MIRN125B. First, we examined the functional legitimacy of the putative binding site of MIRN125B in the 3′ UTR of TNFSF4 by subcloning a genomic sequence containing the MIRN125B binding sequence shown in Figure 3B into firefly luciferase-reporter constructs. We also examined a mutant sequence where the conserved sequence of MIRN125B was deleted. We transfected the constructs with the wild-type and mutant sequences separately into lymphoblastoid cells from noncarriers (who have high endogenous MIRN125B, as shown in Figure 2B). The construct with the wild-type MIRN125B sequence resulted in a decrease in luciferase activity, whereas the construct with the mutant sequence did not downregulate the reporter (Figure 3C). Next, we examined the interaction between MIRN125B and TNFSF4 by transfection of MIRN125B into cells from AT patients (who have low endogenous MIRN125B levels, as shown in Figure 2B). After transfection of synthetic mimics of MIRN125B, we measured the level of TNFSF4 in the transfected cells by qRT-PCR. We observed a decrease in the expression level of TNFSF4 levels, whereas no change in TNFSF4 level was observed in the cells transfected with a miRNA specific to C. elegans (Figure 3D). These findings support our conclusion that TNFSF4 is a target of MIRN125B.
CDX2 Is a Transcriptional Repressor of MIRN125B
Our data show that miRNAs expression patterns are associated with the expression patterns of some gene-expression phenotypes. To identify the factors that influence miRNA expression, we used Match,36 a weight-matrix-based tool, and TRANSFAC (version 9.3), a database of transcription-factor binding sites, to search for transcription-factor binding sites in the promoters of the miRNAs that showed recessive and dominant expression patterns. We found that there is an enrichment of AP2 binding sites in the promoters of recessive miRNA (p = 0.01) and an enrichment of CDX binding sites in the promoter regions of the dominant miRNAs (p = 0.04), including MIRN125B. Table 1 shows the miRNAs with binding sites for AP-2 or CDX in their promoter regions.
Table 1.
Transcription-Factor Binding Sites in the Promoter Regions of miRNAs
| Transcription Factors | Fraction of Recessive miRNAs with Binding Sites (%)a | Recessive miRNAs with Binding Sites | Fraction of Dominant miRNAs with Binding Sites (%)a | Dominant miRNAs with Binding Sites | p Valuec |
|---|---|---|---|---|---|
| AP-2 | 58 | MIRN96, MIRN181C, MIRN182, MIRN183, MIRN190, MIRN195, MIRN199A2, MIRN199B, MIRN200B, MIRN205, MIRN320 | 10 | MIRN199A2 | 0.01 |
| CDX | 21 | MIRN16, MIRN20A, MIRN181Ab | 60 | MIRN10A, MIRN99A, MIRN100, MIRN125B2, MIRN218b | 0.04 |
Promoter region is defined as 1000 bp upstream of transcription start site.
The 15 “recessive miRNAs” are encoded by 19 distinct genes; the seven “dominant miRNAs” are encoded by ten distinct genes. Some miRNAs are encoded by nearly identical genes that are located in more than one genomic location.
Encoded by two distinct genes that are nearly identical; both copies contain the transcription-factor binding site.
Fisher's exact test.
To study the expression of CDX transcription factors, we used qRT-PCR to measure the expression level of CDX1 (MIM 600746) and CDX2 (MIM 600297) in lymphoblastoid cells from noncarriers, AT carriers, and AT patients. Results showed that the CDX1 level is similar in individuals with different ATM genotypes (data not shown); however, the CDX2 level is significantly higher in AT carriers and AT patients compared to noncarriers (Figure 4A).
Figure 4.
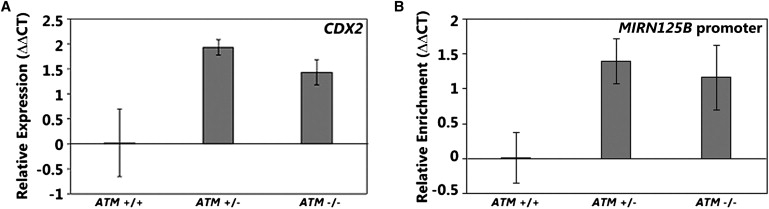
CDX2 Regulates the Expression of MIRN125B
(A) The expression level of CDX2 by qRT-PCR in AT carriers and patients and compared to noncarriers (n = 8 of each genotype).
(B) Results of ChIP assay with CDX2 antibodies showing the binding of CDX2 to promoter of MIRN125B in AT carriers and patients as compared to noncarriers (n = 2 of each genotype).
Error bars represent standard error of the mean.
To assess whether CDX2 is indeed a regulator of MIRN125B, we carried out ChIP assays. In the ChIP assays, we used an antibody specific for CDX2 to assess its binding to the promoter of MIRN125B in cells from individuals with the three different ATM genotypes. After immunoprecipitation, we recovered significantly more MIRN125B promoter fragments from AT carriers and patients than from noncarriers (Figure 4B). This observation is consistent with the higher expression level of CDX2 in AT carriers and patients than controls (Figure 4A). No enrichment was seen in negative controls: in a genomic region upstream of MIRN125B promoter and when mock immunoprecipitations were carried out without antibody (Figure S3).
Other studies have shown that CDX2 acts as a transcriptional repressor.37,38 Therefore, we hypothesize that increased CDX2 binding results in lower levels of MIRN125B in AT carriers and patients (Figure 2B). The relatively lower level of MIRN125B in turn results in less downregulation of its target gene, TNFSF4 (Figures 3C and 3D), which is then expressed at a higher level in AT carriers and patients (Figure 1D).
ATM Regulates TNFSF4 via CDX2
Previous studies have also shown that ATM negatively regulates the expression of CDX2 through the ERK39 and AP-1 pathways.40,41 On the basis of these and our results, we propose the following interpretation (Figure 5). ATM regulates transcription regulators such as CDX2, which in turn regulates the expression of miRNAs including MIRN125B. The miRNAs then influence the expression of target genes such as TNFSF4.
Figure 5.
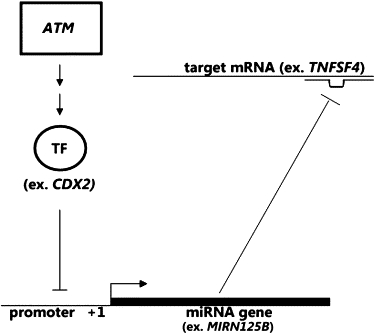
Proposed Model of the Regulation of Expression Phenotypes
ATM regulates transcription factors, such as CDX2, which regulate expression of microRNAs that in turn regulate expression level of genes, including TNFSF4.
Discussion
Traditionally, Mendelian disorders have been classified as recessive or dominant. However, there is increasing recognition that this simple classification is not the “whole story.” Here, we investigated the mechanism underlying the finding that AT carriers and noncarriers have different phenotypes. Population-based studies have shown that even though AT is a recessive disorder, AT carriers have increased risks of breast cancer and heart disease. Studies have suggested that some ATM variants and/or mutations act in a dominant-negative manner and therefore predispose carriers to cancer.7,9,42 Our results provide an alternative view: The same mutations have different effects on different pathways. Some pathways require two copies of wild-type ATM, whereas other pathways require only one wild-type copy of ATM. These gene pathways probably affect clinical phenotypes. Thus, some clinical manifestations of ATM mutations are seen only in patients, whereas others are observed in both carriers and patients. Our results illustrate the complexities of human gene mutations and emphasize the importance of studying biological processes as “networks” rather than as distinct gene-gene interactions.
By incorporating our findings and those in published studies on MIRN125B and TNFSF4, we suggest a mechanism for the increased risk of breast cancer4,5 and cardiovascular disease6,35,43 in AT carriers. Previous studies have shown that breast cancer cells have lower expression levels of MIRN125B.18 We found that AT carriers have lower levels of MIRN125B; this may account for their risk of breast cancer. We also show that TNFSF4 is a target of MIRN125B. The lower MIRN125B levels in AT carriers resulted in higher levels of its target gene, TNFSF4. Previous positional-cloning results showed that TNFSF4 is a susceptibility gene for cardiovascular disease19 and demonstrated that mice overexpressing Tnfsf4 had larger atherosclerotic lesions than control mice.19 This finding was supported by a study that showed that disruption of the Tnfsf4 pathway attenuates atherosclerosis in LDLR-deficient mice.34 In addition, it has been shown that augmentation of ATM activity by chloroquine or related agents improves symptoms of metabolic syndrome.8 Our results provide molecular evidence for how ATM influences TNFSF4 expression: The disruption of normal ATM function in AT carriers leads to overexpression of TNFSF4, which then contributes to elevated risk of heart disease. Like all complex traits, breast cancer and atherosclerosis susceptibilities are influenced by many genetic variants. Our results suggest one of the mechanisms for increased susceptibility for these diseases in AT carriers.
Although the levels of MIRN125B and TNFSF4 in patients are similar to those in carriers, breast cancer and cardiovascular diseases are not commonly seen in patients. This is probably because many AT patients succumb to leukemia or lymphoma in their twenties. Breast cancer and cardiac diseases usually develop later in life.
Our findings have implications beyond AT. Previously, it was estimated that each individual is heterozygous for at least several deleterious mutations.44 Also, a recent report by Bustamente and colleagues shows that an individual on average may be heterozygous for ∼425 nonsynonymous potentially deleterious SNPs.45 Thus, heterozygous recessive mutations probably have an important influence on human phenotypic diversity and susceptibility to complex phenotypes and diseases. A systems approach that combines genetics with genomic and molecular tools allowed us to uncover the network of transcriptional regulators that influences phenotypes in AT carriers. This work can be extended to study other gene mutations in order to quantify the contribution of heterozygous recessive mutations to phenotypic variation.
Supplemental Data
Supplemental Data include three figures and two tables and can be found with this article online at http://www.ajhg.org/.
Supplemental Data
Web Resources
The URLs for data presented herein are as follows:
Affymetrix ChIP protocol, https://www.affymetrix.com/support/file_download.affx?onloadforward=/support/downloads/manuals/chromatin_immun_ChIP.pdf
dCHIP software, http://biosun1.harvard.edu/complab/dchip
Online Mendelian Inheritance in Man, http://www.ncbi.nlm.nih.gov/Omim/
TargetCombo application, http://www.diana.pcbi.upenn.edu/cgi-bin/TargetCombo.cgi
Accession Numbers
Microarray data have been submitted to EBI ArrayExpress (MIAMEXPRESS#20987).
Acknowledgments
We thank Dr. Donna George for ideas and discussions and Dr. Richard Spielman for advice on data analysis. We also thank Dr. Kuang-Yu Jen for generating gene-expression data, Ms. NaRae Ju for the miRNA measurements, and Ms. Teresa Weber for performing the CDX2 chromatin-immunoprecipitation assay. This work was supported by grants from the National Institutes of Health (to V.G.C.) and the W.W. Smith Chair (to V.G.C.), and by the Howard Hughes Medical Institute.
References
- 1.Neel J.V. The clinical detection of the genetic carriers of inherited disease. Medicine. 1947;26:135–153. doi: 10.1097/00005792-194705000-00001. [DOI] [PubMed] [Google Scholar]
- 2.Dahl M., Tybjaerg-Hansen A., Lange P., Nordestgaard B.G. DeltaF508 heterozygosity in cystic fibrosis and susceptibility to asthma. Lancet. 1998;351:1911–1913. doi: 10.1016/s0140-6736(97)11419-2. [DOI] [PubMed] [Google Scholar]
- 3.Goker-Alpan O., Schiffmann R., LaMarca M.E., Nussbaum R.L., McInerney-Leo A., Sidransky E. Parkinsonism among Gaucher disease carriers. J. Med. Genet. 2004;41:937–940. doi: 10.1136/jmg.2004.024455. [DOI] [PMC free article] [PubMed] [Google Scholar]
- 4.Renwick A., Thompson D., Seal S., Kelly P., Chagtai T., Ahmed M., North B., Jayatilake H., Barfoot R., Spanova K. ATM mutations that cause ataxia-telangiectasia are breast cancer susceptibility alleles. Nat. Genet. 2006;38:873–875. doi: 10.1038/ng1837. [DOI] [PubMed] [Google Scholar]
- 5.Swift M., Reitnauer P.J., Morrell D., Chase C.L. Breast and other cancers in families with ataxia-telangiectasia. N. Engl. J. Med. 1987;316:1289–1294. doi: 10.1056/NEJM198705213162101. [DOI] [PubMed] [Google Scholar]
- 6.Su Y., Swift M. Mortality rates among carriers of ataxia-telangiectasia mutant alleles. Ann. Intern. Med. 2000;133:770–778. doi: 10.7326/0003-4819-133-10-200011210-00009. [DOI] [PubMed] [Google Scholar]
- 7.Spring K., Ahangari F., Scott S.P., Waring P., Purdie D.M., Chen P.C., Hourigan K., Ramsay J., McKinnon P.J., Swift M. Mice heterozygous for mutation in Atm, the gene involved in ataxia-telangiectasia, have heightened susceptibility to cancer. Nat. Genet. 2002;32:185–190. doi: 10.1038/ng958. [DOI] [PubMed] [Google Scholar]
- 8.Schneider J.G., Finck B.N., Ren J., Standley K.N., Takagi M., Maclean K.H., Bernal-Mizrachi C., Muslin A.J., Kastan M.B., Semenkovich C.F. ATM-dependent suppression of stress signaling reduces vascular disease in metabolic syndrome. Cell Metab. 2006;4:377–389. doi: 10.1016/j.cmet.2006.10.002. [DOI] [PubMed] [Google Scholar]
- 9.Chenevix-Trench G., Spurdle A.B., Gatei M., Kelly H., Marsh A., Chen X., Donn K., Cummings M., Nyholt D., Jenkins M.A. Dominant negative ATM mutations in breast cancer families. J. Natl. Cancer Inst. 2002;94:205–215. doi: 10.1093/jnci/94.3.205. [DOI] [PubMed] [Google Scholar]
- 10.Becker-Catania S.G., Chen G., Hwang M.J., Wang Z., Sun X., Sanal O., Bernatowska-Matuszkiewicz E., Chessa L., Lee E.Y., Gatti R.A. Ataxia-telangiectasia: Phenotype/genotype studies of ATM protein expression, mutations, and radiosensitivity. Mol. Genet. Metab. 2000;70:122–133. doi: 10.1006/mgme.2000.2998. [DOI] [PubMed] [Google Scholar]
- 11.Fernet M., Moullan N., Lauge A., Stoppa-Lyonnet D., Hall J. Cellular responses to ionising radiation of AT heterozygotes: Differences between missense and truncating mutation carriers. Br. J. Cancer. 2004;90:866–873. doi: 10.1038/sj.bjc.6601549. [DOI] [PMC free article] [PubMed] [Google Scholar]
- 12.Scott S.P., Bendix R., Chen P., Clark R., Dork T., Lavin M.F. Missense mutations but not allelic variants alter the function of ATM by dominant interference in patients with breast cancer. Proc. Natl. Acad. Sci. USA. 2002;99:925–930. doi: 10.1073/pnas.012329699. [DOI] [PMC free article] [PubMed] [Google Scholar]
- 13.Brem R.B., Yvert G., Clinton R., Kruglyak L. Genetic dissection of transcriptional regulation in budding yeast. Science. 2002;296:752–755. doi: 10.1126/science.1069516. [DOI] [PubMed] [Google Scholar]
- 14.Morley M., Molony C.M., Weber T.M., Devlin J.L., Ewens K.G., Spielman R.S., Cheung V.G. Genetic analysis of genome-wide variation in human gene expression. Nature. 2004;430:743–747. doi: 10.1038/nature02797. [DOI] [PMC free article] [PubMed] [Google Scholar]
- 15.Schadt E.E., Monks S.A., Drake T.A., Lusis A.J., Che N., Colinayo V., Ruff T.G., Milligan S.B., Lamb J.R., Cavet G. Genetics of gene expression surveyed in maize, mouse and man. Nature. 2003;422:297–302. doi: 10.1038/nature01434. [DOI] [PubMed] [Google Scholar]
- 16.Cheung V.G., Spielman R.S., Ewens K.G., Weber T.M., Morley M., Burdick J. Mapping determinants of human gene expression by regional and genome-wide association. Nature. 2005;437:1365–1369. doi: 10.1038/nature04244. [DOI] [PMC free article] [PubMed] [Google Scholar]
- 17.Stranger B.E., Forrest M.S., Clark A.G., Minichiello M.J., Deutsch S., Lyle R., Hunt S., Kahl B., Antonarakis S.E., Tavare S. Genome-wide associations of gene expression variation in humans. PLoS Genet. 2005;1:e78. doi: 10.1371/journal.pgen.0010078. [DOI] [PMC free article] [PubMed] [Google Scholar]
- 18.Iorio M.V., Ferracin M., Liu C.G., Veronese A., Spizzo R., Sabbioni S., Magri E., Pedriali M., Fabbri M., Campiglio M. MicroRNA gene expression deregulation in human breast cancer. Cancer Res. 2005;65:7065–7070. doi: 10.1158/0008-5472.CAN-05-1783. [DOI] [PubMed] [Google Scholar]
- 19.Wang X., Ria M., Kelmenson P.M., Eriksson P., Higgins D.C., Samnegard A., Petros C., Rollins J., Bennet A.M., Wiman B. Positional identification of TNFSF4, encoding OX40 ligand, as a gene that influences atherosclerosis susceptibility. Nat. Genet. 2005;37:365–372. doi: 10.1038/ng1524. [DOI] [PubMed] [Google Scholar]
- 20.Li C., Wong W.H. Model-based analysis of oligonucleotide arrays: Expression index computation and outlier detection. Proc. Natl. Acad. Sci. USA. 2001;98:31–36. doi: 10.1073/pnas.011404098. [DOI] [PMC free article] [PubMed] [Google Scholar]
- 21.Chen C., Ridzon D.A., Broomer A.J., Zhou Z., Lee D.H., Nguyen J.T., Barbisin M., Xu N.L., Mahuvakar V.R., Andersen M.R. Real-time quantification of microRNAs by stem-loop RT-PCR. Nucleic Acids Res. 2005;33:e179. doi: 10.1093/nar/gni178. [DOI] [PMC free article] [PubMed] [Google Scholar]
- 22.Bensaad K., Tsuruta A., Selak M.A., Vidal M.N., Nakano K., Bartrons R., Gottlieb E., Vousden K.H. TIGAR, a p53-inducible regulator of glycolysis and apoptosis. Cell. 2006;126:107–120. doi: 10.1016/j.cell.2006.05.036. [DOI] [PubMed] [Google Scholar]
- 23.Lee R.C., Feinbaum R.L., Ambros V. The C. elegans heterochronic gene lin-4 encodes small RNAs with antisense complementarity to lin-14. Cell. 1993;75:843–854. doi: 10.1016/0092-8674(93)90529-y. [DOI] [PubMed] [Google Scholar]
- 24.Jackson R.J., Standart N. How do microRNAs regulate gene expression? Sci. STKE. 2007;2007:re1. doi: 10.1126/stke.3672007re1. [DOI] [PubMed] [Google Scholar]
- 25.Nilsen T.W. Mechanisms of microRNA-mediated gene regulation in animal cells. Trends Genet. 2007;23:243–249. doi: 10.1016/j.tig.2007.02.011. [DOI] [PubMed] [Google Scholar]
- 26.Kloosterman W.P., Plasterk R.H. The diverse functions of microRNAs in animal development and disease. Dev. Cell. 2006;11:441–450. doi: 10.1016/j.devcel.2006.09.009. [DOI] [PubMed] [Google Scholar]
- 27.Pekarsky Y., Santanam U., Cimmino A., Palamarchuk A., Efanov A., Maximov V., Volinia S., Alder H., Liu C.G., Rassenti L. Tcl1 expression in chronic lymphocytic leukemia is regulated by miR-29 and miR-181. Cancer Res. 2006;66:11590–11593. doi: 10.1158/0008-5472.CAN-06-3613. [DOI] [PubMed] [Google Scholar]
- 28.van Rooij E., Sutherland L.B., Liu N., Williams A.H., McAnally J., Gerard R.D., Richardson J.A., Olson E.N. A signature pattern of stress-responsive microRNAs that can evoke cardiac hypertrophy and heart failure. Proc. Natl. Acad. Sci. USA. 2006;103:18255–18260. doi: 10.1073/pnas.0608791103. [DOI] [PMC free article] [PubMed] [Google Scholar]
- 29.Wu L., Fan J., Belasco J.G. MicroRNAs direct rapid deadenylation of mRNA. Proc. Natl. Acad. Sci. USA. 2006;103:4034–4039. doi: 10.1073/pnas.0510928103. [DOI] [PMC free article] [PubMed] [Google Scholar]
- 30.John B., Enright A.J., Aravin A., Tuschl T., Sander C., Marks D.S. Human MicroRNA targets. PLoS Biol. 2004;2:e363. doi: 10.1371/journal.pbio.0020363. [DOI] [PMC free article] [PubMed] [Google Scholar]
- 31.Krek A., Grun D., Poy M.N., Wolf R., Rosenberg L., Epstein E.J., MacMenamin P., da Piedade I., Gunsalus K.C., Stoffel M. Combinatorial microRNA target predictions. Nat. Genet. 2005;37:495–500. doi: 10.1038/ng1536. [DOI] [PubMed] [Google Scholar]
- 32.Lewis B.P., Burge C.B., Bartel D.P. Conserved seed pairing, often flanked by adenosines, indicates that thousands of human genes are microRNA targets. Cell. 2005;120:15–20. doi: 10.1016/j.cell.2004.12.035. [DOI] [PubMed] [Google Scholar]
- 33.Vasudevan S., Tong Y., Steitz J.A. Switching from repression to activation: MicroRNAs can up-regulate translation. Science. 2007;318:1931–1934. doi: 10.1126/science.1149460. [DOI] [PubMed] [Google Scholar]
- 34.van Wanrooij E.J., van Puijvelde G.H., de Vos P., Yagita H., van Berkel T.J., Kuiper J. Interruption of the Tnfrsf4/Tnfsf4 (OX40/OX40L) pathway attenuates atherogenesis in low-density lipoprotein receptor-deficient mice. Arterioscler. Thromb. Vasc. Biol. 2007;27:204–210. doi: 10.1161/01.ATV.0000251007.07648.81. [DOI] [PubMed] [Google Scholar]
- 35.Wu D., Yang H., Xiang W., Zhou L., Shi M., Julies G., Laplante J.M., Ballard B.R., Guo Z. Heterozygous mutation of ataxia-telangiectasia mutated gene aggravates hypercholesterolemia in apoE-deficient mice. J. Lipid Res. 2005;46:1380–1387. doi: 10.1194/jlr.M400430-JLR200. [DOI] [PubMed] [Google Scholar]
- 36.Kel A.E., Gossling E., Reuter I., Cheremushkin E., Kel-Margoulis O.V., Wingender E. MATCH: A tool for searching transcription factor binding sites in DNA sequences. Nucleic Acids Res. 2003;31:3576–3579. doi: 10.1093/nar/gkg585. [DOI] [PMC free article] [PubMed] [Google Scholar]
- 37.Chun S.Y., Chen F., Washburn J.G., MacDonald J.W., Innes K.L., Zhao R., Cruz-Correa M.R., Dang L.H., Dang D.T. CDX2 promotes anchorage-independent growth by transcriptional repression of IGFBP-3. Oncogene. 2007;26:4725–4729. doi: 10.1038/sj.onc.1210258. [DOI] [PubMed] [Google Scholar]
- 38.Niwa H., Toyooka Y., Shimosato D., Strumpf D., Takahashi K., Yagi R., Rossant J. Interaction between Oct3/4 and Cdx2 determines trophectoderm differentiation. Cell. 2005;123:917–929. doi: 10.1016/j.cell.2005.08.040. [DOI] [PubMed] [Google Scholar]
- 39.Tang D., Wu D., Hirao A., Lahti J.M., Liu L., Mazza B., Kidd V.J., Mak T.W., Ingram A.J. ERK activation mediates cell cycle arrest and apoptosis after DNA damage independently of p53. J. Biol. Chem. 2002;277:12710–12717. doi: 10.1074/jbc.M111598200. [DOI] [PubMed] [Google Scholar]
- 40.Lorentz O., Cadoret A., Duluc I., Capeau J., Gespach C., Cherqui G., Freund J.N. Downregulation of the colon tumour-suppressor homeobox gene Cdx-2 by oncogenic ras. Oncogene. 1999;18:87–92. doi: 10.1038/sj.onc.1202280. [DOI] [PubMed] [Google Scholar]
- 41.Weizman N., Shiloh Y., Barzilai A. Contribution of the Atm protein to maintaining cellular homeostasis evidenced by continuous activation of the AP-1 pathway in Atm-deficient brains. J. Biol. Chem. 2003;278:6741–6747. doi: 10.1074/jbc.M211168200. [DOI] [PubMed] [Google Scholar]
- 42.Gatti R.A., Tward A., Concannon P. Cancer risk in ATM heterozygotes: A model of phenotypic and mechanistic differences between missense and truncating mutations. Mol. Genet. Metab. 1999;68:419–423. doi: 10.1006/mgme.1999.2942. [DOI] [PubMed] [Google Scholar]
- 43.Swift M., Chase C. Cancer and cardiac deaths in obligatory ataxia-telangiectasia heterozygotes. Lancet. 1983;1:1049–1050. doi: 10.1016/s0140-6736(83)92678-8. [DOI] [PubMed] [Google Scholar]
- 44.Morton N.E., Crow J.F., Muller H.J. An estimate of the mutational damage in man from data on consanguineous marriages. Proc. Natl. Acad. Sci. USA. 1956;42:855–863. doi: 10.1073/pnas.42.11.855. [DOI] [PMC free article] [PubMed] [Google Scholar]
- 45.Lohmueller K.E., Indap A.R., Schmidt S., Boyko A.R., Hernandez R.D., Hubisz M.J., Sninsky J.J., White T.J., Sunyaev S.R., Nielsen R. Proportionally more deleterious genetic variation in European than in African populations. Nature. 2008;451:994–997. doi: 10.1038/nature06611. [DOI] [PMC free article] [PubMed] [Google Scholar]
Associated Data
This section collects any data citations, data availability statements, or supplementary materials included in this article.