Abstract
Accurate representations and measurements of skull electrical conductivity are essential in developing appropriate forward models for applications such as inverse EEG or Electrical Impedance Tomography of the head. Because of its layered structure, it is often assumed that skull is anisotropic, with an anisotropy ratio around 10. However, no detailed investigation of skull anisotropy has been performed. In this paper we investigate four-electrode measurements of conductivities and their relation to tissue anisotropy ratio (ratio of tangential to radial conductivity) in layered or anisotropic biological samples similar to bone. It is shown here that typical values for the thicknesses and radial conductivities of individual skull layers produce tissue with much smaller anisotropy ratios than 10. Moreover, we show that there are very significant differences between the field patterns formed in a three-layered isotropic structure plausible for bone, and those formed assuming that bone is homogeneous and anisotropic.We performed a measurement of conductivity using an electrode configuration sensitive to the distinction between three-layered and homogeneous anisotropic composition and found results consistent with the sample being three-layered. We recommend that the skull be more appropriately represented as three isotropic layers than as homogeneous and anisotropic.
Keywords: skull conductivity, anisotropy, finite element model, head model
1. INTRODUCTION
The refinement of techniques such as EEG- or MEG-based dipole localization and cranial Electrical Impedance Tomography (EIT) depends essentially on accurate modeling of head shape and conductivity. Inaccurately modeled tissue can result in nonconvergence or instabilities in reconstruction or incorrect estimations of conductivities or dipole locations25,26. Accurate skull modeling is particularly important because skull has a much lower conductivity than other tissues and because the skull barrier affects all external electrical measurements.
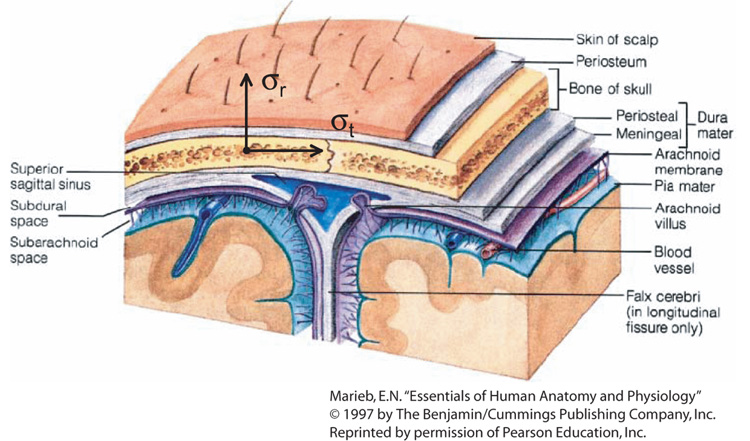
The calvarium is that part of the skull forming the dome-shaped vault that protects the brain. It is formed of the frontal, parietal, occipital and temporal bones. These bones are those over which EEG or EIT electrodes may be situated. In general, these flat bones have a characteristic three-layered structure, shown in Figure 1, with the two outer surfaces being composed of cortical bone and the inner layer being cancellous bone. It should be noted that this structure is not necessarily constant throughout calvarial bones, and the thicknesses and conductivities of the respective layers vary and are interrupted by structures such as Haversian canals and sutures16. Anisotropy in the skull may be related to anisotropy in individual layers of the skull, but is most likely the result of layering of cortical and cancellous bone.
Figure 1.
Typical adult calvarial bone structure, with tangential and radial directions marked.
In characterizing skull conductivities two characteristic directions, radial and tangential, will be defined. These directions are shown in Figure 1. Radial conductivity is that obtained by applying a homogeneous electric field through the thickness of the bone sample (this is the value often reported as the skull conductivity), and tangential conductivity is that obtained by applying a uniform field along the long axis of the sample. The anisotropy ratio, k, is the tangential conductivity divided by radial conductivity.
The most often quoted measurements of skull conductivity were made by Rush and Driscoll28, using soaked dried skull material. They estimated that the ratio of saline conductivity to skull conductivity in the transverse (radial) direction varied from 1:50 to 1:300, and that this ratio, when measured with current flow parallel (tangential) to the surface, varied from 1:5 to 1:40, but they did not give further details of how these measurements were performed. Most works investigating the effect of skull anisotropy cite Rush and Driscoll's work and assume that skull is homogeneous and anisotropic with an anisotropy ratio of up to ten.
The low skull conductivities found by Rush and Driscoll led to the dismissal of EEG - dipole localization techniques because of unacceptable inaccuracies, and justified instead the adoption of Magnetoencephalography (MEG) based localization, since MEG is less sensitive to skull conductivity and/or anisotropy31. However, since the late 1990s workers have observed values for skull conductivity in fresh or living tissue that were much higher than previously assumed, which may lead in some circumstances to improved localization errors using EEG-based methods18,29.
Rush and Driscoll28 noted that the effective conductivity of dried skull samples was dependent upon the conductivity of fluid used to soak it. Their `effective isotropic' value for a `scalp'/skull/`brain' conductivity ratio of around 1:1/80:1, (a conductivity of around 5 mS/m, when considered5 relative to brain and scalp conductivities of 0.46 S/m), was accepted for many years. Subsequent studies have modified this finding. Law16 reported that the (radial) conductivity of skull varied from place to place on the calvarium, being particularly dependent on presence of suture lines. Oostendorp et al.21 found that fresh human skull conductivity was around 15 mS/m in the radial direction — substantially larger than reported by Rush and Driscoll They estimated that this corresponded to a scalp/skull/brain conductivity ratio closer to 1:1/15:1.
More recent papers have inferred skull conductivity from in-vivo measurements via EIT8,9,10, and obtained similar values to those found by Oostendorp. Hoekema et al. 13 measured conductivities of a sample of live skull that had been temporarily removed during surgery, and found values between 32 and 80 mS/m, much higher than other measurements to that time. Most importantly, measurements of the thicknesses and radial conductivities of the three individual layers of the skull were performed by Akhtari et al.2,3, who found that the conductivities of these layers of skull at 20 Hz were different, and that the overall conductivities in live skull were larger than in preserved tissue. They found average conductivities of 1.18 (outer layer) and 3.32 mS/m (inner layer) in compact bone and 7.73 mS/m in the spongiform layer of preserved, soaked tissue3. In live tissue, they found these conductivities a factor of between 1.5 and 5.2 times larger, measuring average conductivities of 6.17 and 4.87 mS/m in compact bone, and 21.4 mS/m in spongiform bone2.
There are many possible sources of head modeling errors that can lead to errors in dipole localization. These include errors in head shape, the presence of individual variations (for example, open sutures or the presence of holes in the skull) and failing to account for anisotropy, principally in white matter and the skull. To our knowledge, although white matter anisotropy is well established, the existence and extent of skull anisotropy, although it is to be expected because of the skull's layered composition, has not been rigorously investigated. Modeling errors have been shown to cause errors in EEG-based dipole location. Examples studies include those evaluating effects of incorrect assumptions of head tissue shape and conductivity (for example, Peters and de Munck22, Cuffin6, Pohlmeier et al.23, Roth et al.26, Ollikainen et al.20, Holdefer et al.14) or the presence of anomalies such as skull holes (Haueisen et al.12, van den Broek et al.30). One recent area of interest has been errors introduced by inaccurate estimations of skull conductivity and/or anisotropy (Marin et al.19, Ryynänen et al.29, Hallez et al.11, Anwander et al.4, Wolters et al.33). Hallez et al. found that source location differences of as much as 13 mm could result between a model that included skull anisotropy of 10 and an isotropic skull model. Most recently Ramon et al.24,25 found significant improvement in both EEG and MEG localization results using models that include all three skull layers.
In this paper we derive expressions for the effective anisotropy of layered structures, as well as analytical expressions for dependence of four-electrode conductivities measured on a homogeneous and anisotropic skull surface on radial and tangential conductivities. Novel measurement geometries that can be used to determine the extent of anisotropy in thin samples are introduced. Using these, we illustrate the extent of differences between the behavior of three-layered isotropic samples and those that are homogeneous and anisotropic. We describe a measurement of skull conductivity that was consistent with it being a three-layered structure. On the basis of our results, we recommend appropriate alternative approaches to electromagnetically modeling the skull.
2. METHODS
2.1. MATHEMATICAL ANALYSIS
2.1.1. Layered structures and anisotropy in uniform fields
An anisotropic structure can easily be constructed using layered sotropic elements. For the case of bone, the anisotropy ratio, k, is defined here to be the ratio of tangential to radial conductivities observed using uniform electric fields.
| (1) |
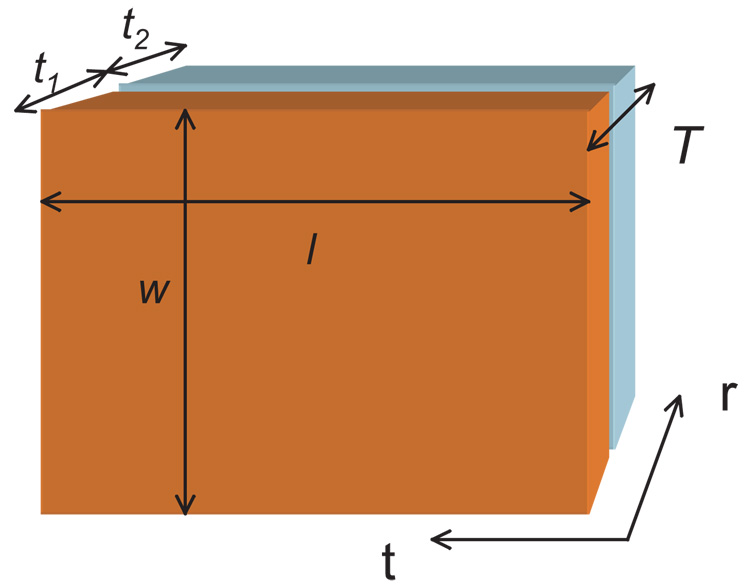
This factor can be computed for the case of the layered brick structure consisting of materials with two different conductivities shown in Figure 2(a), from the ratio of resistances measured in each direction in a uniform electric field. This derivation is detailed in Appendix A. In uniform fields, the value of k observed does not depend on the number of layers of the two different materials or their arrangement, only on the total thickness of each material.
Figure 2.
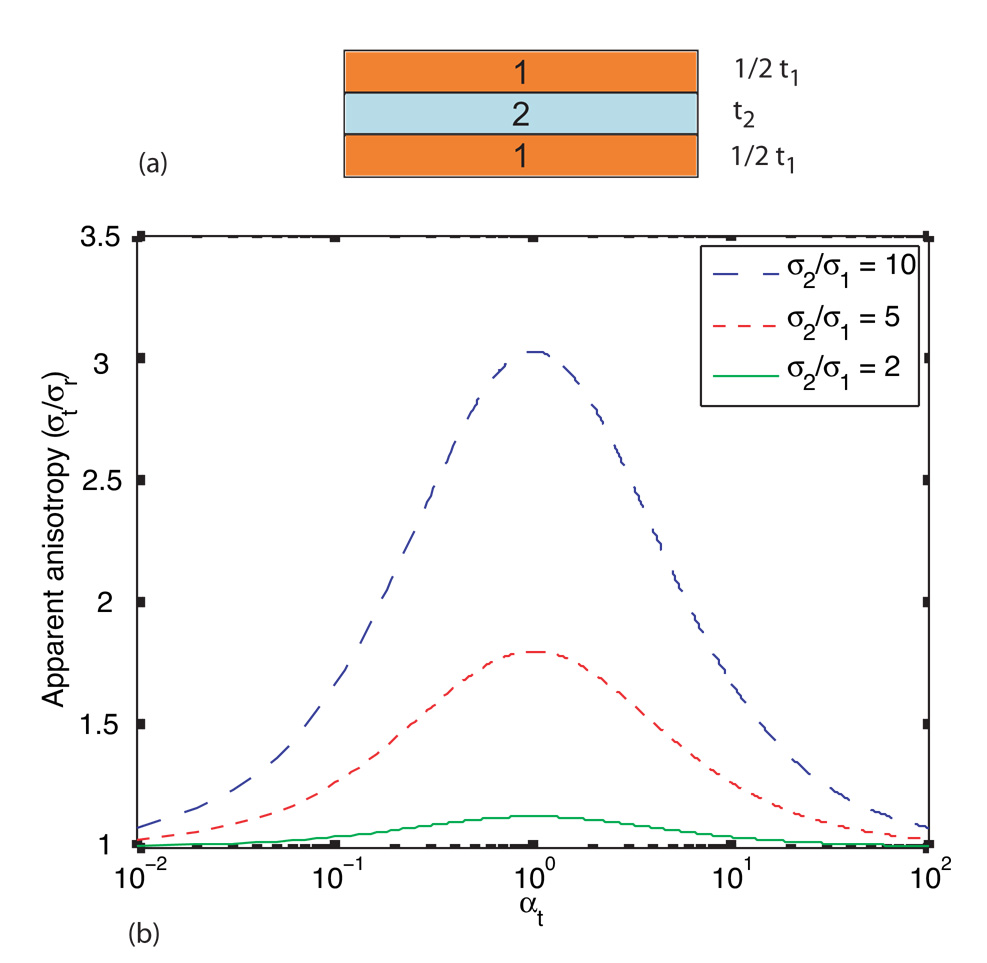
(a) Object composed of three layers of two different conductivities, σ1 and σ2 (with respective total thicknesses t1 and t2, such that t1 = t2 or αt = 1), having overall tangential length l, radial thickness T and width w (b) Plot of κ against αt for conductivity ratios of 2, 3 and 10 for the brick shaped object shown in (a).
The maximum value of k occurs when the total thickness of the two outer layers is the same as the inner layer thickness, i.e. at αt = 1, and can be shown to depend upon a combination of the two conductivities within the structure. For the case of the brick structure
| (2) |
The derivation of equation (2) is also shown in Appendix A.
The dependence of anisotropy ratio on conductivity ratio and relative layer thickness αt = t2/t1 is shown in Figure 2(b)
The largest anisotropy ratio will be observed when the total thicknesses of each layer type are equal. For the brick case, choosing the inner layer to have ten times the conductivity of the two outer layers, kmax will be close to three, significantly less than the conductivity ratio.
2.1.2. Analytic and finite element solutions to the case of an anisotropic tissue slab
Rush27 first derived analytic expressions describing the resistivity of infinite and semi-infinite anisotropic conductive media, and also equations to calculate resistivities observed in an anisotropic conductive slab, that is, one that has infinite extent in the x and y directions, and a finite extent h in the z direction. These equations were derived for tissue that has one high (in-plane) conductivity direction (such as in skeletal muscle), but can be extended to the case where there are two equally high conductivity directions, such as would be expected for a case involving several thin layers of isotropic tissue. General analytic expressions for voltages developed on a single anisotropic slab with arbitrary positioning of a point source and observation position are detailed in Appendix B, and were derived from the expressions developed by Livshitz et al.17,7 for the case of layered isotropic conducting structures. They cannot be easily derived from the expression given by Rush27, which describes the case where sources and observations are all located on the plane z = 0.
2.1.3. `Orthogonal' and `Diagonal' conductivity observations
In anisotropic tissue, observation of conductivity is always dependent upon measurement configuration. In observations performed on isotropic materials, the correct isotropic conductivity can be determined directly for any electrode configuration by measuring a cell constant relative to a known conductivity standard that has the same shape, using the same electrode configuration, then combining this factor with a measured admittance or resistance value to obtain conductivity or resistivity. In the case of anisotropic tissue, the value obtained by this process will provide a value that is dependent on the electrode configuration and additionally, some function of the anisotropy tensor components of the material. We term the value obtained using this procedure the apparent conductivity or resistivity.
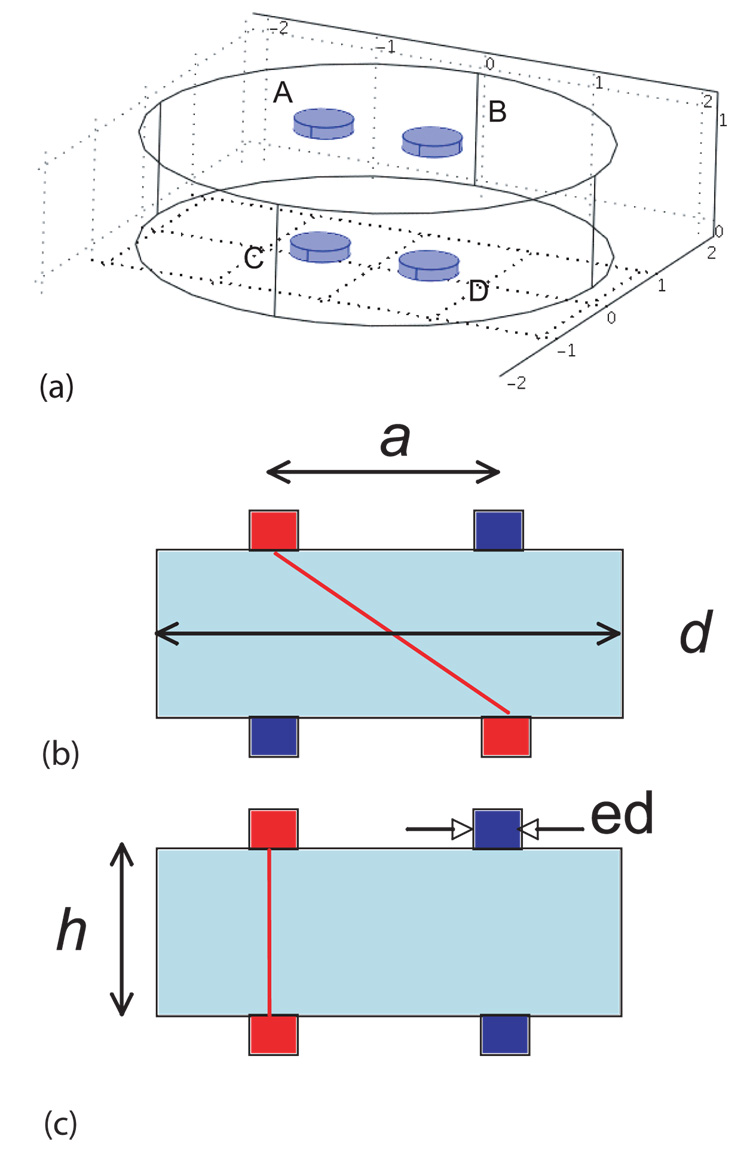
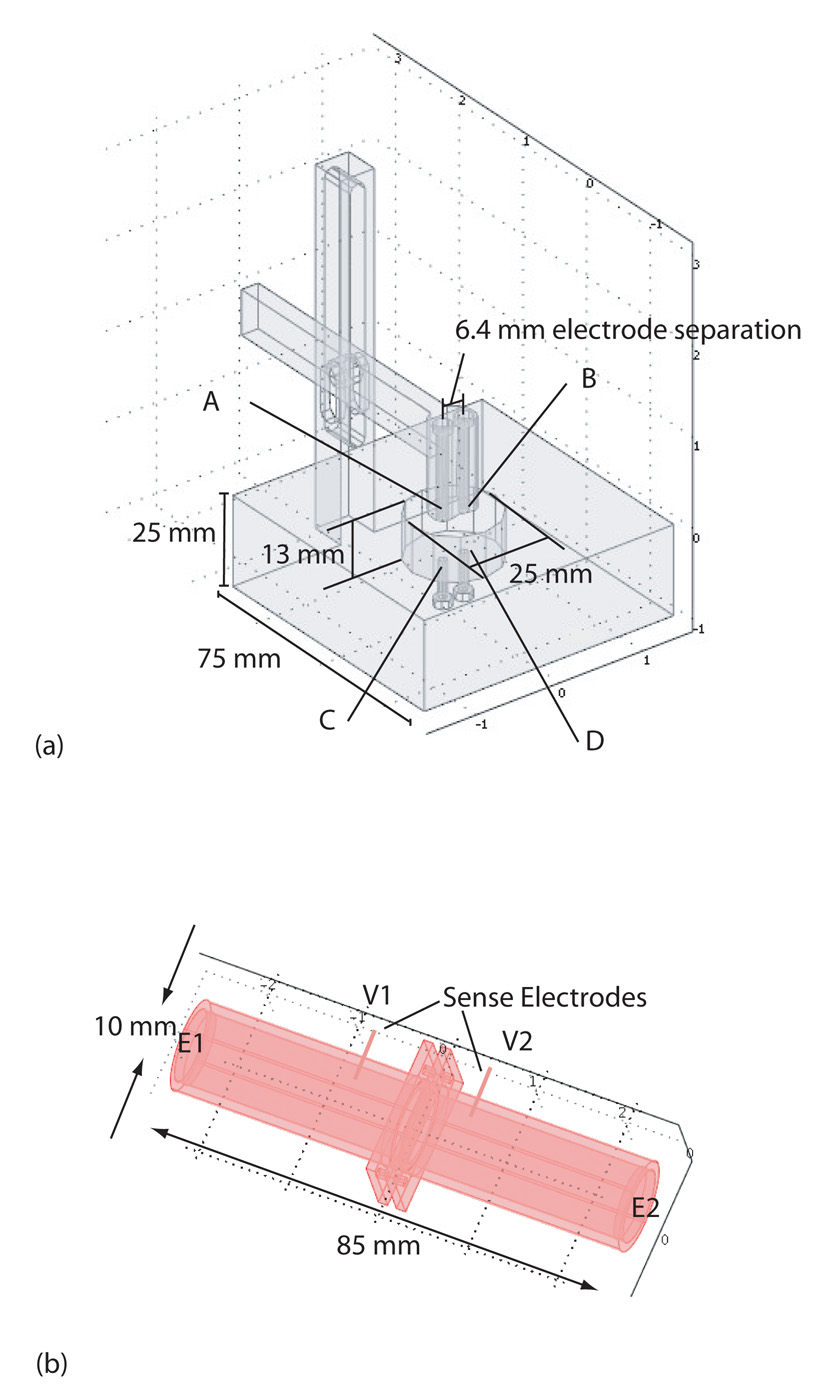
Conductivity observations on thin structures were proposed, using two four-electrode arrangements, shown in Figure 3(b) and (c). The three-dimensional arrangement of the electrode geometry is shown in Figure 3(a). These geometries were chosen because observations are unlikely to be affected by surface layer effects15, and are likely sensitive to tissue anisotropy. Diagonal observations involve current flowing obliquely from top to bottom of the sample, via electrodes A and D, and the voltage difference between electrodes B and C. In orthogonal observations, current is passed directly through the sample in the radial direction (A to C) and voltage differences between B and D. The apparent conductivities observed in each configuration depend upon the electrode separation along the x axis (a), the skull thickness (h) (actually the ratio of skull thickness to electrode separation h/a) and the ratio of tangential to radial conductivity (σt/σr). The observed conductivity also depends on electrode size (ed) and tissue size (d) which is most conveniently resolved by reference to a finite element model of the sample15.
Figure 3.
(a) Three-dimensional positions of electrodes on sample (b) Orthogonal and (c) Diagonal conductivity observation geometries, showing h tissue thickness, a electrode separation d and electrode diameter ed.
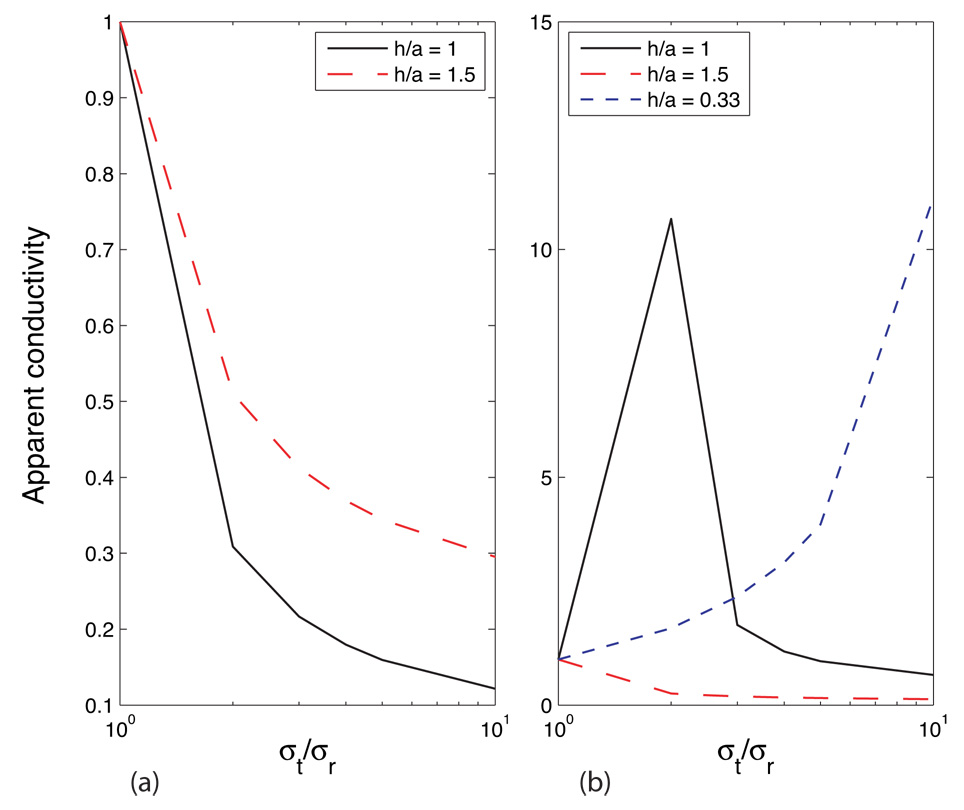
In homogeneous anisotropic tissue, orthogonal observations characteristically show a monotonic decrease in apparent conductivity as anisotropy ratio increases, as shown in Figure 4(a) using the expressions derived in Appendix B. As tissue thickness (and the ratio h/a) decreases, voltages appearing on sense electrodes become very low. This method is therefore not appropriate for use with very thin (low h/a) samples.
Figure 4.
Orthogonal and (b) Diagonal conductivity calculations as a function of h/a, using the expressions derived in Appendix B.
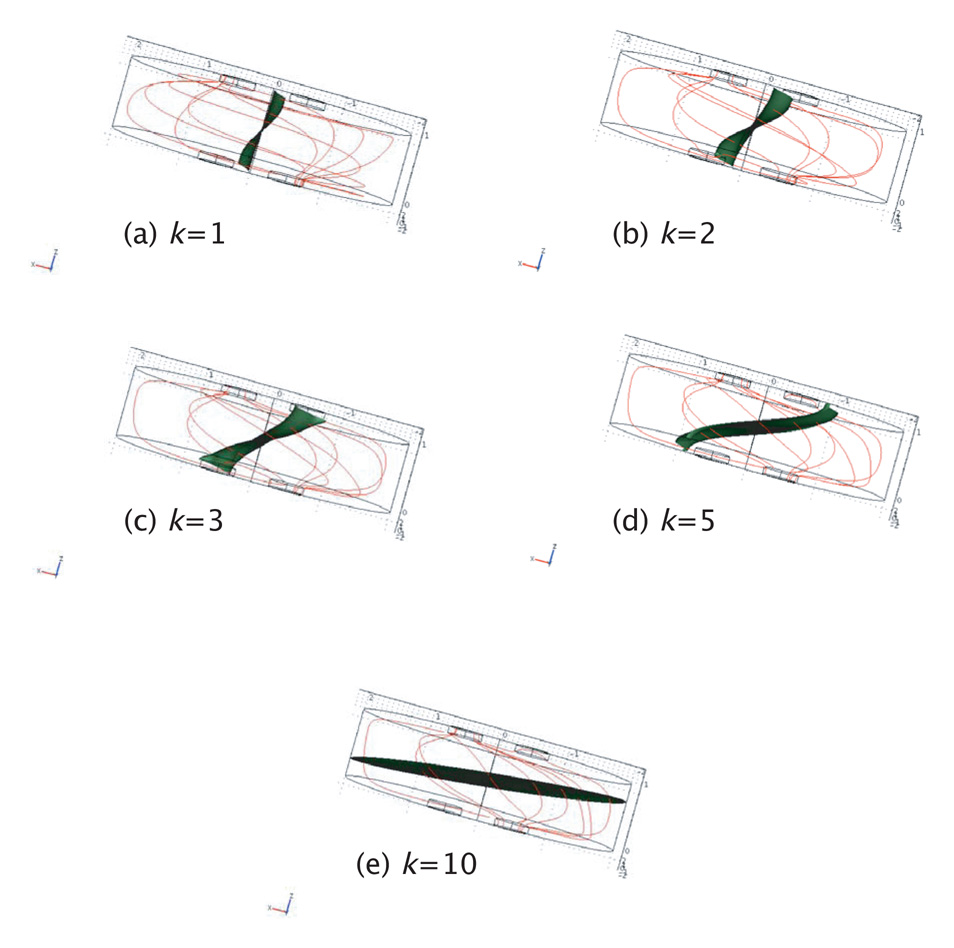
In the case of diagonal observations (again, depending on the ratio h/a), the voltage difference between the two sense electrodes will decrease to a minimum at a particular anisotropy ratio, as shown in Figure 4(b), again via the expressions in Appendix B. The minimum corresponds to the passing of an isosurface across the voltage electrode positions, as shown in Figure 5 for several values of anisotropy ratio k. In each subplot of Figure 5, current streamlines between current electrodes are plotted (as red lines) and the isosurface V = 0 is plotted in green. At an anisotropy ratio of about 2 with this h/a ratio, the isosurface passes through both voltage electrodes. Because there is no voltage difference between them, this corresponds to a zero resistivity or infinite conductivity observation. As the anisotropy ratio increases, the isosurface tilts to become almost horizontal and the polarity of the voltage electrodes is reversed. As h/a decreases and current flow becomes approximately two dimensional, the observed conductivity begins to depend more on tangential conductivity. This geometry, in conjunction with a finite element model of the tissue, may be useful in determining anisotropy in thin (low h/a) samples. It is probably not practical to use the diagonal geometry to adjust electrode separation a until a voltage minimum is reached and thereby determine the anisotropy, although it may be possible using a fixed array of electrodes.
Figure 5.
Current streamlines (red) and zero-volt isosurface (green) plotted for the case h = a for anisotropy ratios of (a) 1 (isotropy), (b) 2, (c) 3 (d) 5 and (e) 10, showing a minimum in differential voltage (isosurface crossing through voltage electrodes) at around k=2. The finite element model used in these calculations had 599 495 degrees of freedom and 432 680 linear tetrahedral elements.
It is apparent that if there is any deviation from isotropy, the apparent conductivity observed using this technique will depend on the relative positions of current and voltage electrode pairs.
2.2. SAMPLE PREPARATION
A calvarium from a male subject was obtained with the permission of the Anatomical Laboratory of the University of Florida Medical School and the Anatomical Board of the State of Florida. An approximately 2.2 cm diameter disk was removed from the skull cap using a hole saw, at a location corresponding to the P3 site in the 10–20 EEG labeling system. The extracted sample did not include sutures or obvious irregularities. After extraction, the sample was placed into a jar containing a 0.9 % NaCl solution, measured to have a conductivity of 1.42 S/m at 20 C. The sample was covered and refrigerated for some time (about one week) in order to allow formalin fixatives to be leached out, and to prevent decomposition. The sample thickness was measured to be 7.3 ± 0.3 mm.
2.3. MEASUREMENT APPARATUS
Impedance measurements were gathered using a Hewlett-Packard 4192A Impedance Analyzer (Agilent, Santa Clara, CA, USA), coupled via the HPIB interface to a LabView (National Instruments, Austin, TX, USA) program designed to collect a set of twenty-four data points within a spectrum ranging from 500 Hz to 100 kHz. A total of ten data sets were collected and averaged for each measurement. All impedance measurements were taken with samples at an ambient room temperature of 27 C.
2.3.1. Orthogonal conductivity measurements
To obtain orthogonal measurements the sample was placed in a height-adjustable fourelectrode cell, shown in Figure 6(a). The cell consisted of a cylindrical well measuring one inch in diameter, with two cylindrical stainless steel electrodes; of 3 mm diameter and protruding 1.5 mm from the bottom surface of the cell, separated by 6.4 mm. The hammer-shaped arm depicted at the top of Figure 6(a) containing the other electrode pair was lowered to contact the upper surface of the sample. Once positioned on the sample, all four electrodes were positioned opposite to each other, and were separated only in the z-direction. Cell constants were obtained for different upper and lower section separations, using a finely meshed finite element model of the apparatus.
Figure 6.
Apparatus used (a) Novel measurement cell. To make orthogonal measurements current was passed between electrodes A and C, and voltages were measured between B and D. In diagonal measurements current was passed between electrodes A and D, with voltage measured between B and C. (b) Radial conductivity cell, showing current application points (E1, E2) and voltage monitoring points (V1, V2)
2.3.2. Radial Conductivity Estimation
To estimate radial skull conductivity we used a saline filled cell, shown in Figure 6(b). This cell was similar to that described in Oostendorp21. The cell had an internal diameter of approximately 10 mm, and a length of 85 mm. The two saline filled halves of the cell were connected by screws passing through the two flanges, and sealed by O-rings. Current was passed between electrodes that sealed the far ends of each tube, and voltage was measured at two electrodes pushed through the walls of the tube, one positioned about 10 mm from the flange on each side. Radial resistivity was estimated by measuring the resistance of the cell before and after inclusion of the bone sample, then multiplying it by the cell constant (the cross sectional area of the cell divided by sample thickness). Conductivity values were then obtained by complex inversion.
2.4. CELL CALIBRATION AND ERROR ANALYSIS
To calibrate conductivity cells we applied the 1-meter lead compensation and the Open/ Short zeroing native to the HP4192A impedance analyzer, as well as an additional Open/Short/Load calibration scheme1. The open circuit configuration of the calibration scheme consisted of separately shorting the high voltage and current electrodes and the low current and voltage electrodes. `Short' values were taken with all four electrodes connected, and a standard conductivity solution was used as the standard load. The final impedance values were calculated as follows
| (3) |
where ZCB (Corrected Bone) and ZMB (Measured bone) are the calibrated and raw sample measurements, respectively, ZMS (Measured Standard) and ZNS are the measured and nominal values of a standard conductivity solution, respectively, Zopen is the open circuit lead impedance, and Zshort is the short circuit lead impedance.
The calibration was obtained and applied to every data point across the frequency spectrum measured.
To translate resistance results obtained from the HP4192A into resistivity or conductivity in the four-electrode cell, appropriate (isotropic) cell factors had to be determined. Cell factors can be obtained through the measurement of standard conductivity solutions; however, this measurement requires that the electrodes be submerged in the solution, rather than making contact with the sample only at the flat surface. Therefore, isotropic cell factors were calculated using a series of finite element models representing the cell geometry with an included bone sample, developed using COMSOL 3.2 (Comsol, Burlington MA, USA). The models covered a range of slice thicknesses and diameters to match different sample sizes as well as the case when the electrodes were submerged in fluid conductivity standard. The reason for using this procedure was to simplify the procedure of obtaining cell constants slightly different thickness samples since it was easier to construct a range of finite element models, each with different thickness, than to fabricate different thickness objects and measure cell constants directly. Because the measurements we performed used only the orthogonal observation configuration, the finite element models were constructed as half models, exploiting the plane of symmetry of the configuration. Models typically had around 500 000 degrees of freedom and 400 000 linear tetrahedral elements. Model validation was performed by comparing cell constants obtained for different height full cell finite element models with those obtained through measurements using a conductivity standard and the cell filled to the same height. The procedure used to estimate cell constants using the finite element model with isotropic conductivity σ was to apply a constant voltage boundary condition (V=1 at the source electrode, and V = 0 on the plane of symmetry). Current flow I through the active electrode was estimated by integrating normal current over electrode area. Voltage between sense electrodes, ΔV, was obtained by doubling the average voltage over the electrode face. Cell constants, measured in m−1, were obtained using the expression
| (4) |
The extent of error in finite element estimations of cell constants was gauged by comparing cell constants for models with those measured in the cell. The maximum difference between cell constants determined using the two procedures was found to be around 5%.
The cell constants used to obtain the conductivity values for bone slices were obtained by comparing ratios of cell constants (K) for the FEM model containing a slice of a given thickness and for a cell full of fluid, such that
| (5) |
Errors in model comparison were estimated and included in total error of conductivity estimates, described below.
Total conductivity errors were calculated by taking into account, in different cases, the contributions from errors such as in conductivity standard values, modeling errors, resistance measurement errors and thickness measurement errors, similar to the method used by Akhtari et al. (2000). Total errors in conductivities measured relative to a standard shape or solution (orthogonal measurements) were calculated using the formula
| (6) |
where K is the cell constant, δσstd is related to errors in conductivity standard value, δσsig represents uncertainty in measured impedances and δσmodel represents errors between the sample geometry and that assumed by a model. In the case of radial measurements the cell constant was the result of two different measurements (for cell area A and sample thickness t), rather than from a measurement referred to a conductivity standard or model, in which case the error was estimated as
| (7) |
3. RESULTS
3.1. COMPARISONS OF LAYERED, ISOTROPIC AND HOMOGENEOUS ANISOTROPIC SKULLMODELS
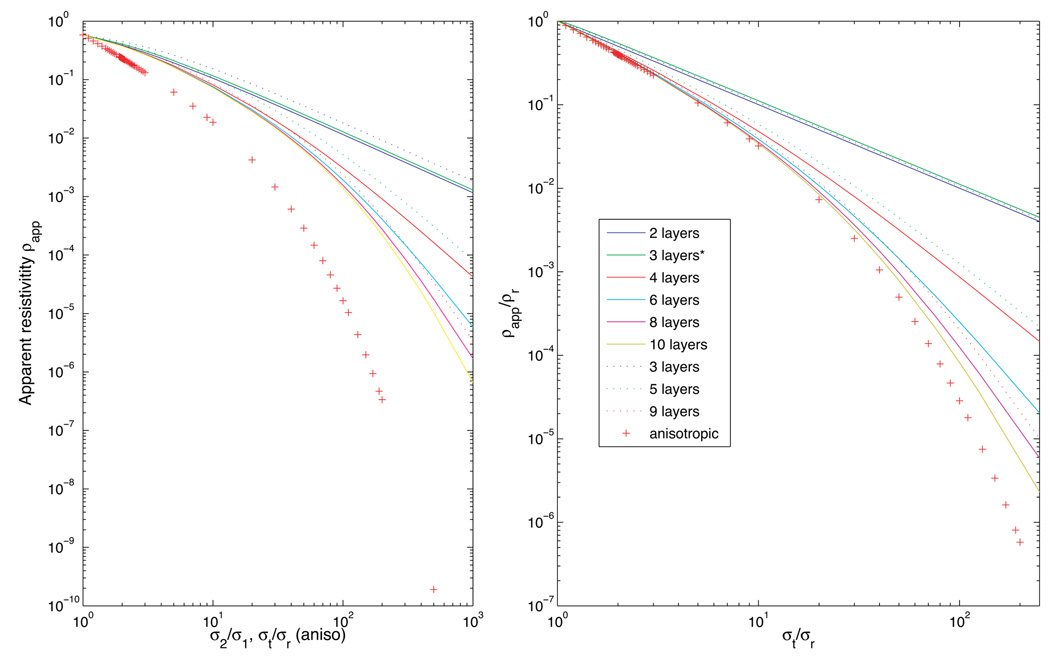
In non-uniform fields such as those formed by the diagonal and orthogonal current configurations, observed conductivities depend not only on the total layer thicknesses, but also on their arrangement. We computed apparent resistivities for two-dimensional models as the number of isotropic layers increased from 2 to 10, with h/a fixed at 1. Layered models were constructed by dividing the model into n layers, each with thickness h/n. Alternate layers had conductivities σ1 or σ2, with σ1 ≤σ2. In the case of odd-layered models, (n+1)/2 layers were chosen to have conductivity σ1 and the remainder σ2, with low conductivity layers next to electrodes. Two three-layered models were investigated, one with equal thickness layers and another with the inner, higher conductivity, layer having twice the thickness of each outer layer (αt = 1). The results for diagonal calculations are shown in Figure 7 and for orthogonal calculations in Figure 8. Curves in Figure 7 (b) and 8 (b) correspond to apparent resistivities relative to radial resistivity, i.e. values have been divided by resistivities observed using a homogeneous radial field. The x-scale for layered isotropic models have also been scaled to be in terms of model anisotropy, that is, values for layered models are plotted as σt/σr against normalized resistivity. Comparisons of apparent resistivities rather than apparent conductivities are shown here in order to better display data near diagonal conductivity minima. Results for layered isotropic models converge to homogeneous anisotropic models as the number of layers increases, and after appropriate scaling.
Figure 7.
Comparison of (two dimensional) calculations using diagonal configuration with h/a = 1, for homogeneous anisotropic and layered models. Raw resistances are shown in (a), with the abscissa either k for anisotropic models, or the layer contrast σ2/σ1 for layered models. Resistances are normalized with respect to the model radial resistivity in graph (b) and the abscissa for isotropic layered models is rescaled to be k. Layer thicknesses are equal to h/n in each case except where indicated by an asterisk (*) where the central layer has twice the thicknesses of the outer two layers.
Figure 8.
Comparison of (two dimensional) calculations using orthogonal configuration with h/a = 1, for homogeneous anisotropic and layered models. Raw resistances are shown in (a), with the abscissa either k for anisotropic models, or the layer contrast σ2/σ1 for layered models. Resistances are normalized with respect to the model radial resistivity in graph (b) and the abscissa for isotropic layered models is rescaled to be k. Layer thicknesses are equal to h/n in each case except where indicated by an asterisk (*) where the central layer has twice the thicknesses of the outer two layers.
In all cases, the diagonal calculation shows characteristic decrease in apparent resistivity as the conductivity contrast σ2/σ1 for isotropic layered models, or tangential conductivity (for anisotropic models) increased. The position of the resistivity minimum varied with the number of layers, but the position of the minimum for layered models occurred at a larger contrast value than k value for anisotropic models. In the case of orthogonal calculations, two layered isotropic models show no relative change in resistivity as contrast ratio increases, but when an odd numbered of layers is used, orthogonal calculations show a characteristic decrease in resistivity with increasing layer contrast. Where four or more layers are used, the increase in relative resistivity with increasing layer contrast begins to appear. Orthogonal calculations for three-layer isotropic models are not comparable with anisotropic conductivities, with apparent resistivities decreasing with increasing contrast in layered isotropic models, and increasing in homogeneous anisotropic models. Thus, observations of orthogonal conductivities that are larger than the corresponding radial observations may indicate a three-layered structure. Diagonal and Orthogonal conductivities for the two three-layered models also show a significant dependence on layer thickness, with higher relative orthogonal conductivities being predicted for an equal thickness three-layered model than for one with αt = 1.
We also simulated the dependence on skull composition of measuring resistivity when applying current via a pair of electrodes located on one surface of the tissue and measuring voltage on the other surface (referring to Figure 3(a), current is passed between electrodes A and B and voltage difference is taken between electrodes C and D). Results for this `parallel' configuration are shown in Figure 9. This configuration is important because it is analogous to the configuration of internal sources with respect to scalp measurements, and shows again that the field patterns formed in three-layered models are significantly different to those formed in homogeneous anisotropic or more finely layered structures.
Figure 9.
Comparison of (two dimensional) calculations using the parallel observation configuration with h/a = 1, for homogeneous anisotropic and layered models. Raw resistances are shown in graph (a), with the abscissa either k for anisotropic models, or the layer contrast σ2/σ1 for layered models. Resistances are normalized with respect to the model radial resistivity in graph (b) and the abscissa for isotropic layered models is rescaled to be k. Layer thicknesses are equal to h/n in each case except where indicated by an asterisk (*) where the central layer has twice the thicknesses of the outer two layers.
A short explorative test of the effect of introducing anisotropy in a three-layered model was performed. Conductivities and layer thicknesses of a three-layered three-dimensional isotropic model were set to the average values found by Akhtari3, and the anisotropy ratio of each tissue was increased. Using an orthogonal observation configuration, it was found when less than 25 % anisotropy (k = 1.25) was added to each layer, the apparent orthogonal conductivity was greater than radial, as expected for a three-layer model. At larger anisotropies, orthogonal conductivities were less than radial values.
The graphs of Figure 7 and Figure 8 were all obtained for the case where h/a = 1. Changing this ratio changes the horizontal scaling of the isotropic layer model plots, but does not change the overall dependence of resistivity or conductivity on layer contrast or k.
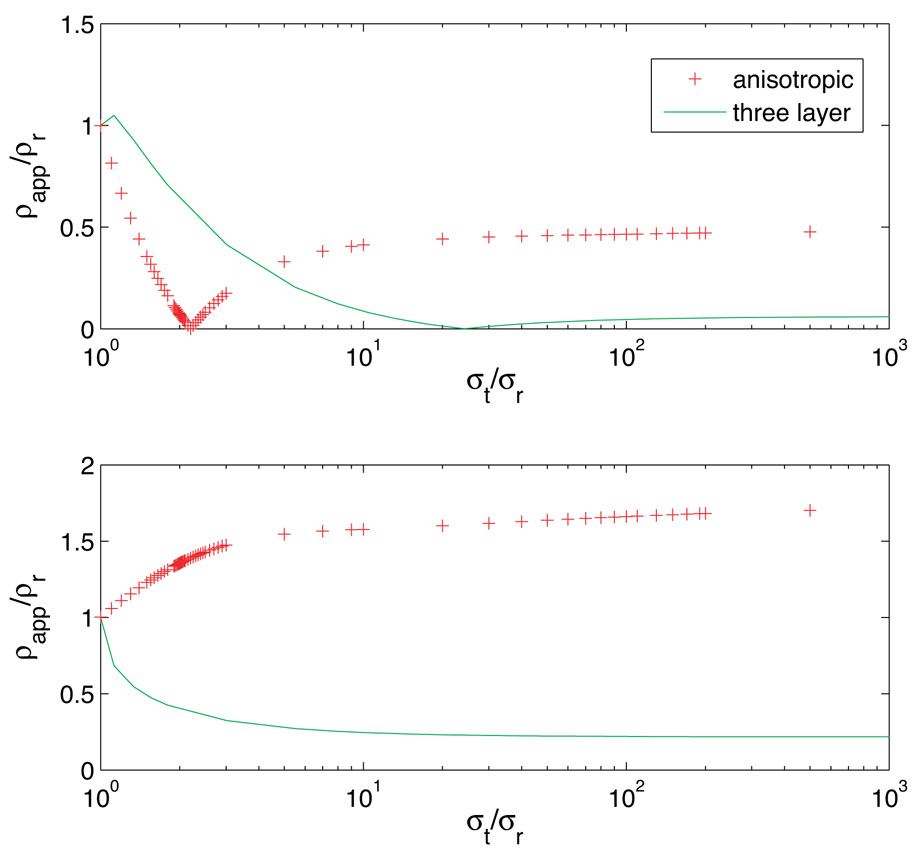
The dependences found in two-dimensional models follow over to three-dimensional models. A comparison of apparent resistivities for diagonal and orthogonal calculations for anisotropic and three layered (αt =1) three-dimensional models is shown in Figure 10. The dependences are broadly similar, but with scaling changes.
Figure 10.
Comparison of normalized (a) diagonal and (b) orthogonal resistivities calculated on a homogeneous anisotropic (+) and a three-layered isotropic model with αt = 1 (solid), for h/a = 1. Axis scaling was performed as in Figure 9 (b).
For example, where minima in two-dimensional diagonal anisotropic calculations are located around k = 3, in three-dimensional models these minima are located around
3.2. HUMAN SKULL CONDUCTIVITY MEASUREMENTS
Using the cells shown in Figure 6, we measured a conductivity of 7.97 ± 0.6 mS/m using the orthogonal configuration and 6.52 ± 0.8 mS/m for radial conductivity, at a frequency of 1 kHz. Because the orthogonal conductivity is higher than the radial, this indicates the tissue is not homogeneous and anisotropic. Assuming a three-layered, three-dimensional structure, the ratio of these conductivities indicates that the conductivity contrast σ2/σ1 was around 1.4.
4. DISCUSSION
The results of Section 3.1 show that although as the number of layers increases, the electrical behavior of a layered sample approaches that of a homogeneous anisotropic sample. However, this convergence is slower for samples with odd numbers of layers, and the comparison between three- layered models and a homogeneous anisotropic model is particularly poor. Behavior for three-layered models depended on the relative thickness of the inner higher conductivity layer. Furthermore, it is clear that a contrast of 10 in layer conductivities does not correspond to a homogeneous anisotropy ratio of 10:1 and that the effective anisotropy of a layered sample is related to both the layer contrast and the measurement geometry. The measurement of Section 3.2 likely demonstrates that the tissue used was not homogeneous and anisotropic, and is consistent with the tissue having a three-layer structure. We consider the example illustrative only, and further studies with a wide range of samples are necessary to fully validate this observation. However, we believe that we have provided a useful framework from which to further investigate skull properties. When each layer in a three layer tissue model was assigned anisotropy, the characteristic three-layered dependence of orthogonal measurements was maintained until an anisotropy ratio of 1.25 was reached, which indicates that the three-layered structure is the dominant factor in determining the model behavior.
4.1. ANALYSIS OF EARLIER RESULTS
Interestingly, these modeling results may also explain the larger than expected conductivities reported by Hoekema et al.13, where conductivity was measured using multiple electrodes on the top and bottom surface of a skull piece removed temporarily during epilepsy surgery. Their method used worked well with an isotropic agar phantom, but was not constant with the skull piece, probably because values were calculated assuming the skull was homogeneous and isotropic. As Figure 7 and Figure 8 show, in the case of a three-layered structure with the inner layer having a higher conductivity than the two outer layers, conductivities measured using diagonal, orthogonal or parallel configurations will always tend to be larger than those found for the radial conductivity. Unfortunately, Hoekema's paper does not mention the exact measurement configurations used. This information, in conjunction with a layered finite element model of the tissue, may enable estimation of radial and tangential conductivities in their sample.
4.2. IMPLICATIONS FOR SKULL MODELING
The diagonal and orthogonal conductivity observation configurations analyzed here may be used to measure conductivity of thin samples, and serve well to illustrate the difference between layered and anisotropic structures, particularly the difference between a three-layered structure (such as much of the calvarium) and a single-layer anisotropic entity. Diagonal, orthogonal and parallel observations clearly show large differences between field patterns formed in three-layered models and homogeneous anisotropic models. In the absence of any other structural basis for calvarial bone composition, it is plain that the skull should be modeled as three layers.
It has been noted that cortical bone and boundaries between cortical and cancellous bone are often not clear on MRI scans, which are commonly used to construct realistic head models. In some cases32, the strategy used has been to locate the cancellous bone boundary and estimate the skull inner and outer (cortical) surfaces as being a fixed distance from this boundary, then assuming homogeneous anisotropic properties for this tissue. Comparing the results of conductivity calculations using three layer isotropic and homogeneous anisotropic skull models, a better strategy would be to detect the cancellous bone, to estimate thickness of the inner and outer cortical layers about it and then assign values appropriate for cancellous or cortical bone to each layer.
As well as a three-layer model being more appropriate and accurate, there are other advantages to making skull components isotropic. If finite element modeling is used and the skull region is modeled as anisotropic, calculation of the stiffness matrix will take longer and the final matrix will be less sparse, which may result in longer solution times (although this is not always the case32). Finite element models of the head must be very finely meshed in the skull region because of the relatively large voltage changes occurring over this structure (because of its low conductivity). A fine finite element mesh would still need to be used if the skull is segmented into layers. Therefore, replacement of an anisotropic finite element model of the skull with a similarly finely meshed layered isotropic finite element model may not lead to a great gain in efficiency, except possibly in stiffness matrix setup time. However, elimination of anisotropy by incorporating these extra layers would allow use of the boundary element method or another meshless method to model the skull, which may be more efficient overall.
5. CONCLUSION
Several conductivity observation geometries were analyzed and compared with respect to variations in the skull model assumed. It was found that three-layer isotropic models (similar to that expected from skull composition) and homogeneous anisotropic models produce significantly different conductivity calculations using these different geometries. We infer from these theoretical observations that forward models of the head that assume the skull as a homogeneous anisotropic compartment are not appropriate, and that the skull may be better modeled as a three-layer isotropic structure. Measurements of skull conductivity on a single sample produced results consistent with the skull being a layered isotropic structure rather than homogeneous and anisotropic. However, more extensive measurements of skull conductivities in different configurations are necessary before generally adopting this approach in forward modeling.
ACKNOWLEDGEMENTS
This work was supported by NIH grant RO1EB-002389 to RJS.
APPENDIX
APPENDIX A
Assume a brick-shaped structure such as that shown in Figure A, consisting of two layers with respective conductivities σ1 and σ2 (or an arbitrary number of layers each one having conductivity either σ1 or σ2, for example the three layer structure shown in Figure 2(a)). The resistances observed in response to homogeneous electric fields applied in the radial and tangential directions, respectively, are
| (A.1) |
| (A.2) |
Figure A.
Brick-shaped structure with width w, length l and total thickness T, composed of two layers having conductivity σ1 and thickness t1, and conductivity σ2 and thickness t2, respectively. Homogeneous fields are applied through the faces with dimension l x w to obtain radial resistances and through faces having dimension w x T to obtain tangential resistances.
We also have that
| (A.3) |
where T = t1 + t2, since
Combining equations A.1, A.2 and A.3, we obtain
| (A.4) |
where we have substituted
Taking the derivative of (A.4) with respect to αt, we find a maximum at αt = 1, or that the maximum value of k is at
| (A.5) |
APPENDIX B
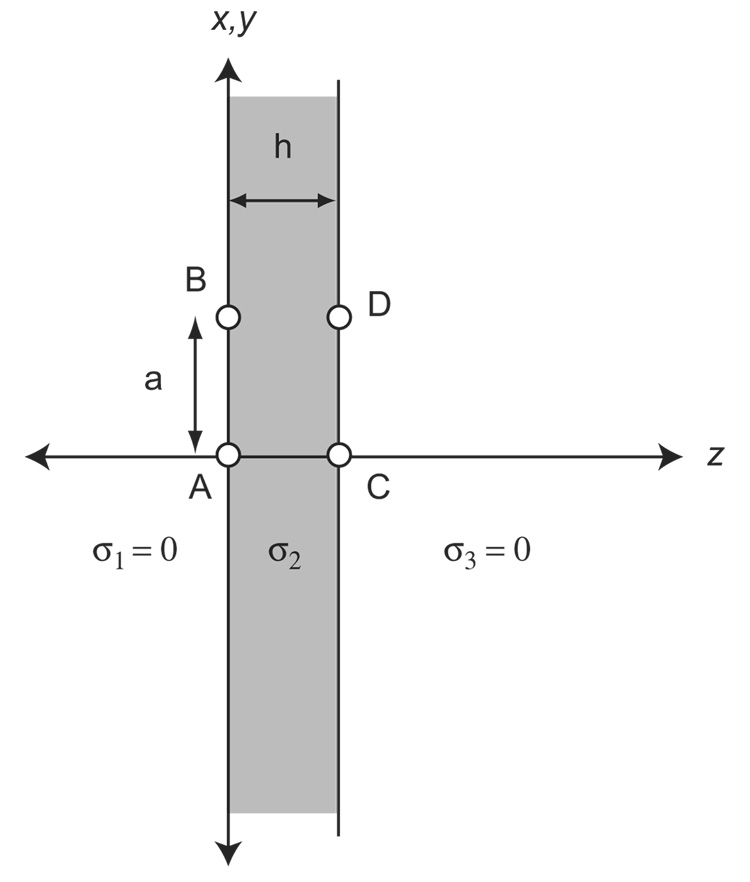
Analytic expressions describing the dependence of diagonal and orthogonal resistivity or conductivity calculations on anisotropy, electrode separation and sample thickness can be derived using Livshitz et al.17 in conjunction with variable spatial scaling to account for anisotropy, similar to that described in Rush27. The geometry used by Livshitz is shown in Figure B.
Figure B.
Configuration for single semi-infinite slab observations, after Livshitz (2000). Conductivities σ1 and σ3 are zero. σ2 may be anisotropic. Sources (x,y,z′) are positioned at A and D for diagonal observations, and voltage differences are calculated between B and C. For orthogonal observations, sources are positioned at A and C and voltage differences are calculated between B and D.
The voltage within the a single semi-infinite slab (region 2) is described by
| B.1 |
where J0 is the zeroth order Bessel function, and β=I/4πσ1. The parameters z′ and r are the z coordinates of the source, and the xy distance between source and observation point respectively.
The functions T1 and T2 are transmission functions across the upper and lower boundaries, and are defined as
| B.2 |
and
| B.3 |
The parameters Ki are defined as
| B.4 |
Therefore, choosing z1 = 0 and z2 = h obtains
| B.5 |
because σ1 = 0 (the conductivity outside the slab), the relation (from equation B.4) is used to calculate β via
| B.6 |
Then, using the Weber-Lipschitz integral,
| B.7 |
expanding the expression for R1 as a Taylor Series in K1e−2λh and incorporating anisotropic scaling, we obtain the expression
| B.8 |
where .
For the case of diagonal observations, voltage is measured at B, positioned at (x,y,z)=(a,0,0)=(r,0). This voltage is the sum of contributions from current sources positioned at A= (x′,y′,z′) = (0,0,0) and D = (x′,y′,z′) = (a,0,h) respectively. In the case of source A
| B.9 |
and for the source at D
| B.10 |
So the voltage on the electrode at B becomes
| B.11 |
By symmetry, the difference between voltages at electrodes at B and C = (x,y,z)=(0,0,h) will be twice this quantity.
For the case of orthogonal observations, VBA will be the same as for the diagonal case, but the voltage contribution from the source at C will be
| B.12 |
and the voltage difference VB will be
| B.12 |
REFERENCES
- 1.Agilent Technologies Co. Ltd. The Impedance Measurement Handbook. Agilent Technologies; 2003. [Google Scholar]
- 2.Akhtari M, Bryant HC, Mamelak AN, Flynn ER, Heller L, Shih JJ, Mandelkern M, Matlachov A, Ranken DM, Dimauro MA, Lee RR, Sutherling WW. Conductivities of three-layer live human skull. Brain Topography. 2002;14:151–167. doi: 10.1023/a:1014590923185. [DOI] [PubMed] [Google Scholar]
- 3.Akhtari M, Bryant HC, Mamelak AN, Heller L, Shih JJ, Mandelkern M, Matlachov A, Ranken DM, Best ED, Sutherling WW. Conductivities of three-layer human skull. Brain Topography. 2000;13:29–42. doi: 10.1023/a:1007882102297. [DOI] [PubMed] [Google Scholar]
- 4.Anwander A, Wolters CH, Dumpelmann M, Knosche T. 13th International Conference on Biomagnetism. Jena Germany 2002: 2002. Influence of realistic skull and white matter anisotropy on the inverse problem in EEG/MEG source localization. (BIOMAG 2002) [Google Scholar]
- 5.Cohen D, Cuffin BN. Demonstration of useful differences between magnetoencephalogram and electroencephalogram. Electroenceph. Clin. Neurophysiol. 1983;56:38–51. doi: 10.1016/0013-4694(83)90005-6. [DOI] [PubMed] [Google Scholar]
- 6.Cuffin BN. Effects of local variations in skull and scalp thickness on EEGs and MEGs. IEEE Transactions on Biomedical Engineering. 1993;40:42–48. doi: 10.1109/10.204770. [DOI] [PubMed] [Google Scholar]
- 7.Einziger PD, Livshitz LM, Mizrahi J. Rigorous image-series expansions of quasi-static Green's functions for regions with planar stratification. IEEE Transactions on Antennas and Propagation. 2002;50:1813–1823. [Google Scholar]
- 8.Goncalves S, De Munck J, Verbunt JPA, Bijma F, Heethaar RM, Lopes Da Silva FH. In vivo measurement of the brain and skull resistivities using an EIT-based method and realistic models for the head. IEEE Transactions on Biomedical Engineering. 2003a;50:754–767. doi: 10.1109/tbme.2003.812164. [DOI] [PubMed] [Google Scholar]
- 9.Goncalves S, De Munck J, Verbunt JPA, Heethaar RM, Lopes Da Silva FH. In vivo measurement of the brain and skull resistivities using an EIT-based method and the combined analysis of SEF/SEP data. IEEE Transactions on Biomedical Engineering. 2003b;50:1124–1128. doi: 10.1109/TBME.2003.816072. [DOI] [PubMed] [Google Scholar]
- 10.Goncalves S, De Munck JC, Heethaar RM, Lopes Da Silva FH, Van Dijk BW. The application of electrical impedance tomography to reduce systematic errors in the EEG inverse problem - a simulation study. Physiological Measurement. 2000;21:379–393. doi: 10.1088/0967-3334/21/3/304. [DOI] [PubMed] [Google Scholar]
- 11.Hallez H, Vanrumste B, Van Hese P, D'Asseler Y, Lemahieu I, Van De Walle R. A finite difference method with reciprocity used to incorporate anisotropy in electroencephalogram dipole source localization. Physics in medicine and biology. 2005;50:3787–3806. doi: 10.1088/0031-9155/50/16/009. [DOI] [PubMed] [Google Scholar]
- 12.Haueisen J, Ramon C, Eiselt M, Brauer H, Nowak H. Influence of tissue resistivities on neuromagnetic fields and electric potentials studied with a finite element model of the head. IEEE Transactions on Biomedical Engineering. 1997;44:727–735. doi: 10.1109/10.605429. [DOI] [PubMed] [Google Scholar]
- 13.Hoekema R, Wieneke GH, Leijten FSS, Van Veelen CWM, Van Rijen PC, Huiskamp GJM, Ansems J, Van Huffelen AC. Measurement of the conductivity of skull, temporarily removed during epilepsy surgery. Brain Topography. 2003;16:29–38. doi: 10.1023/a:1025606415858. [DOI] [PubMed] [Google Scholar]
- 14.Holdefer RN, Sadleir RJ, Russell MJ. Predicted current densities in the brain during transcranial electrical stimulation. Clinical Neurophysiology. 2006;117:1388–1397. doi: 10.1016/j.clinph.2006.02.020. [DOI] [PMC free article] [PubMed] [Google Scholar]
- 15.Kun S, Peura R. Effects of sample geometry and electrode configuration on measured electrical resistivity of skeletal muscle. IEEE Transactions on Biomedical Engineering. 2000;47:163. doi: 10.1109/10.821749. [DOI] [PubMed] [Google Scholar]
- 16.Law SK. Thickness and resistivity variations over the upper surface of the human skull. Brain Topography. 1993;6:99–109. doi: 10.1007/BF01191074. [DOI] [PubMed] [Google Scholar]
- 17.Livshitz LM, Einziger PD, Mizrahi J. Current distribution in skeletal muscle activated by functional electrical stimulation: image-series formulation and isometric recruitment curve. Annals of Biomedical Engineering. 2000;28:1218–1228. doi: 10.1114/1.1320842. [DOI] [PubMed] [Google Scholar]
- 18.Malmivuo JA, Suihko VE. Effect of skull resistivity of the spatial resolutions of EEG and MEG. IEEE Transactions on Biomedical Engineering. 2004;51:1276–1280. doi: 10.1109/TBME.2004.827255. [DOI] [PubMed] [Google Scholar]
- 19.Marin G, Guerin C, Baillet S, Garnero L, Meunier G. Influence of skull anisotropy for the forward and inverse problem in EEG: simulation studies using FEM on realistic head models. Human Brain Mapping. 1998;6:250–269. doi: 10.1002/(SICI)1097-0193(1998)6:4<250::AID-HBM5>3.0.CO;2-2. [DOI] [PMC free article] [PubMed] [Google Scholar]
- 20.Ollikainen JO, Vauhkonen M, Karjalainen PA, Kaipio J. Effects of local skull inhomogeneities on EEG source estimation. Medical Engineering and Physics. 1999;21:143–154. doi: 10.1016/s1350-4533(99)00038-7. [DOI] [PubMed] [Google Scholar]
- 21.Oostendorp TF, Delbeke J, Stegeman DF. The conductivity of the human skull: results of in vivo and in vitro measurements. IEEE Transactions on Biomedical Engineering. 2000;47:1487–1492. doi: 10.1109/TBME.2000.880100. [DOI] [PubMed] [Google Scholar]
- 22.Peters MJ, De Munck J. The influence of model parameters on the inverse solution based on MEGs and EEGs. Acta Otolaryngol (Stock) 1991;(Suppl 491):61–69. doi: 10.3109/00016489109136782. [DOI] [PubMed] [Google Scholar]
- 23.Pohlmeier R, Buchner H, Knoll G, Rienacker A, Beckmann R, Pesch J. The influence of skull - conductivity misspecification on inverse source localization in realistically shaped finite element head models. Brain Topography. 1997;9:157–162. doi: 10.1007/BF01190384. [DOI] [PubMed] [Google Scholar]
- 24.Ramon C, Haueisen J, Schimpf PH. Influence of head models on neuromagnetic fields and inverse source localizations. BioMedical Engineering OnLine. 2006a;55:55. doi: 10.1186/1475-925X-5-55. [DOI] [PMC free article] [PubMed] [Google Scholar]
- 25.Ramon C, Schimpf PH, Haueisen J. Influence of head models on EEG simulations and inverse source localizations. BioMedical Engineering OnLine. 2006b;5:10. doi: 10.1186/1475-925X-5-10. [DOI] [PMC free article] [PubMed] [Google Scholar]
- 26.Roth BJ, KO D, Von Albertini-Carletti IR, Scaffidi D, Sato S. Dipole localization in patients with epilepsy using the realistically shaped head model. Electroencephalography and clinical Neurophysiology. 1997;102:159–166. doi: 10.1016/s0013-4694(96)95111-5. [DOI] [PubMed] [Google Scholar]
- 27.Rush S. Methods of measuring the resistivities of anisotropic conducting media in situ. Journal of research of the National Bureau of Standards - C. Engineering and instrumentation. 1962;66C:217–222. [Google Scholar]
- 28.Rush S, Driscoll DA. Current Distribution in the brain from surface electrodes. Anesthesia and Analgesia. 1968;47:717–723. [PubMed] [Google Scholar]
- 29.Ryynänen O, Hyttinen J, Malmivuo J. Effect of skull resistivity and measurement noise on the spatial resolution of EEG. International Journal of Bioelectromagnetism. 2005;7:317–320. [Google Scholar]
- 30.Van Den Broek SP, Reinders F, Donderwinkel M, Peters MJ. Volume conduction effects in EEG and MEG. Electroencephalography and Clinical Neurophysiology. 1998;106:522–534. doi: 10.1016/s0013-4694(97)00147-8. [DOI] [PubMed] [Google Scholar]
- 31.Wikswo JP, Gevins A, Williamson SJ. The future of the EEG and MEG. Electroencephalography and clinical Neurophysiology. 1993;87:1–9. doi: 10.1016/0013-4694(93)90169-v. [DOI] [PubMed] [Google Scholar]
- 32.Wolters CH, Anwander A, Koch MA, Reitzinger S, Kuhn M, Svensen M. Influence of head tissue conductivity anisotropy on human EEG an MEG using fast high resolution finite element modeling, based on a parallel algebraic multigrid solver. In: Plesser TAMV, editor. Forschung und Wissenschaftliches Rechnen "Contributions to the Heinz-Billing Award". Gottingen: Gesellschaft fur Wissenschaftliche Datenverarbeitung; 2001. [Google Scholar]
- 33.Wolters CH, Anwander A, Tricoche X, Weinstein D, Koch MA, Macleod RS. Influence of tissue conductivity anisotropy on EEG/MEG field and return current computation in a realistic head model: a simulation and visualization study using high-resolution finite element modeling. NeuroImage. 2006;30:813–826. doi: 10.1016/j.neuroimage.2005.10.014. [DOI] [PubMed] [Google Scholar]


