

Abstract
Background
Synergistic neuromuscular blocking effects have been observed clinically with certain pairs of nicotinic acetylcholine receptor (nAChR) competitive antagonists. The mechanism for synergy has not been elucidated. We tested the hypothesis that synergy arises from a differential selectivity of antagonists for the two ligand binding sites on adult human nAChR.
Methods
We expressed nAChR in BOSC23 cells. We applied ACh with or without antagonists to outside-out patches and measured macroscopic currents at room temperature. We determined the IC90 for (+)-tubocurarine, metocurine, pancuronium, vecuronium, cisatracurium, rocuronium, and atracurium. For 15 combinations of two antagonists, we determined the IC90 for one antagonist in the presence of the IC70 of a second antagonist. We constructed isobolograms for 90% inhibition. For single antagonists, we measured inhibition of receptors containing mutations in the ε- and δ-subunits to determine site selectivity.
Results
Two pairs of antagonists, metocurine+cisatracurium and cisatracurium+atracurium exhibited additive inhibition. Ten combinations, including (+)-tubocurarine+pancuronium and pancuronium+vecuronium, were highly synergistic such that the combination was 2−3 times more effective than expected for additivity. Three combinations were 1.5−1.6 times more effective than expected for additivity. Inhibition by (+)-tubocurarine and metocurine was sensitive to mutations in the ε-subunit only. Vecuronium was affected by the δ-subunit mutation only. Inhibition by other antagonists was decreased by mutations in either subunit.
Conclusions
Many combinations of antagonists exhibited synergistic effects on adult human nAChR. Synergy was observed with structurally similar as well as dissimilar antagonists. The degree of synergy did not always correlate well with site specificity assayed with mutants. In some, but not all cases, the synergy at the receptor level correlated with clinical determinations of synergy. We conclude that the synergistic actions of muscle relaxants can be partially explained by direct interactions with adult human nAChR.
Introduction
The clinical use of nondepolarizing muscle relaxants to produce paralysis during surgery began in 1942 with (+)-tubocurarine, a benzylisoquinoline extracted from a South American vine (1). In 1964, pancuronium, a derivative of a steroid toxin found in an African plant, was introduced. The common structural feature of these drugs, one ((+)-tubocurarine) or two (pancuronium) quaternary ammonium groups, confers high affinity binding to the muscle nicotinic acetylcholine receptor (nAChR). The drugs are competitive antagonists of the nAChR.
In the 1980s, certain combinations of nondepolarizing competitive muscle relaxants were observed to have super-additive, or synergistic, neuromuscular blocking effects (2-5). The classic example is the combination of (+)-tubocurarine and pancuronium. A 95% depression of a single twitch (ED95) required either 0.51 mg/kg of (+)-tubocurarine or 0.07 mg/kg of pancuronium (2). However, when the two drugs were combined, ED95 was achieved with less than 1/3 the dose of each drug (2). Synergy has been observed for other combinations, often, but not exclusively with one benzylisoquinoline and one aminosteroid. Combinations of muscle relaxants have been also examined in animal studies of neuromuscular junction (6-8) and isolated muscle preparations (9). With one exception (8), synergy was observed with (+)-tubocurarine or metocurine and pancuronium.
The nAChR has two, non-identical binding sites for acetylcholine (ACh) located at the interface between the α- and δ-subunits and the interface between the α- and ε-subunits (Fig. 1). ACh itself has a 6-fold preference for the α-ε interface at the adult human nAChR (10). (+)-tubocurarine and metocurine also favor the α-ε interface but by factors of 15 and 80 respectively (11). In embryonic nAChR in which the ε-subunit is replaced by a γ-subunit, (+)-tubocurarine and metocurine favor the α-γ interface. Interestingly, distinct amino acid residues confer high selectivity to the ε and γ-subunits (12,13). A 26-fold site selectivity has been seen for pancuronium in adult mouse nAChR (14) and there is evidence that the α-δ interface has the higher affinity (15).
Fig. 1.
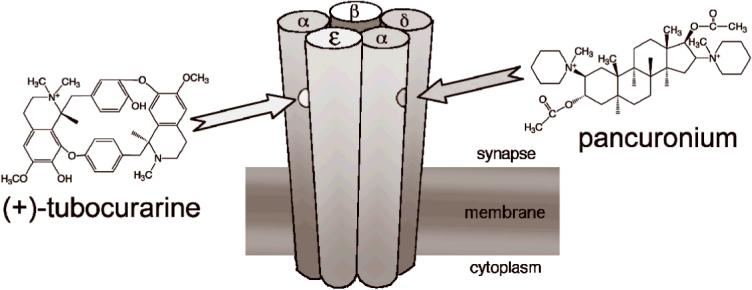
The hypothesis for the origin of synergy between (+)-tubocurarine and pancuronium. There are two distinct binding sites for ACh and competitive antagonists of the muscle nAChR. ACh must bind to both sites before the channel can open efficiently. (+)-tubocurarine has a higher affinity for the binding site at the αε interface than at the αδ interface. The hypothesis is that pancuronium has a higher affinity for the binding site at the αδ interface. In this case, the two antagonists would bind nearly independently and inhibition would be synergistic.
The hypothesis that synergy arises from selective binding of (+)-tubocurarine and pancuronium to opposite interfaces (Fig. 1), originally proposed by Waud & Waud in 1985 (9), was tested in vitro by Paul et al (16). They expressed the subunits of adult mouse nAChR in oocytes and measured the inhibition of acetylcholine-induced currents by pairs of muscle relaxants. They found no evidence for synergy and concluded that synergy must arise from some other process, perhaps involving pre-synaptic nAChRs. These experiments, however, were performed under conditions of relatively low receptor occupancy. When receptor occupancy is low, it can be difficult to distinguish between competition and synergy (9,17).
There is another reason to use conditions of high receptor occupancy when looking for in vitro evidence of synergy. Nature has provided fast-twitch skeletal muscle with a high margin of safety (18). The origin of the safety margin is a combination of a bountiful release of neurotransmitter from the pre-synaptic nerve terminal, a copious density of receptors on the post-synaptic membrane and a generous supply of action-potential-triggering sodium channels at the muscle endplate (19,20). In cat tibialis and sartorium muscles, a receptor occupancy of 0.76±0.05 is needed before any diminution of muscle contraction is detected and the receptor occupancy required for complete block is 0.917±0.16 (18). The margin of safety for the diaphragm muscle may be even higher (21). Although it is sometimes argued that the margin of safety is lower in human muscle compared with other mammals, neuromuscular transmission in normal humans rarely fails (20,22).
Here, we use patch clamp recording to test for in vitro evidence of synergy between pairs of muscle relaxants on adult human nAChR. Specifically, we consider high levels of receptor occupancy to determine the IC90 of individual drugs and drug combinations. These conditions should be comparable to in vivo determinations of CE50 values for muscle relaxation.
Materials and Methods
Human adult muscle nAChRs were expressed in BOSC23 cells, a subclone of human embryonic kidney 293 (HEK-293) cells (American Type Culture Collection, Manassas, VA) using a lipid-based reagent (FuGENE 6, Roche Diagnostics, Basel, Switzerland). Cells were transfected with cDNA coding for subunits of human nAChR: α, β, ε, and δ ((23), gift of Dr. Steven Sine). cDNA for CD8 (gift of Dr. Brian Seed), a T-cell antigen used as a marker (24) was co-transfected. The AChR cDNA was cloned into the pRBG4 expression vector; the CD8 cDNA was cloned into the πH3-CD8 expression plasmid. The mutations εD59A, εD173A and δD180K were prepared from wild-type ε- or δ-subunit by bridging with a 20-base pair oligonucleotide. DNA sequencing confirmed the constructs. Experiments were performed on cells in 2−3 days after transfection. Cells were prepared for patch-clamp recording as described before (25,26). An extracellular solution (ECS) contains 150 mM NaCl, 5.6 mM KCl, 1.8 mM CaCl2, 1.0 mM MgCl2, and 10 mM HEPES, pH 7.3. In order to identify transfected cells, 2−3 μl of polysterene beads coated with a monoclonal antibody specific for the CD8 antigen (Dynabeads; Invitrogen Corporation, Carlsbad, CA) were added in the cell dish. Cells with two or more beads attached were considered likely to express nAChR as well as CD8 (24).
NaCl, KCl and CaCl2 were obtained from Mallinckrodt Baker, Inc. (Phillipsburg, NJ); MgCl2 was obtained from Fisher Scientific (Fairlawn, NJ); HEPES, EGTA, acetylcholine chloride (purity >99%), (+)-tubocurarine chloride (purity 98%), pancuronium dibromide (purity >99%) and atracurium besylate were obtained from Sigma-Aldrich Corp. (St. Louis, MO). Metocurine iodide was synthesized (27) from (+)-tubocurarine at the Chemical Synthesis Center, Department of Chemistry, Stony Brook University. Purity of 99% was determined by 1H-NMR. Vecuronium bromide was obtained as the clinical formulation Norcuron® from Bedford Labs (Bedford, OH), 1 mg/ml (1.8 mM) in a solution containing 2.1 mg/ml anhydrous citric acid, 1.6 mg/ml sodium phosphate and 9.7 mg/ml mannitol. Dilutions were prepared in distilled water. The highest concentration of vecuronium used, 1 μM, contained 95 μM mannitol. Rocuronium bromide was obtained as the clinical formulation Zemuron® from Baxter Pharmaceutical Solutions LLC (Deerfield, IL), 1 mg/ml (16.4 mM). Cisatracurium besylate was obtained as the clinical formulation Nimbex® from GlaxoSmithKline (Philadelphia, PA), 2 mg/ml (2.1 mM) in a 35% benzene sulfonic acid solution. Dilutions were prepared in distilled water. The highest concentration of cisatracurium used, 1 μM, contained 0.017% benzene sulfonic acid.
Patch pipettes filled with a solution consisting of 140 mM KCl, 5 mM EGTA, 5 mM MgCl2, and 10 mM HEPES, pH 7.3, had resistances of 2−7 MΩ. An outside-out patch (28) with a seal resistance of ≥2 GΩ was excised from a cell and moved into position at the outflow of a HSSE-2 rapid perfusion system (ALA Scientific Instruments, Westbury, NY). The gravity-controlled perfusion system consists of solution reservoirs, manual switching valves, a solenoid-driven pinch valve, and two Teflon tubes inserted into the culture dish (29). One tube contained ECS or (ECS+antagonist); the other contained (ECS+ACh) or (ECS+ACh+antagonist). A saturating concentration of 300 μM ACh was used to activate currents in wild-type, εD59A and εD173A nAChR. Activation of δD180K nAChR required 1.5 mM ACh for maximal currents. Manual valves were used to connect to reservoirs containing a defined concentration of competitive antagonist with or without ACh. The system allows a rapid (0.1−1 ms) exchange of the solution bathing the excised patch (29). The patch was clamped at −50 mV while a series of 10−20, 250 ms applications of ACh-containing solution was applied at a 5-second interval. Currents were digitized at 100 μs per point and high-pass filtered at 3 kHz with a patch clamp amplifier (EPC-9, Heka Instruments, Inc., Port Washington, NY).
In experiments with a single antagonist, control currents and recovery currents were obtained with antagonist-free solutions, test currents were obtained with antagonist-containing solutions. In experiments with pairs of antagonists, the control and recovery currents were obtained in the presence of 2× IC50 of antagonist1 and test currents were obtained in the presence of 2× IC50 of antagonist1 + different concentration of antagonist2. An experiment was accepted if the recovery currents were at least 80% of the control currents. At least 6 concentration points were used for every antagonist; at least one of these produced >90% inhibition. Relative currents were calculated as the ratio of the test current, I1, to the average of the control and recovery currents, I0. The Hill Equation was used to determine the IC50, the concentration needed to produce a 50% inhibition of the current and the Hill coefficient, nH.
| Equation 1 |
The IC90 of an antagonist was determined by setting I1/I0=0.1.
Predicted isobolograms were calculated assuming a two site, two drug binding model (18).
| Equation 2 |
where R is the relative number of unliganded receptors, Lαε1, Lαδ1, Lαε2 and Lαδ2 are the equilibrium dissociation constants at the α−ε interface (Lαε) or the α−δ interface (Lαδ) for antagonist1 or antagonist2. The isobologram for 90% inhibition is calculated by setting R=0.1.
Fractional analysis (30,31) was used to quantify the degree of synergy with pairs of antagonists. The individual concentrations of the two antagonists in a combination were calculated as fractions of the concentrations that produce the same 90% inhibition of the macroscopic currents when the antagonists were given separately.
| Equation 3 |
where IC90−1 and IC90−2 are the respective IC90 values of antagonist1 and antagonist2 given alone, and c1 and c2 are the concentrations of the two antagonists that, when combined, produce 90% of inhibition. Values near 1 indicate additive interactions; values >1 indicate antagonistic interactions, and values <1 indicate synergism.
Statistics. Curve fitting of data to Eq. 1 was performed using Igor Pro 6.02 (WaveMetrics, Inc., Oswego, OR). IC50, nH, IC90 and data points in figures are given with average values ± standard deviations from 4−9 separate patches. The fractional analyses are presented as averages with 95% confidence intervals. In experiments with mutant nAChR, inhibition was measured at the antagonist concentration needed to produce a relative current of 0.33 in wild-type receptors. A one-sample, two-sided, t-test was used to determine whether the observed relative current was different from 0.33 using Stata 9.2 (StataCorp, College Station, Texas). Difference were considered to be statistically significant if p<0.05.
Results
Inhibition of AChRs by individual antagonists
Fig. 2a shows representative traces from an experiment with 50 nM (+)-tubocurarine. 300 μM ACh activates >95% of the approximately 300 AChR channels in the patch within 1 ms. The peak current is followed by a decay due to desensitization; time constant = 174 ms in this example. In the presence of 50 nM (+)-tubocurarine, the peak current is decreased by about 60%. Peak currents are plotted as a function of antagonist concentration and fitted to the Hill equation (Fig 2B). For (+)-tubocurarine, IC50 = 24±2 nM and the Hill coefficient is close to 1.0. The IC90 is approximately 10-times the IC50, 286±70 nM for (+)-tubocurarine. Results for all the antagonists in this study are presented in Table 1. For comparison, we include estimates of the clinical concentrations of the antagonists that decrease muscle tension by 50%, CE50, based on pharmacokinetic/pharmacodynamic modeling (32,33).
Fig. 2.

A. An example of macroscopic currents activated by 300 μM ACh and inhibition by 50 nM (+)-tubocurarine. B. The concentration-response curve for (+)-tubocurarine. The IC90 value is obtained by determining the concentration at which the relative current is 0.1. The solid line is the fit to Equation 1; the gray lines are ±1 SD of the fit.
Table 1.
IC50 and IC90 values for competitive antagonism of human nAChRs by various neuromuscular blocking agents. Macroscopic currents were activated by 300 μM ACh, −50 mV. CE50 values are estimates of the clinical concentrations of the antagonists that decrease muscle tension by 50% based on pharmacokinetic/pharmacodynamic modeling (32,33). They are not corrected for the free fraction of drug after accounting for protein binding which ranges from 0.31 for vecuronium to 0.63 for atracurium (33).
| Antagonist | IC50 (nM) | nH | IC90 (nM) | CE50 (nM) | CE50/IC90 |
|---|---|---|---|---|---|
| (+)-tubocurarine | 24 ± 2 | 1.03 ± 0.07 | 286 ± 70 | 606 − 982 | 1.3 − 2.1 |
| metocurine | 18 ± 2 | 1.04 ± 0.11 | 149 ± 32 | ||
| pancuronium | 6.3 ± 0.8 | 0.95 ± 0.08 | 94 ± 28 | 154 | 1.6 |
| vecuronium | 15 ± 2 | 1.03 ± 0.12 | 129 ± 38 | 168 − 190 | 1.3 − 1.5 |
| cisatracurium | 10 ± 1 | 1.02 ± 0.09 | 88 ± 18 | 135 − 169 | 1.5 − 1.9 |
| rocuronium | 17 ± 2 | 0.67 ± 0.05 | 472 ± 95 | 1250−1600 | 2.6 − 3.4 |
| atracurium | 17 ± 2 | 0.56 ± 0.09 | 744 ± 120 |
Inhibition of nAChRs by pairs of antagonists
Fig. 3 illustrates the steps used to construct a nAChR isobologram for two antagonists. Figs. 3A, B show the concentration-response curves for (+)-tubocurarine and pancuronium respectively. We determined the IC90 values and used them as the endpoints for the line of additivity in the isobologram in Fig. 3D. We then measured a concentration-response curve for (+)-tubocurarine in the presence of 15 nM pancuronium, the concentration equal to 2×IC50 of pancuronium (Fig. 3C). Thus, the low (+)-tubocurarine concentration asymptote for the curve in Fig. 3C is 0.33. The IC90 for (+)-tubocurarine in the presence of 15 nM pancuronium is 63 nM. The point (15 nM, 63 nM) is plotted on the isobologram (Fig. 3D). As can be seen from Fig. 3D, the combination of (+)-tubocurarine and pancuronium is highly synergistic for blocking 90% of AChR currents. The fractional IC90 doses are 0.22 and 0.16 for (+)-tubocurarine and pancuronium respectively, giving a total fraction dose of 0.38 (0.25, 0.53) (95% CI). For comparison, the fractional dose for these antagonists on patients is 0.63 (2).
Fig. 3.

Our approach to determining the isobologram for combination of (+)-tubocurarine and pancuronium. (A) The concentration-response curve of (+)-tubocurarine alone. The solid line is the fit to Equation 1; the gray lines are ±1 SD of the fit. The dashed line indicates the IC90. (B) The concentration-response curve of pancuronium alone. (C) The concentration-response curve of (+)-tubocurarine in the presence of 15 nM pancuronium. (D) The isobologram of the combination of (+)-tubocurarine and pancuronium. The solid squares indicate the IC90 values of each antagonist alone and provide the endpoints for the line of additivity. The open square is drawn at [pancuronium]=15 nM and [(+)-tubocurarine]= its IC90 determined in the presence of 15 nM pancuronium. The dashed curve is an isobologram assuming that the antagonists bind exclusively to different sites.
An alternate way to present data from two antagonists is to consider the apparent IC50 of antagonist2 in the presence of antagonist1. In Fig. 4A, we normalized the concentration response curve of (+)-tubocurarine + 15 nM pancuronium to that of (+)-tubocurarine alone. The IC50 values of the two curves are essentially the same, 25 nM. This suggests that the two antagonists bind to the AChR independently rather than compete for the same site. In contrast, Fig. 4B shows a similar comparison for metocurine and cisatracurium. The IC50 of metocurine alone is 18 nM. The apparent IC50 of metocurine in the presence of 20 nM cisatracurium is shifted to 59 nM. This shift to a lower potency is consistent with competition.
Fig. 4.

The concentration response curves of A) (+)-tubocurarine with and without pancuronium, B) metocurine with and without cisatracurium. The data for pairs of antagonists are scaled to match the maximum value in the single antagonist curve (note right-hand axes). There is no shift in the apparent IC50 of (+)-tubocurarine when 15 nM pancuronium is present; this suggests that the antagonists bind independently. There is a 3-fold shift in the apparent IC50 of cisatracurium when 40 nM metocurine is present; this suggests that the antagonists compete for the same binding sites.
For three pairs of antagonists, we experimentally determined additional points on the isobolograms (Fig. 5). We varied the parameters in Equation 2 to obtain an isobologram with R=0.1 using Eq. 2 (dashed line) that intersected the initial experimental point (solid square). We then chose several additional concentration pairs that lie on the isobologram (open squares). The inhibition produced by these additional concentration pairs was determined on 4−6 patches. In all cases, the ratios of resulting currents compared to antagonist-free controls were not significantly different from 0.1 (Fig. 5 insets). Fig. 5A shows the results for vecuronium+pancuronium. They exhibited strong synergy over the entire isobologram. The combination of (+)-tubocurarine+cisatracurium (Fig. 5B) exhibited weaker but significant synergy. The combination of metocurine+cisatracurium was additive (Fig. 5C).
Fig. 5.

The isobolograms for combinations of (A) vecuronium and pancuronium, (B) of (+)-tubocurarine and cisatracurium, and (C) of metocurine and cisatracurium. Closed symbols indicate data points derived from full concentration response curves (as in Figs. 3 and 4). The solid lines isobolograms that fit the closed symbol data point. Open symbols indicate concentration pairs that lie on the isobologram and should produce a relative current (Rel Curr) of 0.1. The insets show the measured relative current produced by these additional concentration pairs. None of the additional pairs produced a relative current significantly different from 0.1.
The results for all pairs of antagonists are summarized in Table 2. The total fractional doses are significantly less than 1.0 (the 95% confidence limits do not overlap 1.0) for all combinations except metocurine+cisatracurium and atracurium+cisatracurium. Clinical values for fractional doses are included for those combinations that have been reported.
Table 2.
Fractional analysis (Equation 3) of the extent of synergy of between combinations of competitive antagonists. Synergy is indicated by fractional values significantly less then 1.0.
| Antagonist2 | Antagonist1 | IC90 (nM) | Fractional Analysis for Receptors (95% CI) | Fractional Analysis for Humans (reference) |
|---|---|---|---|---|
| (+)-tubocurarine | - | 286 ± 70 | - | |
| 15 nM pancuronium | 62 ± 10 | 0.38 (0.25, 0.53) | 0.63 (2) | |
| 30 nM vecuronium | 43 ± 10 | 0.38 (0.21, 0.51) | 0.65 (4) | |
| 40 nM metocurine | 104 ± 12 | 0.63 (0.41, 0.88) | 1.12 (2) | |
| 20 nM cisatracurium | 126 ± 14 | 0.67 (0.44, 0.96) | ||
| 50 nM rocuronium | 59 ± 7 | 0.32 (0.22, 0.46) | ||
| pancuronium | - | 94 ± 28 | ||
| 20 nM cisatracurium | 26 ± 4 | 0.50 (0.34, 0.73) | ||
| 50 nM rocuronium | 21 ± 2 | 0.34 (0.22, 0.51) | 0.94 ± 0.04 (36) | |
| vecuronium | - | 129 ± 38 | ||
| 15 nM pancuronium | 27 ± 4 | 0.37 (0.26, 0.53) | 1.00 (3) | |
| 20 nM cisatracurium | 52 ± 7 | 0.63 (0.44, 0.93) | 0.46 ± 0.03 (35) | |
| 50 nM rocuronium | 31 ± 5 | 0.35 (0.21, 0.54) | 0.92 ± 0.03 (36) | |
| metocurine | - | 149 ± 32 | ||
| 15 nM pancuronium | 49 ± 5 | 0.49 (0.34, 0.70) | ||
| 20 nM cisatracurium | 104 ± 13 | 0.92 (0.59, 1.37) | ||
| 50 nM rocuronium | 28 ± 3 | 0.30 (0.21, 0.42) | ||
| cisatracurium | - | 88 ± 18 | ||
| 50 nM rocuronium | 30 ± 3 | 0.45 (0.31, 0.65) | 0.44 ± 0.03 (35) | |
| 0.12 ± 0.03 (31) | ||||
| atracurium | - | 744 ± 120 | ||
| 20 nM cisatracurium | 369 ± 118 | 0.72 (0.45, 1.1) | 0.96 ± 0.06 (35) |
Inhibition of mutant receptors α2βε(D59A)δ, α2βε(D173A)δ, α2βεδ(D180K)
To test the hypothesis that synergy arises from differential binding of antagonists to the two binding interfaces, we made mutations in the ε-subunit that have been previously identified to alter the binding affinity for metocurine and/or (+)-tubocurarine (11). We also examined a mutation, δD180K, which decreases binding of both ACh and (+)-tubocurarine to the δ-subunit in mouse nAChR (34). We found that it also decreased the sensitivity of adult human nAChR to ACh. The current response saturated with application of 1.5 mM ACh without causing appreciable open channel block at −50 mV (not shown). Thus, experiments with α2βεδ(D180K) were performed with 1.5 mM ACh instead of the 0.3 mM used in all other experiments.
If a mutation in a subunit changes the affinity for a drug, this suggests that the drug has significant interactions with that subunit interface. If there is no change in affinity, the result is inconclusive. Fig. 6 summarizes the results. In all cases, the mutations either reduced the affinity of the receptor for the drugs (less inhibition at a fixed concentration) or caused no change. As expected from previously published data, (+)-tubocurarine and metocurine are sensitive to mutations in the ε−subunit but not in the δ-subunit. Vecuronium is insensitive to the two ε-subunit mutations but is sensitive to the δ-subunit mutation. Inhibition by the other antagonists is sensitive to mutations in either subunit.
Fig. 6.

The inhibition of mutant receptors α2βε(D59A)δ, α2βε(D173A)δ and α2βεδ(D180K) by antagonists. The indicated antagonist concentrations correspond to two times the IC50 for wild-type receptors. The dashed line indicates the fractional current, 0.33, obtained on wild-type receptors. Antagonist abbreviations are (+)-Tc ((+)-tubocurarine), Met (metocurine), Cisatr (cisatracurium), Pan (pancuronium), Vec (vecuronium) and Roc (rocuronium).
Discussion
Synergism between pairs of muscle relaxant drugs has been observed in vivo with human adductor pollicis muscle using either single twitch or train-of-four ratio to assay muscle function (2-5,35-37). It has also been investigated in animals: rat phrenic nerve-hemidiaphragm (6), guinea pig nerve-lumbrical muscle (7), isolated guinea pig lumbrical muscle (9) and rat sciatic nerve-tibialis muscle (8). The fact that synergy was reported in most of these preparations (with the exception of reference (8)) suggests that pharmacokinetic effects are not important. (However, pharmacokinetics may play a role in the interaction between mivacurium and pancuronium due to hydrolysis of mivacurium by butyrylcholinesterase (38)). Recently, synergy was investigated at the receptor level using adult mouse nAChR expressed in oocytes (16). These investigators found no evidence for synergy in their study.
Most of the clinical results are consistent with each other. Additive block was mainly observed with antagonists of similar structures, while super-additive block was observed with different structural classes of antagonists (reviewed in (39)). Combinations of benzylisoquinoliniums such as (+)-tubocurarine + metocurine and cisatracurium + atracurium are additive (2,35). The combination of two aminosteroids, pancuronium and vecuronium are also additive (3). Synergy was seen for pairs of antagonists with different structures, e.g. metocurine and pancuronium (2), (+)-tubocurarine and pancuronium (2) and cisatracurium and vecuronium or rocuronium (35).
We studied human adult muscle nAChRs expressed in BOSC23 cells and found evidence for synergy between many pairs of both similar and dissimilar antagonists. This differs from a previous study of expressed receptors in which no combinations of antagonists exhibited synergy (16). The methods used in the two studies differ in several respects. We used human instead of mouse AChR, we used outside-out patches from a mammalian expression cell line instead of frog oocytes and we examined IC90 levels of antagonist concentrations instead of IC50 levels. All of these factors probably contribute to the different conclusions of the studies. Firstly, the other investigators examined whether the combination of the IC25 of drug A plus the IC25 of drug B was equipotent to the IC50 of a single drug. If the drugs acted competitively, this combination would produce a current 0.50 times the antagonist-free control. If the drugs acted independently, IC25A + IC25B would produce a current 0.44 times the antagonist-free control (Equation 2). These predictions differ by 12%. In contrast, a comparison of the IC45 of the drug combination with the IC90 of a single drug, yields predictions of 0.033 vs 0.099. This 3-fold difference in predictions is considerably easier to detect. Figure 7 presents isobolograms derived from Equation 2 for different levels of receptor occupancy. Others have also discussed this concept (9,17). Secondly, we have noted differences in the effects of antagonists between human and mouse AChR. For example, we found that combinations of pancuronium or vecuronium with (+)-tubocurarine were not synergistic on mouse AhCR (unpublished results). Thirdly, the use of outside-out patches provides ms time resolution to better determine the action of drugs that associate and dissociate on this time scale (25,26). Most importantly, muscle relaxation occurs only when there is a high occupancy of receptors by antagonists (20). A drawback to using such high levels of inhibition in electrophysiology experiments is that the receptor concentration-response curve is relatively flat in this range and this leads to large uncertainties in IC90 values. In contrast, these concentrations are within the steep part of the in vivo curves because of the high margin of safety.
Fig. 7.
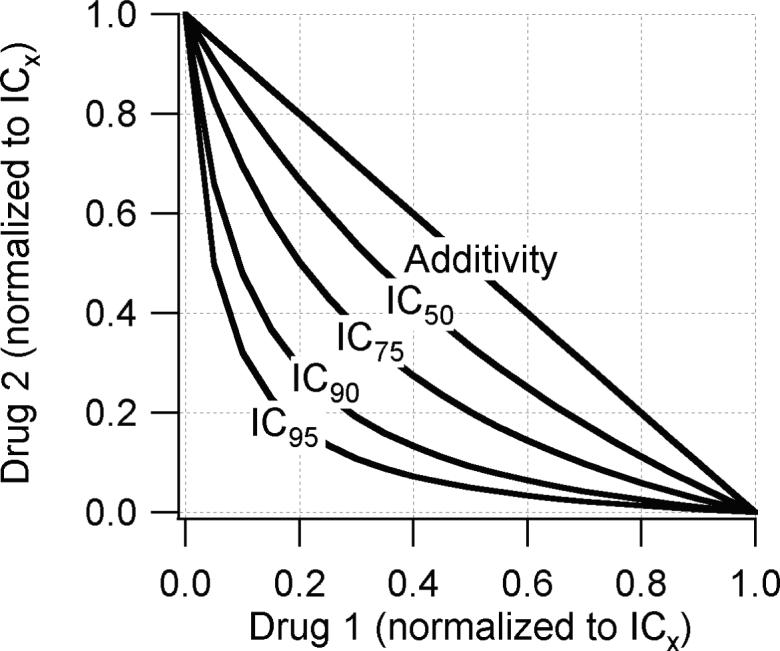
Isobolograms predicted from Equation 2 assuming that antagonist1 binds to one site only (Lαδ1=∞) and the antagonist2 binds to the other site only (Lαε2=∞). Each axis give the fractional drug concentration relative to the ICx where x=50, 75, 90 or 95. At low receptor occupancy, ≤IC50, the difference between synergy and additivity is small and may be difficult to determine experimentally. The differences are more pronounced at higher occupancy levels.
We examined nine combinations of antagonists that can be compared to published clinical data (Table 2). Of these, five show qualitative agreement in that the fractional analysis values are significantly less than 1.0 ((+)-tubocurarine/pancuronium, (+)-tubocurarine/vecuronium, vecuronium/cisatracurium, cisatracurium/rocuronium) or essentially equal to 1.0 (atracurium/cisatracurium). Thus, for these five, dissimilar antagonists are synergistic and similar drugs are additive. The remaining four combinations involve structurally similar drugs that are additive in human studies but synergistic in our experiments. One possible explanation is that there are important differences in nAChR behavior between our in vitro preparation and in vivo conditions. Certainly, an outside-out patch of non-muscle membrane containing heterologously expressed receptors provides only a minimalist approximation of the physiological environment of nAChR at the neuromuscular junction. However, the data in Table 1 indicates that there is a very good correlation between the in vivo CE50 and in vitro IC90 values for antagonists. (The IC50 values determined by us are similar to those reported by Jonsson et al (40) for adult human nAChR expressed in oocytes.) One difference between the two conditions is temperature. We have found that increasing temperature from 25°C to 37°C decreases the affinity of embryonic mouse muscle nAChR for antagonists by a factor of 1.7−1.9, but increases the association and dissociation rates by 2−5-fold and this is antagonist-dependent (41). The effect of temperature on synergy is unknown. Alternatively, the muscle nAChR may not be the only molecular actor that participates in muscle relaxant synergy. In addition, there are neuronal nAChRs (42) and purinergic receptors (43,44) that may modulate activity at the neuromuscular junction.
A commonly invoked explanation for muscle relaxant synergy involves the role of presynaptic neuronal nAChRs (16). These receptors are thought to provide a positive feedback mechanism for vesicular ACh release by prolonging nerve terminal depolarization and increasing intracellular calcium (42). (However, there is also evidence for a presynaptic negative feedback mechanism (45)). In this explanation, synergy results if one antagonist acts primarily on the postsynaptic nAChR and the other acts on the presynaptic nAChR. There are several lines of evidence that argue against such a scenario. a) The correlation between clinical and experimental concentrations of antagonists (Table 1) suggests that all of the muscle relaxants produce a similar inhibition of muscle nAChRs at clinical concentrations. b) Muscle relaxants are much less potent on human neuronal nAChR subtypes (including α3β2, the subtype found on mouse motor neurons (46)) than they are on human muscle nAChR (40). Based on this data, the calculated inhibition of α3β2 nAChR at in vivo CE50 concentrations is 3% (pancuronium), 5% (cisatracurium), 7% (vecuronium), 12% ((+)-tubocurarine) and 22% (rocuronium). Because the inhibition of muscle nAChR is already ≥90% at CE50 concentrations (Table 1), it is not clear how inhibition of presynaptic receptors could make a substantial contribution. c) Inhibition of the presynaptic feedback mechanism might possibly produce the phenomenon of fade during repetitive stimuli (42), but it is unlikely to affect the twitch response to a single stimulus.
Experiments with nAChR mutants must be interpreted carefully. The lack of an effect by a mutation does not eliminate that site or subunit as a possible antagonist binding site. The presence of an effect by a mutation is good, but not conclusive, evidence that the site is important for binding. There is always the possibility of large-scale structural rearrangement of the protein due the mutation. In our experiments, all of the functional mutations decreased inhibition by antagonists; thus, the mutations did not create new binding sites, but decreased affinity for existing sites. However, the data obtained with mutant receptors (Fig. 6) do not completely clarify the molecular origins of antagonist synergy. For example, we found the combination of (+)-tubocurarine and pancuronium to be highly synergistic. The isobologram in Fig. 3D assumes that the two antagonists are highly selective (≥100:1) for opposite binding sites. The mutation data suggests, though, that pancuronium has a significant affinity for both sites. Similarly, vecuronium and pancuronium show a high degree of synergy (Fig. 5A) and yet both are affected by a mutation on the δ-subunit. And, most surprisingly, (+)-tubocurarine and metocurine, which both have high affinity for the α-ε interface, show synergistic effects in our experiments. One possible explanation is that antagonist binding to one site is accompanied by a conformational change in the nAChR that affects the affinity of the other site. There is evidence to suggest that this may be the case (26,41).
In summary, we found that several combinations of competitive antagonists for human adult muscle AChR show evidence for synergy when tested at high receptor occupancy. The negative results reported in a previous attempt to measure synergy in vitro (16) may have arisen from the use of lower concentrations of antagonists. Our findings, however, could not be interpreted in terms of a scheme in which antagonists had preferential binding for one of the two ligand binding sites on the nAChR (Fig 1). We suggest that conformational changes induced by antagonist binding may contribute to synergistic effects. Some of our findings correlate with clinical measures of synergy in humans, but others do not. We suggest that temperature differences may be important. Alternatively, proteins found at the neuromuscular junction, but not included in our outside-out patches, may play a role.
Acknowledgments
Financial support: This work was supported by National Institutes of Health grant NS 045095 and by the Department of Anesthesiology, Stony Brook University
Footnotes
Disclaimers:
None
Conflict of Interest:
None.
Implications Statement:
Synergistic interactions among pairs of nondepolarizing muscle relaxants were first described over 25 years ago but a molecular explanation for this has been elusive. Here, we provide evidence that synergy can exist at the level of the adult human muscle nicotinic acetylcholine receptor. This is probably not the complete explanation, but it represents a large step forward.
References
- 1.Booij LH, Vree TB. Skeletal muscle relaxants: pharmacodynamics and pharmacokinetics in different patient groups. International journal of clinical practice. 2000;54:526–34. [PubMed] [Google Scholar]
- 2.Lebowitz PW, Ramsey FM, Savarese JJ, Ali HH. Potentiation of neuromuscular blockade in man produced by combinations of pancuronium and metocurine or pancuronium and d-tubocurarine. Anesth Analg. 1980;59:604–9. [PubMed] [Google Scholar]
- 3.Ferres CJ, Mirakhur RK, Pandit SK, Clarke RSJ, Gibson FM. Dose-response studies with pancuronium, vecuronium and their combination. Br J Clin Pharmac. 1984;18:1127–30. doi: 10.1111/j.1365-2125.1984.tb02568.x. [DOI] [PMC free article] [PubMed] [Google Scholar]
- 4.Mirakhur RK, Gibson FM, Ferres CJ. Vecuronium and d-tubocurarine combination: potentiation of effect. Anesth Analg. 1985;64(7):711–4. [PubMed] [Google Scholar]
- 5.Rashkovsky OM, Agoston S, Ket JM. Interaction between pancuronium bromide and vecuronium bromide. Br J Anaesth. 1985;57:1063–6. doi: 10.1093/bja/57.11.1063. [DOI] [PubMed] [Google Scholar]
- 6.Pollard BJ, Jones RM. Interactions between tubocurarine, pancuronium and alcuronium demonstrated in the rat phrenic nerve-hemidiaphragm preparation. Br J Anaesth. 1983;55:1127–31. doi: 10.1093/bja/55.11.1127. [DOI] [PubMed] [Google Scholar]
- 7.Waud BE, Waud DR. Quantitative examination of the interaction of competitive neuromuscular blocking agents on the indirectly elicited muscle twitch. Anesthesiology. 1984;61:420–7. doi: 10.1097/00000542-198410000-00010. [DOI] [PubMed] [Google Scholar]
- 8.Booij LH, van Egmond J, van de Pol F, Crul JF. Pharmacodynamics of vecuronium, atracurium, tubocurarine and their combinations in the rat in vivo. European journal of anaesthesiology. 1985;2:279–84. [PubMed] [Google Scholar]
- 9.Waud BE, Waud DR. Interaction among agents that block end-plate depolarization competitively. Anesthesiology. 1985;63:4–15. doi: 10.1097/00000542-198507000-00002. [DOI] [PubMed] [Google Scholar]
- 10.Wang HL, Milone M, Ohno K, Shen XM, Tsujino A, Batocchi AP, Tonali P, Brengman J, Engel AG, Sine SM. Acetylcholine receptor M3 domain: stereochemical and volume contributions to channel gating. Nat Neurosci. 1999;2:226–33. doi: 10.1038/6326. [DOI] [PubMed] [Google Scholar]
- 11.Wang HL, Gao F, Bren N, Sine SM. Curariform antagonists bind in different orientations to the nicotinic receptor ligand binding domain. J Biol Chem. 2003;278:32284–91. doi: 10.1074/jbc.M304366200. [DOI] [PubMed] [Google Scholar]
- 12.Sine SM. Molecular dissection of subunit interfaces in the acetylcholine receptor: Identification of residues that determine curare selectivity. Proc Natl Acad Sci USA. 1993;90:9436–40. doi: 10.1073/pnas.90.20.9436. [DOI] [PMC free article] [PubMed] [Google Scholar]
- 13.Bren N, Sine SM. Identification of residues in the adult nicotinic acetylcholine receptor that confer selectivity for curariform antagonists. J Biol Chem. 1997;272:30793–8. doi: 10.1074/jbc.272.49.30793. [DOI] [PubMed] [Google Scholar]
- 14.Fletcher GH, Steinbach JH. Ability of nondepolarizing neuromuscular blocking drugs to act as partial agonists at fetal and adult mouse muscle nicotinic receptors. Mol Pharmacol. 1996;49:938–47. [PubMed] [Google Scholar]
- 15.Dilger JP, Vidal AM, Liu M, Mettewie C, Suzuki T, Pham A, Demazumder D. Roles of Amino Acids and Subunits in Determining the Inhibition of Nicotinic Acetylcholine Receptors by Competitive Antagonists. Anesthesiology. 2007;106:1186–95. doi: 10.1097/01.anes.0000267602.94516.7f. [DOI] [PMC free article] [PubMed] [Google Scholar]
- 16.Paul M, Kindler CH, Fokt RM, Dipp NCJ, Yost CS. Isobolographic analysis of non-depolarising muscle relaxant interactions at their receptor site. Eur J Pharmacol. 2002;438:35–43. doi: 10.1016/s0014-2999(02)01271-2. [DOI] [PubMed] [Google Scholar]
- 17.Nigrovic V, Amann A. Simulation of interaction between two non-depolarizing muscle relaxants: generation of an additive or a supra-additive neuromuscular block. J Pharmacokinet Pharmacodyn. 2004;31:157–79. doi: 10.1023/b:jopa.0000034406.00667.20. [DOI] [PubMed] [Google Scholar]
- 18.Paton WD, Waud DR. The margin of safety of neuromuscular transmission. J Physiol. 1967;191:59–90. doi: 10.1113/jphysiol.1967.sp008237. [DOI] [PMC free article] [PubMed] [Google Scholar]
- 19.Ruff RL. Sodium channel slow inactivation and the distribution of sodium channels on skeletal muscle fibres enable the performance properties of different skeletal muscle fibre types. Acta Physiol Scand. 1996;156:159–68. doi: 10.1046/j.1365-201X.1996.189000.x. [DOI] [PubMed] [Google Scholar]
- 20.Wood SJ, Slater CR. Safety factor at the neuromuscular junction. Prog Neurobiol. 2001;64:393–429. doi: 10.1016/s0301-0082(00)00055-1. [DOI] [PubMed] [Google Scholar]
- 21.Waud BE, Waud DR. The margin of safety of neuromuscular transmission in the muscle of the diaphragm. Anesthesiology. 1972;37:417–22. doi: 10.1097/00000542-197210000-00012. [DOI] [PubMed] [Google Scholar]
- 22.Bigland-Ritchie B, Kukulka CG, Lippold OCJ, Woods JJ. The absence of neuromuscular transmission failure in sustained maximal voluntary contractions. J Physiol. 1982;330:265–78. doi: 10.1113/jphysiol.1982.sp014340. [DOI] [PMC free article] [PubMed] [Google Scholar]
- 23.Ohno K, Wang HL, Milone M, Bren N, Brengman JM, Nakano S, Quiram P, Pruitt JN, Sine SM, Engel AG. Congenital myasthenic syndrome caused by decreased agonist binding affinity due to a mutation in the acetylcholine receptor epsilon subunit. Neuron. 1996;17:157–70. doi: 10.1016/s0896-6273(00)80289-5. [DOI] [PubMed] [Google Scholar]
- 24.Jurman ME, Boland LM, Liu Y, Yellen G. Visual identification of individual transfected cells for electrophysiology using antibody-coated beads. Biotechniques. 1994;17(5):876–81. [PubMed] [Google Scholar]
- 25.Wenningmann I, Dilger JP. The kinetics of inhibition of nicotinic acetylcholine receptors by (+)-tubocurarine and pancuronium. Mol Pharmacol. 2001;60:790–6. [PubMed] [Google Scholar]
- 26.Demazumder D, Dilger JP. The kinetics of competitive antagonism by cisatracurium of embryonic and adult nicotinic acetylcholine receptors. Mol Pharmacol. 2001;60:797–807. [PubMed] [Google Scholar]
- 27.King H. Curare alkaloids. Part I. Tubocurarine. J Chem Soc. 1935;57:1381–9. [Google Scholar]
- 28.Hamill OP, Sakmann B. Multiple conductance states of single acetylcholine receptor channels in embryonic muscle cells. Nature. 1981;294:462–4. doi: 10.1038/294462a0. [DOI] [PubMed] [Google Scholar]
- 29.Liu Y, Dilger JP. Opening rate of acetylcholine receptor channels. Biophys J. 1991;60:424–32. doi: 10.1016/S0006-3495(91)82068-9. [DOI] [PMC free article] [PubMed] [Google Scholar]
- 30.Berenbaum MC. What is synergy? pharmacol Rev. 1989;41:93–141. [PubMed] [Google Scholar]
- 31.Navuib M, Samarkandi A, Ammar A, Turkistani A. Comparative clinical pharmacology of rocuronium, cisatracurium and their combination. Anesthesiology. 1998;89:1116–24. doi: 10.1097/00000542-199811000-00011. [DOI] [PubMed] [Google Scholar]
- 32.Naguib M, Lien C. In: Pharmacology of Muscle Relaxants and their Antagonists. Miller RD, editor. Miller's Anesthesia Edinburgh, UK; Churchill Livingstone: 2005. pp. 481–572. [Google Scholar]
- 33.Roy JJ, Varin F. Physicochemical properties of neuromuscular blocking agents and their impact on the pharmacokinetic-pharmacodynamic relationship. Br J Anaesth. 2004;93:241–8. doi: 10.1093/bja/aeh181. [DOI] [PubMed] [Google Scholar]
- 34.Martin M, Czajkowski C, Karlin A. The contributions of aspartyl residues in the acetylcholine receptor gamma and delta subunits to the binding of agonists and competitive antagonists. J Biol Chem. 1996;271:13497–503. doi: 10.1074/jbc.271.23.13497. [DOI] [PubMed] [Google Scholar]
- 35.Kim KS, Chun YS, Chon SU, Suh JK. Neuromuscular interaction between cisatracurium and mivacurium, atracurium, vecuronium or rocuronium administered in combination. Anaesthesia. 1998;53:872–8. doi: 10.1046/j.1365-2044.1998.00492.x. [DOI] [PubMed] [Google Scholar]
- 36.Naguib M, Samarkandi AH, Bakhamees HS, Magboul MA, El-Bakry AK. Comparative potency of steroidal neuromuscular blocking drugs and isobolographic analysis of the interaction between rocuronium and other aminosteroids. Br J Anaesth. 1995;75:37–42. doi: 10.1093/bja/75.1.37. [DOI] [PubMed] [Google Scholar]
- 37.Rautoma P, Erkola O, Meretoja OA. Potency and maintenance requirement of atracurium and vecuronium given alone or together. Acta Anaesthesiol Scand. 1995;39:220–3. doi: 10.1111/j.1399-6576.1995.tb04047.x. [DOI] [PubMed] [Google Scholar]
- 38.Motamed C, Kirov K, Combes X, Feiss P, Duvaldestin P. Interaction between mivacurium and pancuronium: impact of the order of administration. European journal of clinical pharmacology. 2005;61:175–7. doi: 10.1007/s00228-005-0905-x. [DOI] [PubMed] [Google Scholar]
- 39.Waud BE, Waud DR. Muscle relaxant interactions. In: Agoston S, Bowman WC, editors. Muscle Relaxants. 2nd ed Amsterdam; Elsivier: 1990. pp. 231–43. [Google Scholar]
- 40.Jonsson M, Gurley D, Dabrowski M, Larsson O, Johnson EC, Eriksson LI. Distinct pharmacologic properties of neuromuscular blocking agents on human neuronal nicotinic acetylcholine receptors. Anesthesiology. 2006;105:521–33. doi: 10.1097/00000542-200609000-00016. [DOI] [PubMed] [Google Scholar]
- 41.Demazumder D, Dilger JP. The kinetics of competitive antagonism of nicotinic acetylcholine receptors at physiological temperature. J Physiol. 2008;586:951–63. doi: 10.1113/jphysiol.2007.143289. [DOI] [PMC free article] [PubMed] [Google Scholar]
- 42.Bowman WC. In: Prejunctional mechanisms involved in neuromuscular transmission. Booij LH, editor. Neuromuscular Transmission; Wiley: 1996. pp. 1–27. [Google Scholar]
- 43.Redman RS, Silinsky EM. ATP released together with acetylcholine as the mediator of neuromuscular depression at frog motor nerve endings. J Physiol. 1994;477(Pt 1):117–27. doi: 10.1113/jphysiol.1994.sp020176. [DOI] [PMC free article] [PubMed] [Google Scholar]
- 44.Shakirzyanova AV, Bukharaeva EA, Nikolsky EE, Giniatullin RA. Negative cross-talk between presynaptic adenosine and acetylcholine receptors. Eur J Neurosci. 2006;24:105–15. doi: 10.1111/j.1460-9568.2006.04884.x. [DOI] [PubMed] [Google Scholar]
- 45.Tian L, Prior C, Dempster J, Marshall IG. Nicotinic antagonist-produced frequency-dependent changes in acetylcholine release from rat motor nerve terminals. J Physiol. 1994;476:517–29. doi: 10.1113/jphysiol.1994.sp020151. [DOI] [PMC free article] [PubMed] [Google Scholar]
- 46.Tsuneki H, Kimura I, Dezaki K, Kimura M, Sala C, Fumagalli G. Immunohistochemical localization of neuronal nicotinic receptor subtypes at the pre- and postjunctional sites in mouse diaphragm muscle. Neurosci Lett. 1995;196:13–6. doi: 10.1016/0304-3940(95)11824-g. [DOI] [PubMed] [Google Scholar]