

Abstract
Trafficking of water channel aquaporin-2 (AQP2) to the apical membrane and its vasopressin and protein kinase A (PKA)–dependent regulation in renal collecting ducts is critical for body water homeostasis. We previously identified an AQP2 binding protein complex including actin and tropomyosin-5b (TM5b). We show that dynamic interactions between AQP2 and the actin cytoskeleton are critical for initiating AQP2 apical targeting. Specific binding of AQP2 to G-actin in reconstituted liposomes is negatively regulated by PKA phosphorylation. Dual color fluorescence cross-correlation spectroscopy reveals local AQP2 interaction with G-actin in live epithelial cells at single-molecule resolution. Cyclic adenosine monophosphate signaling and AQP2 phosphorylation release AQP2 from G-actin. In turn, AQP2 phosphorylation increases its affinity to TM5b, resulting in reduction of TM5b bound to F-actin, subsequently inducing F-actin destabilization. RNA interference–mediated knockdown and overexpression of TM5b confirm its inhibitory role in apical trafficking of AQP2. These findings indicate a novel mechanism of channel protein trafficking, in which the channel protein itself critically regulates local actin reorganization to initiate its movement.
Introduction
Body water homeostasis is essential for the survival of mammals and is regulated by the renal collecting duct. Key components in the regulation of collecting duct water permeability are the vasopressin receptor and water channel aquaporin-2 (AQP2; Fushimi et al., 1993; Nielsen et al., 2002; Brown, 2003; Valenti et al., 2005; Noda and Sasaki, 2006). The binding of the antidiuretic hormone vasopressin to vasopressin V2 receptors on renal principal cells stimulates cAMP synthesis via activation of adenylate cyclase. The subsequent activation of PKA leads to phosphorylation of AQP2 at serine 256, and this phosphorylation event is required to increase the water permeability and water reabsorption of renal principal cells. In this process, subapical storage vesicles in principal cells containing AQP2 translocate to and fuse with the apical plasma membrane, rendering the cell water permeable. Upon removal of vasopressin, AQP2 is internalized by endocytosis into storage vesicles, and this restores the water-impermeable state of the cell. AQP2 mutations cause congenital NDI (nephrogenic diabetes insipidus), a disease characterized by a massive loss of water through the kidney (Nielsen et al., 2002; Valenti et al., 2005; Noda and Sasaki, 2006). Although many advances have been made in identifying the signal transduction pathway involved in AQP2 trafficking, the precise biophysical mechanisms that AQP2 phosphorylation provides the force driving AQP2 movement remain unclear. Recently, we have discovered an AQP2 binding protein complex, which includes actin and tropomyosin-5b (TM5b; Noda et al., 2004a, 2005; Noda and Sasaki, 2006). TM5b is expressed in high levels in the kidney and localized in the apical and basolateral cell cortices in epithelial cells (Temm-Grove et al., 1996, 1998; Perry, 2001). TM5b is the only isoform that binds to AQP2 and has the most effective actin-stabilizing ability among the TM family (Kostyukova and Hitchcock-DeGregori, 2004; Noda et al., 2005). Because these findings raise the possibility of critical involvement of TM5b in AQP2 trafficking, there may be changes in the interactions among AQP2, actin, and TM5b that alter actin organization in a restricted area around AQP2 for initiating its trafficking. Therefore, we directly measured the real-time interaction dynamics at the single molecule level using dual color fluorescence cross-correlation spectroscopy (FCCS) in live cells. In this paper, we show that AQP2 itself critically regulates local actin reorganization to initiate its movement by phosphorylation-dependent reciprocal interaction between G-actin and TM5b.
Results
AQP2 reconstituted in liposomes specifically binds to G-actin and PKA phosphorylation decreases the binding affinity
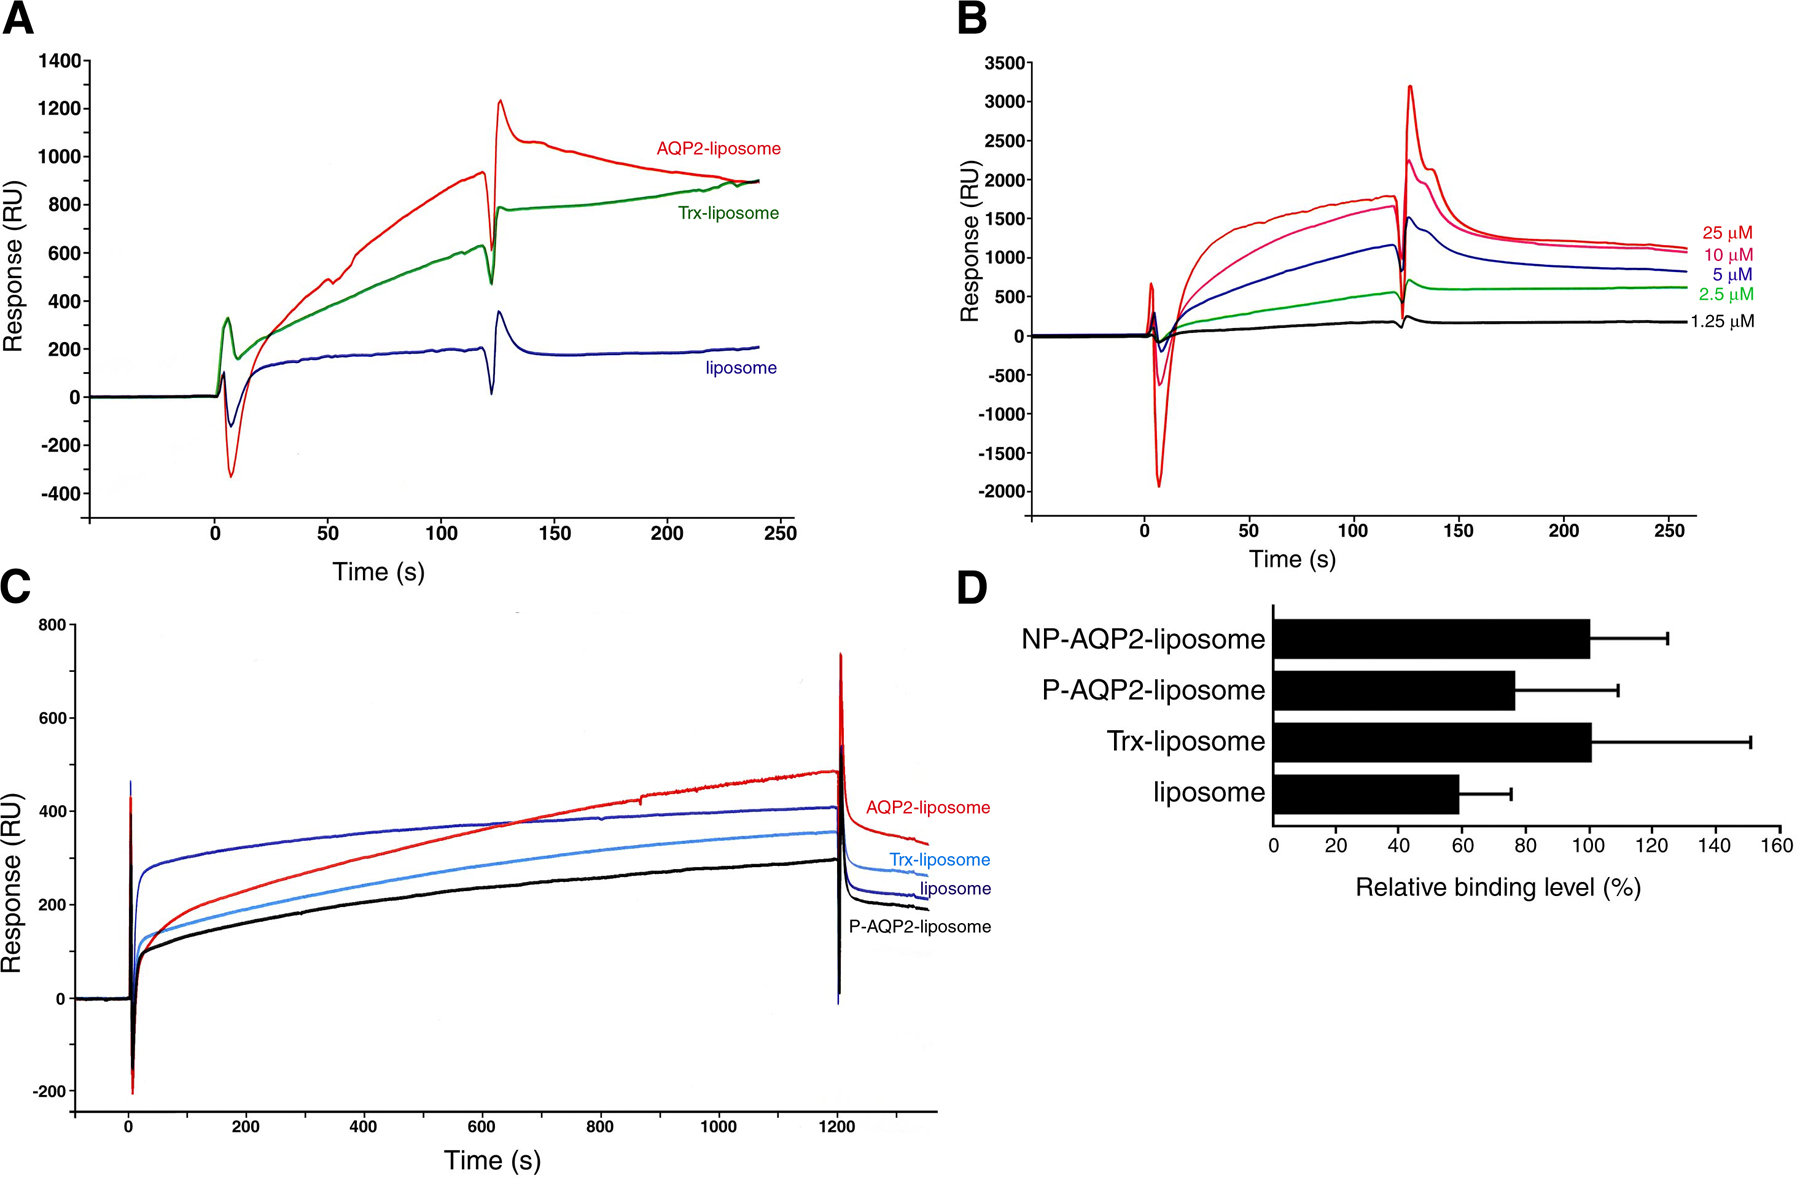
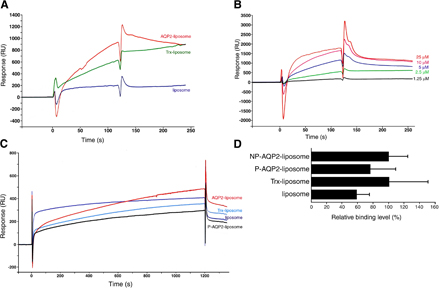
We examined whether AQP2 phosphorylation itself altered its binding properties to actin by surface plasmon resonance (SPR) experiments (Fig. 1). For this purpose, we performed large-scale expression of full-length recombinant human AQP2 fused to thioredoxin (Trx), purification, and reconstitution in proteoliposomes and subjected it to in vitro PKA phosphorylation (Fig. 1, A and B). AQP2 reconstituted in liposomes was used as an injected analyte in SPR experiments to maintain native conformation. Proteins that were not reconstituted in liposomes were removed by fractionating on a density step gradient (Fig. 1 A), and the unilamellar proteoliposomes were obtained by extruding through filters with 100-nm pores. The binding of AQP2 liposomes to G-actin increased in a concentration-dependent manner and was significantly greater than that of the control substances, which were Trx liposomes (Trx-incorporated liposomes) and liposomes without protein incorporation (Fig. 1, C and D). These findings indicate that G-actin binds specifically to AQP2 liposomes. PKA phosphorylation of AQP2 significantly decreased the binding of AQP2 liposomes to G-actin (Fig. 1, E and F). In contrast, when F-actin was linked to a sensor chip, there were no significant differences between control liposomes and AQP2 liposomes with or without phosphorylation, indicating that the interaction of F-actin with AQP2 liposomes was not specific (Fig. S1, available at http://www.jcb.org/cgi/content/full/jcb.200709177/DC1).
Figure 1.

AQP2 reconstituted in liposomes specifically binds to G-actin, and PKA phosphorylation decreases the binding affinity. (A) Reconstitution of full-length human AQP2 fused to Trx (AQP2/Trx; top) or Trx (bottom) in liposomes. The samples were fractionated on OptiPrep step gradients, separated by SDS-PAGE, and stained with Coomassie Blue. OptiPrep concentration in each fraction was the following: f1, 0%; f2, 0–30% interface; f3, 30%; and f4, 40%. Proteoliposomes exist in 0–30% OptiPrep interface. (B) In vitro phosphorylation of AQP2 reconstituted in liposomes by PKA. AQP2 liposomes phosphorylated or not were immunoblotted using antiphosphoserine antibodies. (C) Specificity of the binding of AQP2 liposomes to G-actin measured by SPR analysis. Red, AQP2 liposome; green, Trx liposome; blue, liposome without protein incorporation. Lipid concentration of all injected analytes was 1 mM. Protein concentration of injected analytes of AQP2 liposome and Trx liposome was 5 μM. (D) Dose-dependent binding of AQP2 liposomes to G-actin. SPR sensorgrams obtained with various AQP2 protein concentrations of AQP2 liposome. (E) SPR sensorgrams of the binding to G-actin. Red, nonphosphorylated AQP2 liposome; black, phosphorylated AQP2 liposome (P-AQP2); light blue, Trx liposome; dark blue, liposome without protein incorporation. (F) Relative binding of proteoliposomes to G-actin. The maximal values of binding at the end of the 1,200-s injection are expressed as percentages of nonphosphorylated AQP2 liposome. Data represent the mean and SE from three independent experiments using different chips and different proteoliposome preparations. *, P < 0.05; **, P < 0.01.
Local interaction dynamics of AQP2 with G-actin
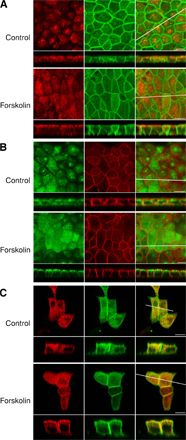
We then examined actin localization during AQP2 trafficking using MDCK cells expressing AQP2 (MDCK/AQP2; Fig. S2, A and B, available at http://www.jcb.org/cgi/content/full/jcb.200709177/DC1; Asai et al., 2003; Noda et al., 2004b; Tajika et al., 2005). Under control conditions, AQP2 was predominantly localized in the subapical region, whereas treatment with forskolin, an activator of adenylate cyclase mimicking vasopressin action, induced the translocation of AQP2 to the apical membrane as observed in the kidney (Noda and Sasaki, 2006). Within the resolution limit of the fluorescence microscope, forskolin did not induce significant changes in either the distribution of G-actin or F-actin, although there was a tendency for a decrease in F-actin in the subapical region and near the base of the cells. In the process of AQP2 translocation, the actin dynamics may change in a restricted narrow area around the AQP2 molecule (Noda and Sasaki, 2006). To examine the spatial and temporal interactions of AQP2 with G-actin at the single molecule level in live cells, fluorescence correlation spectroscopy (FCS) and FCCS were performed in MDCK cells expressing DsRed-AQP2 and GFP-actin. In these cells, forskolin stimulation induced DsRed-AQP2 translocation from intracellular vesicles to the plasma membrane (Fig. S2 C). FCCS is an extended technique of FCS and enables the tracing of two spectrally distinct fluorophores, providing the kinetics of molecular interactions at a specific position in a live cell (Saito et al., 2004; Baudendistel et al., 2005; Bacia et al., 2006; Kitamura et al., 2006; Kogure et al., 2006). Because FCCS probes fluorescently labeled molecules at low concentrations, FCCS provides an advantage for studying molecular interactions with minimal disturbance of the natural state in living cells. Furthermore, FCS and FCCS are able to assess G-actin alone because these measurements are well suited for fast processes occurring in microseconds to milliseconds of transition in the observation area, and the much slower diffusion of large molecule and immobile molecule such as F-actin are not assessed by these methods. Therefore, to examine AQP2 interaction with G-actin, FCS and FCCS measurements were performed at successive time points and at different positions in the same live cell through the AQP2 trafficking pathway.
We positioned the FCS focus either in the subapical region or on the apical membrane in a cell because AQP2 trafficking occurs from the subapical storage vesicles to the apical membrane. FCS focus positioning was determined by laser scanning microscopy imaging (Pack et al., 2006). The diffusion coefficient of AQP2 on the apical membrane was significantly decreased compared with that in the subapical region (Fig. S3 E, available at http://www.jcb.org/cgi/content/full/jcb.200709177/DC1), indicating that this protocol was able to discriminate the focus position on the apical membrane from that in the subapical region.
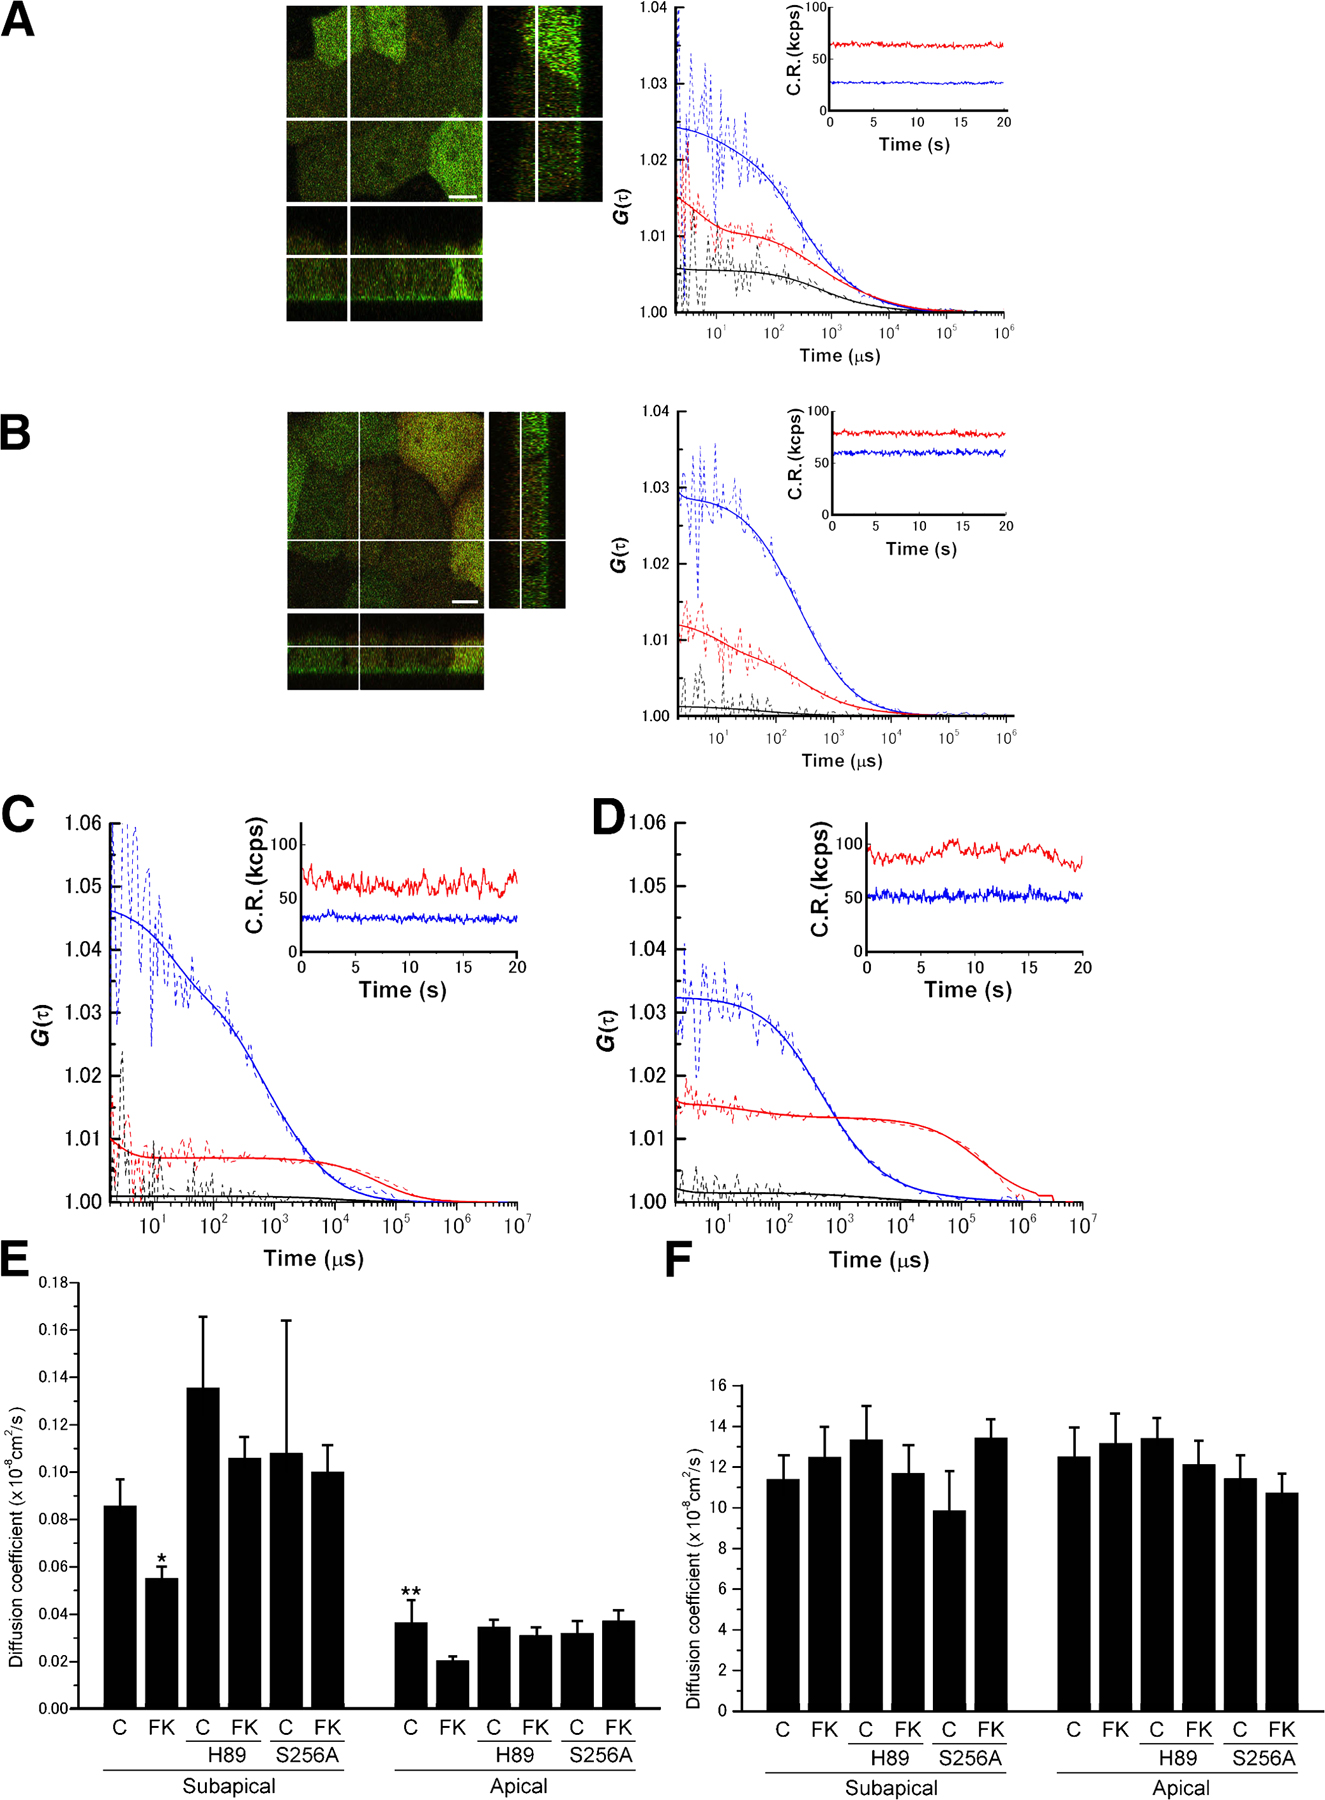
FCS and FCCS were performed at the position in the subapical region indicated by Fig. 2 A and at the position on the apical membrane indicated by Fig. 2 D in the same cell. As shown in Fig. 2 (B and E), the fluorescence fluctuations of DsRed-AQP2 and GFP-actin gave rise to cross-correlation signal at both positions. Relative cross-correlation amplitude ([Gc(0)-1]/[Gr(0)-1]) was 0.4 ± 0.04 in the subapical region and 0.33 ± 0.02 on the apical membrane. This finding indicates that AQP2 interacts with actin both in the subapical region and on the apical membrane in the live cell. The cell was then treated with forskolin and the FCCS measurement was continued at the same positions. Forskolin stimulation for 10 min significantly decreased the cross-correlation signal both in the subapical region and on the apical membrane (Fig. 2, C, F, and G; and Fig. S3, C and D), indicating dissociation of AQP2 from actin. In addition, forskolin treatment slowed AQP2 mobility both in the subapical region and on the apical membrane; however, only the effect in the subapical region was significant (Fig. S3 E). In actin mobility, no significant changes were observed with forskolin treatment (Fig. S3 F). The reason may be that FCS assesses the mobility of G-actin alone and is not able to assess changes in the F-actin/G-actin ratio or actin polymerization.
Figure 2.

FCS and FCCS analyses in live cells expressing DsRed-AQP2 and GFP-actin. (A and D) The crosshair indicates the measurement position: A, subapical region; D, apical membrane. Images for GFP-actin (green) and DsRed-AQP2 (red) were overlayed. In all images, the orthogonal z-stack profiles along the indicated lines in the x or y dimension of the central xy image are shown in the rectangular windows at the bottom (xz) and to the right (yz) of the central image. Bars, 5 μm. (B and E) FCCS analysis in the subapical region (B) and the apical membrane (E). Autocorrelation curves at the positions indicated in the images above are shown. Blue lines correspond to GFP-actin signal, red lines correspond to DsRed-AQP2 signal, and black lines are cross-correlation curves. The dashed lines are measured curves and the solid lines are their fitted curves. Insets show the fluorescence intensities of DsRed-AQP2 and GFP-actin in the two respective channels during an FCCS measurement. CR, count rates. (C and F) Cross-correlation curves before (Before FK) and after (After FK) forskolin stimulation. (G) Summary of relative cross-correlation amplitude ([Gc(0)-1]/[Gr(0)-1]). C, control; FK, forskolin treatment; H89, H89-pretreated cells expressing DsRed-AQP2 and GFP-actin; S256A, cells expressing DsRed-S256A-AQP2 and GFP-actin; subapical, measurements in the subapical region; apical, measurements on the apical membrane. Data represent the mean and SE from at least five independent experiments. *, P < 0.001 compared with the values before forskolin stimulation.
A PKA inhibitor H89 abolishes AQP2 translocation to the apical membrane (Noda et al., 2004b; Noda and Sasaki, 2006). The cross-correlation signal of cells pretreated with H89 was similar to that without H89 (Fig. 2 G). Forskolin stimulation did not significantly decrease the cross correlation signal in the H89-pretreated cells. This finding indicates that the dissociation of actin from AQP2 is mediated by cAMP-dependent signaling.
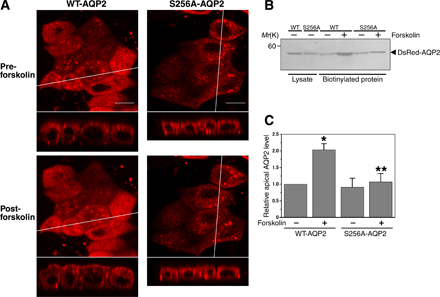
Phosphorylation of AQP2 at serine 256 is known to be essential for AQP2 trafficking to the apical membrane. In addition, H89 is reported to abolish the increase of AQP2 phosphorylation induced by forskolin (Valenti et al., 2000). To determine whether phosphorylation at serine 256 of AQP2 is required for the dissociation of actin from AQP2, the mutant S256A-AQP2, which mimics nonphosphorylated AQP2 (Kamsteeg et al., 2000), was generated, fused with DsRed, and expressed in MDCK cells. Forskolin did not increase S256A-AQP2 on the cell surface (Fig. S4, available at http://www.jcb.org/cgi/content/full/jcb.200709177/DC1). The amount of S256A-AQP2 on the apical membrane with or without forskolin was similar to wild-type (WT) AQP2 under baseline conditions. Consistent with the previous reports (Lu et al., 2004), this finding indicates that the constitutive recycling pathway under baseline conditions is not dependent on phosphorylation at the serine 256 residue in AQP2. S256A-AQP2 mobility was similar to that of WT-AQP2 (Fig. S3 E). The cross-correlation signal of S256A-AQP2 and actin was similar to that of WT-AQP2 and actin (Fig. 2 G). However, unlike WT-AQP2, forskolin treatment did not significantly decrease the cross-correlation signal. These findings indicate that AQP2 phosphorylation at serine 256 is required for the dissociation of actin from AQP2.
AQP2 phosphorylation induces actin depolymerization by inhibiting TM5b function
From these results, we have speculated that AQP2 directly regulates actin organization to initiate AQP2 trafficking because many actin binding proteins exhibit the ability to regulate actin dynamics. To test whether AQP2 has actin-regulating functions, we performed fluorescence-based pyrene-actin assays using AQP2 reconstituted in liposomes added with the vesicle-free fraction of rat kidney papillae extracts (Fig. 3, A and B). There were no significant differences among nonphosphorylated AQP2 liposomes, Trx liposomes, and liposomes in the effects on actin disassembly. In contrast, phosphorylated AQP2 liposomes significantly increased depolymerization of F-actin compared with nonphosphorylated AQP2 liposomes and the controls. This finding indicates that PKA phosphorylation of AQP2 promotes actin depolymerization. We previously reported that AQP2 bound to TM5b (Noda et al., 2005), which is known to regulate actin stability (Kostyukova and Hitchcock-DeGregori, 2004). We have speculated that AQP2 phosphorylation may regulate the effect of TM5b on actin organization. Because TM5b inhibits depolymerization at the pointed end of actin filaments (Kostyukova and Hitchcock-DeGregori, 2004), we performed pyrene-actin assays using barbed-end blocked actin filaments, recombinant TM5b, and AQP2 reconstituted in liposomes (Fig. 3, C and D). In the absence of TM5b, AQP2 liposomes did not have effects on actin assembly. TM5b without liposomes inhibited the rate of pointed end depolymerization. TM5b with Trx liposomes and liposomes without protein incorporation also inhibited the depolymerization. When nonphosphorylated AQP2 liposomes were incubated, there was a tendency for a decrease in the inhibitory effect of TM5b on depolymerization, although the changes were not significant. When phosphorylated AQP2 liposomes were incubated, the inhibitory effect of TM5b on depolymerization was significantly decreased. The actin-depolymerizing effect of phosphorylated AQP2 liposomes was significantly greater than that of nonphosphorylated AQP2 liposomes. These findings indicate that AQP2 phosphorylation inhibits the actin-stabilizing effect of TM5b, resulting in actin depolymerization.
Figure 3.

AQP2 phosphorylation inhibits the actin-stabilizing effect of TM5b, resulting in actin depolymerization. (A and B) Pyrene-actin assay using the vesicle-free fraction of rat kidney papillae extracts. (A) Actin depolymerization was monitored by the decrease in pyrene fluorescence and normalized to the initial fluorescence value in each experiment. (B) Summary of pyrene fluorescence at 600 s. Data represent the mean and SE from three independent experiments. *, P < 0.01 versus nonphosphorylated AQP2 liposomes. (C and D) Pyrene-actin assay with barbed-end blocked actin filaments, TM5b, and AQP2 reconstituted in liposomes. (C) Depolymerization curves normalized to the initial fluorescence value in each experiment. (D) Summary of pyrene fluorescence at 600 s. Data represent the mean and SE from three independent experiments. *, P < 0.01 versus actin + TM5b; **, P < 0.05 versus AQP2 liposome + actin + TM5b.
AQP2 phosphorylation sequesters TM5b from F-actin
Because AQP2 binds to TM5b, AQP2 phosphorylation may regulate the interaction of TM5b with F-actin. Therefore, cosedimentation assays with TM5b, F-actin, and AQP2 reconstituted in liposomes were performed (Fig. 4). TM5b alone was located in low-density fractions 1–4 (Fig. 4 A). AQP2 liposomes were located in fractions 12–13 (Fig. 4 G). The profile of F-actin was relatively wide (Fig. 4 F), which is consistent with the previous study (Hopkins et al., 2004). When TM5b was incubated with F-actin and liposomes without protein incorporation, TM5b was observed in fractions 1–6 and 11–13 where F-actin was present, indicating the association of TM5b with F-actin (Fig. 4 B). Trx liposomes did not change the TM5b profiles compared with liposomes without protein incorporation (Fig. 4 C). When TM5b was incubated with F-actin and nonphosphorylated AQP2 liposomes, there was a tendency for an increase in TM5b in fractions 12–13, where AQP2 liposomes were present, although the changes were not significant (Fig. 4 D). When TM5b was incubated with F-actin and phosphorylated AQP2 liposomes, TM5b in fractions 12–13 was significantly increased, whereas it was significantly decreased in fractions 1–6 (Fig. 4, E and H). These findings indicate that AQP2 phosphorylation increases AQP2 association with TM5b and dissociates TM5b from F-actin.
Figure 4.

Cosedimentation assay with recombinant TM5b, F-actin, and AQP2 reconstituted in liposomes. (A) TM5b alone. (B) TM5b incubated with F-actin was mixed with liposomes. (C–G) TM5b incubated with F-actin was mixed with liposomes reconstituted with Trx (C), nonphosphorylated AQP2 (D, F, and G), or phosphorylated AQP2 (E). Samples were fractionated on density gradient and immunoblotted for TM5b (A–E), actin (F), or AQP2 (G). Collected fractions were numbered from low (0% OptiPrep) to high (40% OptiPrep) density. (H) Relative densitometric quantification of TM5b in fractions 11–13 to total TM5b. Data represent the mean and SE from three independent experiments. *, P < 0.01 versus nonphosphorylated AQP2 liposome.
To further confirm the reciprocal interaction with G-actin and TM5b, we performed coimmunoprecipitation assays (Fig. 5, A–C). In MDCK cells transfected with WT-AQP2, forskolin stimulation increased total phosphorylated AQP2 and TM5b coimmunoprecipitated with AQP2, but decreased actin coimmunoprecipitated with AQP2. These findings indicate that AQP2 phosphorylation increases AQP2 interaction with TM5b and decreases AQP2 interaction with actin. Next, we examined the role of phosphorylation at the serine 256 residue of AQP2. The mutant S256A-AQP2, which mimics nonphosphorylated AQP2, and S256D-AQP2, which mimics phosphorylated AQP2 (Kamsteeg et al., 2000), were transfected into MDCK cells and coimmunoprecipitation assays were performed. Actin coimmunoprecipitated with S256D-AQP2 was significantly decreased compared with WT-AQP2 and S256A-AQP2. TM5b coimmunoprecipitated with S256D-AQP2 was significantly increased compared with WT-AQP2 and S256A-AQP2. These findings indicate that phosphorylation at the serine 256 residue in AQP2 decreases AQP2 interaction with actin and increases AQP2 interaction with TM5b.
Figure 5.

AQP2 phosphorylation regulates its interaction with actin and TM5b. (A–C) Coimmunoprecipitation analyses of AQP2 with actin and TM5b. The lysates of MDCK cells transfected with WT-AQP2 cDNA, S256A-AQP2, and S256D-AQP2 were immunoprecipitated with anti-AQP2 antibody. The immunoprecipitated band density of phosphorylated AQP2 (A), actin (B), and TM5b (C) was normalized to WT-AQP2–transfected cells without forskolin stimulation. Data represent the mean and SE from three independent experiments. *, P < 0.05 versus WT-AQP2–transfected cells without forskolin stimulation; **, P < 0.05 versus S256A-AQP2–transfected cells. (D–F) Quantification of the immunoprecipitation of AQP2 (D), phosphorylated AQP2 (E), and TM5b (F). MDCK/AQP2 cells were left untreated, stimulated with forskolin (FK), incubated with toxin B, or stimulated with forskolin after preincubation with toxin B. Cell lysates were immunoprecipitated by anti-AQP2 antibody and anti-TM antibody, and the bound and unbound fractions were immunoblotted for AQP2, phosphorylated AQP2, and TM5b. For the quantification of the fraction of AQP2 or phosphorylated AQP2 that bound to TM5b, the bound/input ratio for each protein in the immunoprecipitation by anti-TM5b antibody was normalized for the immunoprecipitation efficiency by dividing by the corresponding bound/input ratio for TM5b. For the quantification of the fraction of TM5b that bound to AQP2, its bound/input ratio in the immunoprecipitation by anti-AQP2 antibody was normalized by dividing by the corresponding bound/input ratio for AQP2. Data represent the mean and SE from three independent experiments. *, P < 0.05 versus untreated cells; **, P < 0.05 versus the cells preincubated with toxin B. (G and H) Determination of the amount of AQP2 (G) and TM5b (H) in MDCK/AQP2 cells and rat kidney papilla using quantitative Western blotting in comparison to a standard curve of each purified recombinant protein. Red squares, recombinant proteins of AQP2 (G) and TM5b (H); green triangles, rat kidney papilla; blue circles, MDCK/AQP2 cells; AU, arbitrary units. Within the linear range of each standard curve, the abundance of AQP2 was determined to be 2.3 ± 1% (wt/wt; mean ± SE) of total protein in MDCK cells and 0.24 ± 0.044% in kidney papilla. The abundance of TM5b was determined to be 0.15 ± 0.022% in MDCK cells and 0.093 ± 0.012% in kidney papilla. (I) The expression level of AQP2 and TM5b in rat kidney papilla. 100 μg of protein of lysates of papilla lysates from hydrated and dehydrated rats was immunoblotted for AQP2 and TM5b. The band density was normalized to that of hydrated rats. Data represent the mean and SE from three independent experiments. *, P < 0.05 versus hydrated rats. (J) In vitro immunoprecipitation and PKA phosphorylation assays using AQP2 and G-actin proteins. After the incubation of AQP2 and G-actin, immunoprecipitates by anti-actin antibody were subjected to PKA phosphorylation or not and immunoblotted using anti-actin antibody (top), anti-AQP2 antibody (middle), and antiphosphoserine antibody (bottom).
We then quantified the bound-to-total ratio of AQP2 and TM5b (Fig. 5, D–F). The bound/input ratio for each protein in the immunoprecipitation was normalized for the immunoprecipitation efficiency of the antibody used for the immunoprecipitation. Forskolin increased the bound-to-total ratio of AQP2 and TM5b. The bound-to-total ratio of phosphorylated AQP2 was not significantly changed by forskolin stimulation, which is consistent with the binding of phosphorylated AQP2 to TM5b. Rho is reported to be involved in actin assembly and AQP2 trafficking (Klussmann et al., 2001; Tamma et al., 2003). To examine the involvement of Rho in the regulation of AQP2 interaction with TM5b, coimmunoprecipitation assay was performed using the cells pretreated with Clostridium difficile toxin B, which inhibits all members of the Rho family by glycosylation (Lerm et al., 2000; Klussmann et al., 2001). Forskolin-induced increase in the interaction between AQP2 and TM5b was not changed by toxin B treatment (Fig. 5, D and F), indicating that Rho is not directly involved in the regulation of this interaction.
These coimmunoprecipitation assays were performed using MDCK cells ectopically expressing AQP2. We then examined the expression level of AQP2 and TM5b in the MDCK/AQP2 cells and rat kidney papilla by quantitative Western blotting in comparison to the standard curves of purified recombinant proteins (Fig. 5, G and H) as previously described (Chapman and Jahn, 1994; Takamori et al., 2006). AQP2 comprises 2.3 ± 1% (wt/wt) of total protein in MDCK cells and 0.24 ± 0.044% in kidney papilla. TM5b comprises 0.15 ± 0.022% in MDCK cells and 0.093 ± 0.012% in kidney papilla. As shown in Fig. 5 I, water restriction increases AQP2 expression in kidney papilla, which is consistent with the previous observation (Christensen et al., 1998). However, TM5b expression is not significantly changed by water restriction.
Our results show that PKA phosphorylation of AQP2 releases AQP2 from G-actin and promotes AQP2 binding to TM5b. To examine whether G-actin–bound AQP2 can be phosphorylated by PKA, we performed in vitro immunoprecipitation and PKA phosphorylation assays using AQP2 and G-actin proteins (Fig. 5 J). After the incubation of AQP2 and G-actin, immunoprecipitates by anti-actin antibody were subjected to PKA phosphorylation. Fig. 5 J shows that G-actin–bound AQP2 is still accessible to PKA and can be phosphorylated.
Inhibitory role of TM5b in AQP2 trafficking
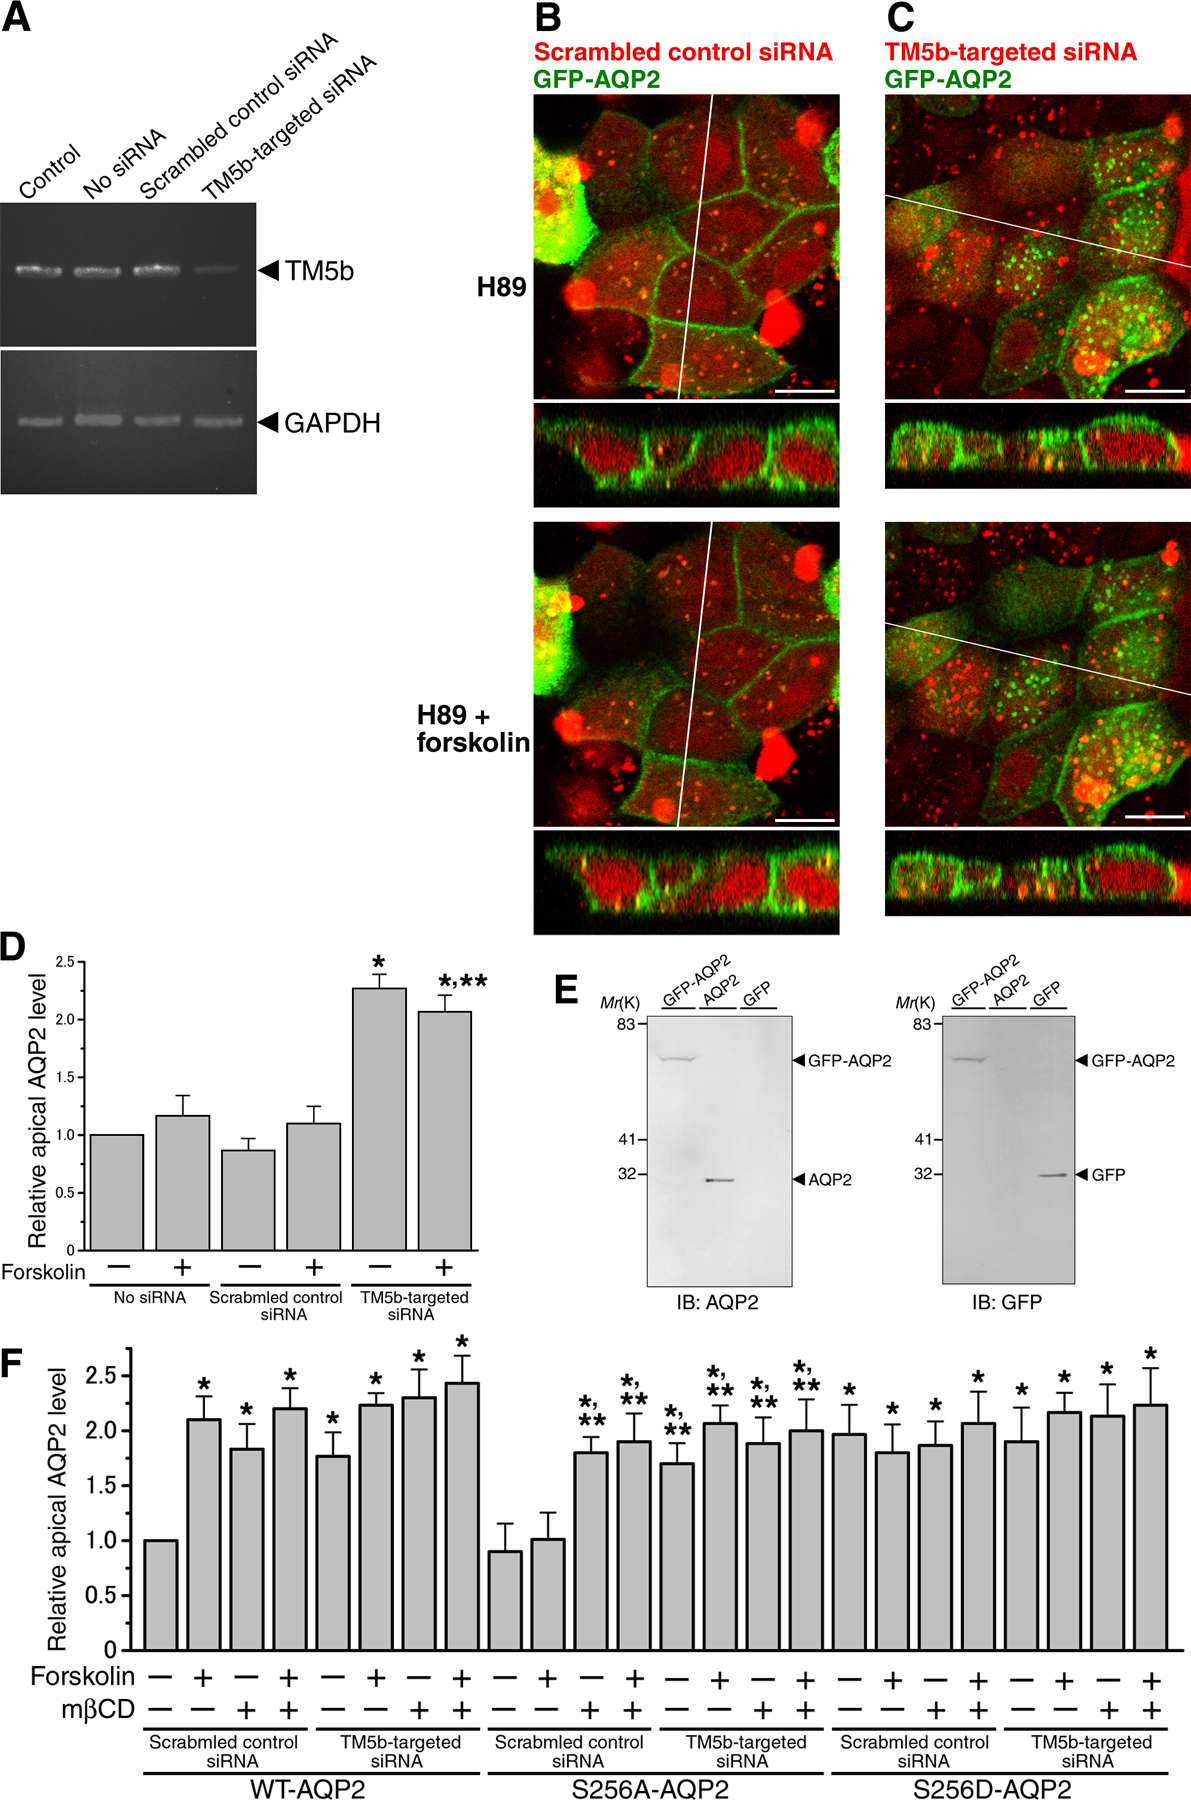
To examine the inhibitory role of TM5b in AQP2 trafficking, the levels of TM5b in MDCK cells were depleted using an RNAi-mediated TM5b knockdown system. MDCK cells were transfected with a TM5b siRNA or a scrambled control siRNA, and the levels of TM5b were examined by real time quantitative PCR (RT-qPCR). The level of TM5b was significantly decreased (normalized values to GAPDH expression: control siRNA, 0.77 ± 0.11; TM5b-targeted siRNA, 0.23 ± 0.03; P < 0.01), indicating efficient knockdown of the isoform (Fig. S5 A, available at http://www.jcb.org/cgi/content/full/jcb.200709177/DC1). We examined AQP2 trafficking in TM5b-depleted cells by confocal microscopy using live cells and apical cell surface biotinylation assays (Fig. 6 and Fig. S5). In the cells transfected with control siRNA, GFP-AQP2 was mainly present intracellularly and forskolin stimulation increased GFP-AQP2 on the plasma membrane (Fig. 6, A, D, and E). Immunoblot analyses using the lysates of the cells transfected with GFP-AQP2 showed no molecular breakdown and excluded the possibility that GFP was cleaved off from GFP-AQP2 (Fig. S5 E). In TM5b-depleted cells, GFP-AQP2 targeting to the plasma membrane was significantly increased independently of forskolin stimulation (Fig. 6, B, D, and E). To exclude the possibility of up-regulation of the A kinase pathway by TM5b knockdown, we suppressed PKA activity with the PKA inhibitor H89 (Fig. S5, B–D). H89 abolished forskolin-induced GFP-AQP2 translocation to the plasma membrane in the control cells. In contrast, in TM5b-depleted cells GFP-AQP2 trafficking to the plasma membrane was still increased and was not inhibited by H89. These findings indicate that TM5b knockdown promotes AQP2 trafficking to the plasma membrane independently of cAMP signaling. We then examined AQP2 trafficking in TM5b-overexpressing cells, which were transfected with GFP-fused TM5b (Fig. 6, C, F, and G). In the control cells transfected with GFP, forskolin-induced trafficking of DsRed-AQP2 to the cell surface was observed. In TM5b-overexpressing cells, forskolin-induced trafficking of DsRed-AQP2 was significantly inhibited. These findings indicate that TM5b overexpression inhibits AQP2 trafficking to the plasma membrane.
Figure 6.

RNAi-mediated knockdown of TM5b promotes AQP2 trafficking, whereas overexpression of TM5b inhibits the AQP2 trafficking. (A and B) MDCK cells were transfected with cDNA encoding GFP-AQP2 (green) and with either TM5b siRNA (B) or scrambled control siRNA (A), which was indicated by fluorescein-labeled double-stranded RNA (dsRNA; red), and stimulated with forskolin. (C) MDCK cells were transfected with DsRed-AQP2 (red) and GFP-TM5b (green) and stimulated with forskolin. The bottoms represent z scans at the positions indicated by the white lines in the xy planes. Bars, 10 μm. (D and E) Apical cell surface biotinylation assay using the cells transfected with GFP-AQP2 and with TM5b siRNA or scrambled control siRNA, corresponding to A and B. No siRNA indicates the cells transfected with GFP-AQP2 alone. (D) Biotinylated proteins were precipitated with streptavidin-agarose beads and immunoblotted for AQP2. (E) The densitometric quantification normalized to the cells without siRNA and forskolin treatment. Data represent the mean and SE from three independent experiments. *, P < 0.05 versus the cells without siRNA and forskolin treatment. (F and G) Apical cell surface biotinylation assay using the cells transfected with DsRed-AQP2 and with GFP-TM5b or GFP, corresponding to C. (F) Biotinylated proteins were immunoblotted for AQP2 as in D. (G) The densitometric quantification normalized to GFP-transfected cells without forskolin stimulation. Data represent the mean and SE from three independent experiments. *, P < 0.05 versus GFP-transfected cells without forskolin stimulation; **, P < 0.05 versus GFP-transfected cells with forskolin stimulation.
To further confirm the inhibitory role of TM5b in AQP2 trafficking, we then examined AQP2 trafficking using MDCK/AQP2 cells, in which AQP2 was targeted to the apical membrane more specifically upon forskolin stimulation (Fig. S2, A and B). TM5b knockdown or overexpression was performed using MDCK/AQP2 cells and AQP2 trafficking was examined in these cells (Figs. 7 and 8). In control siRNA-transfected cells, AQP2 was mainly localized in the subapical region, and forskolin stimulation induced AQP2 targeting to the apical membrane (Fig. 7 A). In TM5b-depleted cells, AQP2 trafficking to the apical membrane was significantly increased independently of forskolin stimulation (Fig. 7, B, E, and F). The PKA inhibitor H89 abolished forskolin-induced AQP2 translocation to the apical membrane in the control cells (Fig. 7 C). In contrast, in TM5b-depleted cells AQP2 trafficking to the apical membrane was still increased and was not inhibited by H89 (Fig. 7, D–F). These findings show that TM5b knockdown promotes AQP2 trafficking to the apical membrane independently of cAMP signaling. We then examined AQP2 trafficking in TM5b-overexpressing MDCK/AQP2 cells, which were transfected with GFP-fused TM5b (Fig. 8). In the control cells transfected with GFP, forskolin-induced trafficking of AQP2 to the apical membrane was observed. In TM5b-overexpressing cells, forskolin-induced trafficking of AQP2 was significantly inhibited. These findings show that TM5b overexpression inhibits AQP2 trafficking to the apical membrane.
Figure 7.

TM5b knockdown promotes AQP2 trafficking in MDCK/AQP2 cells. (A–D) MDCK/AQP2 cells were transfected with TM5b siRNA (B) or scrambled control siRNA (A), which was indicated by fluorescein-labeled dsRNA (red), and treated without (top) or with (bottom) forskolin. Pretreatment with H89 was also performed using the cells transfected with TM5b siRNA (D) or the control siRNA (C). Cells were labeled for AQP2 (green). Bars, 10 μm. (E and F) Apical cell surface biotinylation assay using MDCK/AQP2 cells transfected with TM5b siRNA or control siRNA, corresponding to A–D. (E) Biotinylated proteins were precipitated with streptavidin-agarose beads and immunoblotted for AQP2. (F) The densitometric quantification normalized to control siRNA-transfected cells without forskolin treatment. Data represent the mean and SE from three independent experiments. *, P < 0.05 versus control siRNA-transfected cells without forskolin treatment; **, P < 0.05 versus control siRNA-transfected cells pretreated with H89 without forskolin stimulation; ***, P < 0.05 versus control siRNA-transfected cells pretreated with H89 with forskolin stimulation.
Figure 8.

TM5b overexpression inhibits AQP2 trafficking in MDCK/AQP2 cells. (A) MDCK/AQP2 cells were transfected with GFP-TM5b or GFP (green) and treated without (top) or with (bottom) forskolin. Cells were labeled for AQP2 (red). Bars, 10 μm. (B and C) Apical cell surface biotinylation assay using MDCK/AQP2 cells transfected with GFP-TM5b or GFP, corresponding to A. (B) Biotinylated proteins were precipitated with streptavidin-agarose beads and immunoblotted for AQP2. (C) The densitometric quantification normalized to GFP-transfected cells without forskolin stimulation. Data represent the mean and SE from three independent experiments. *, P < 0.05 versus GFP-transfected cells without forskolin stimulation; **, P < 0.05 versus GFP-transfected cells with forskolin stimulation.
We also performed apical cell surface biotinylation assays using the cells expressing WT-AQP2, S256A-AQP2, or S256D-AQP2 (Fig. S5 F). S256A mutation abolished forskolin-induced AQP2 accumulation on the apical membrane and S256D mutation increased its apical membrane accumulation independently of forskolin stimulation. TM5b knockdown increased apical membrane accumulation of these mutants independently of forskolin stimulation, as seen in WT-AQP2. It is reported that the cholesterol-depleting agent methyl-β-cyclodextrin (mβCD) inhibits AQP2 endocytosis (Lu et al., 2004). Pretreatment with mβCD also increased apical membrane accumulation of WT-, S256A-, and S256D-AQP2 independently of forskolin stimulation. In TM5b-depleted cells, apical membrane accumulation of WT-, S256A-, and S256D-AQP2 was not significantly changed by mβCD pretreatment.
We then examined local actin reorganization in TM5b knockdown cells (Fig. 9, A and C). In control siRNA-transfected cells, there was a tendency for a decrease in F-actin in the apical region upon forskolin stimulation, although the changes were not significant (Fig. 9 A, left). In contrast, in TM5b-depleted cells, F-actin in the apical region was clearly decreased with or without forskolin stimulation (Fig. 9 A, right). However, at the light microscopic level, there is a limitation for evaluating the changes in apical F-actin. Therefore, to quantify the changes in F-actin level at the apical surface, the lysates of the cells biotinylated on the apical surface were incubated with fluorescein-labeled phalloidin, precipitated with streptavidin-agarose beads, and the fluorescence was measured (Fig. 9 C). In control siRNA-transfected cells, a significant decrease was observed in F-actin levels at the apical surface upon forskolin stimulation. In TM5b-depleted cells, F-actin at the apical surface was significantly decreased independently of forskolin stimulation. The effect of TM5b overexpression in actin reorganization was also examined (Fig. 9, B and D). Quantification of apical F-actin showed that forskolin induced a significant decrease in apical F-actin in the control cells transfected with GFP. In TM5b-overexpressing cells, the forskolin-induced decrease in apical F-actin was significantly reduced. These findings show that apical F-actin is regulated by TM5b. These results, together with the data in 6–8, indicate that TM5b regulates AQP2 trafficking by inducing local actin reorganization.
Figure 9.

Apical F-actin is regulated by TM5b. (A) MDCK cells transfected with TM5b siRNA or scrambled control siRNA, which was indicated by fluorescein-labeled dsRNA (red), were treated without (top) or with (bottom) forskolin and labeled for F-actin (green). (B) MDCK cells transfected with GFP-TM5b or GFP (green) were treated without (top) or with (bottom) forskolin and labeled for F-actin (red). (C and D) Quantification of F-actin associated with the apical membrane. (C) MDCK cells transfected with TM5b siRNA or control siRNA were treated with or without forskolin and biotinylated on the apical surface. The lysates were incubated with phalloidin conjugated with Alexa Fluor 488 and precipitated with streptavidin-agarose beads and the fluorescence was measured. Each value was normalized to control siRNA-transfected cells without forskolin. Data represent the mean and SE from three independent experiments. *, P < 0.05 versus control siRNA-transfected cells without forskolin. (D) MDCK cells transfected with GFP-TM5b or GFP were treated with or without forskolin and biotinylated on the apical surface. The lysates were incubated with phalloidin conjugated with Alexa Fluor 568 and precipitated with streptavidin-agarose beads and the fluorescence was measured. Each value was normalized to GFP-transfected cells without forskolin. Data represent the mean and SE from three independent experiments. *, P < 0.05 versus GFP-transfected cells without forskolin; **, P < 0.05 versus GFP-transfected cells with forskolin.
Discussion
The findings in this study provide direct evidence that the interactions of AQP2 with G-actin are regulated by cAMP signaling and PKA phosphorylation of AQP2. Furthermore, the present findings show that AQP2 itself possesses an actin-regulatory function to initiate its trafficking by reciprocal interaction with G-actin and TM5b. Thus, we propose a novel mechanism of AQP2 trafficking (Fig. 10). Under basal conditions, AQP2 binds to G-actin, and F-actin stabilized by TM forms a barrier inhibiting translocation of AQP2 toward the apical membrane. Vasopressin-triggered cAMP signaling induces PKA phosphorylation of AQP2, which dissociates G-actin from AQP2 and promotes AQP2 association with TM5b. Sequestering of TM5b from F-actin by phosphorylated AQP2 induces destabilization of the F-actin network in the vicinity of AQP2, allowing efficient movement of AQP2.
Figure 10.

Model of the mechanism initiating AQP2 trafficking. Under basal conditions, AQP2 binds to G-actin (A). Vasopressin-triggered cAMP signaling induces PKA phosphorylation of AQP2. AQP2 phosphorylation dissociates G-actin from AQP2 (B) and promotes AQP2 association with TM5b (C). Sequestering of TM5b from F-actin by phosphorylated AQP2 induces destabilization of the F-actin network in the vicinity of AQP2, allowing efficient transport of AQP2 toward the apical membrane.
TM regulates actin reorganization through multiple pathways. TM protects actin filaments against severing and depolymerization by gelsolin (Fattoum et al., 1983; Ishikawa et al., 1989) and cofilin (Bernstein and Bamburg, 1982; Ono and Ono, 2002). TM inhibits the Arp2/3 complex–nucleated polymerization and branching (Blanchoin et al., 2001). TM also inhibits the rate of depolymerization from the pointed end (Broschat et al., 1989; Broschat, 1990; Kostyukova and Hitchcock-DeGregori, 2004). These observations illustrate critical roles of TM in dynamic regulation of the actin cytoskeleton. TM isoforms differ in their affinity to F-actin and regulatory function and exhibit tissue-specific expression patterns (Perry, 2001). Among TM isoforms, TM5b is expressed in high levels in the kidney and localized in the apical and basolateral cell cortices in epithelial cells (Fig. 6 C; Temm-Grove et al., 1996, 1998; Perry, 2001) and is the only isoform that binds to AQP2 (Noda et al., 2005). Our present study shows that TM5b inhibits depolymerization at the pointed end of actin filaments in reconstituted liposomes and AQP2 phosphorylation inhibits the TM5b function, resulting in actin depolymerization. We furthermore show that RNAi-mediated knockdown of TM5b promotes AQP2 trafficking to the apical membrane independently of cAMP signaling.
In the process of the trafficking of channels, transporters, synaptic vesicles, and secretory vesicles, the cortical actin network is supposed to form a physical barrier that prevents the trafficking. Several reports support the actin barrier model as a molecular mechanism of AQP2 trafficking. Vasopressin depolymerizes apical F-actin in rat inner medullary collecting duct, resulting in the exocytosis of water channel–carrying vesicles (Simon et al., 1993). Rho activation induces actin polymerization and inhibits AQP2 trafficking, whereas Rho inhibition induces actin depolymerization and promotes AQP2 trafficking (Klussmann et al., 2001; Brown, 2003; Tamma et al., 2003, 2005). These data indicate the facilitatory role of actin depolymerization in the AQP2 translocation to the cell surface. Our present study shows that inhibition of TM5b function by phosphorylated AQP2 induces actin depolymerization and TM5b knockdown promotes AQP2 trafficking to the apical membrane, which is consistent with the actin barrier model for the trafficking. TM5b overexpression inhibits the AQP2 trafficking. These findings also indicate the critical involvement of TM5b in the formation of the actin barrier that prevent AQP2 trafficking.
FCCS reveals AQP2 interaction with G-actin on the AQP2 trafficking pathway in live cells at the resolution of single molecule. cAMP signaling, an effector of vasopressin action, and phosphorylation at serine 256 of AQP2 release AQP2 from G-actin. Because this dissociation is observed both in the subapical region and on the apical membrane, not only exocytosis but also endocytosis may be promoted by vasopressin. In addition to modulating the ratio of the exocytic rate to the endocytic rate, vasopressin may increase the overall recycling rate.
Recently, Lu et al. (2007) have shown that hsc70 and hsp70 heat shock proteins interact with the AQP2 C terminus. Functional knockdown of hsc70 results in membrane accumulation of AQP2 and inhibits endocytosis. They suggest that AQP2 accumulated on the cell surface by vasopressin is subsequently dephosphorylated by local phosphatase activity and associates with hsc70, resulting in its reinternalization (Lu et al., 2007). G-actin also binds to the C terminus of nonphosphorylated AQP2 (Fig. 1; Noda et al., 2004a). Together with these findings, it is speculated that there may be a competitive binding between G-actin and hsc70 for the nonphosphorylated AQP2 C terminus. Lu et al. (2007) also show that S256A mutation inhibits AQP2 binding with hsc70 although S256A-AQP2 does not accumulate on the cell surface (Fig. S4). In this case, S256A-AQP2 binds to G-actin and decreases TM5b binding, in which F-actin is stabilized by TM5b, resulting in the mainly intracellular retention of S256A-AQP2 (Fig. 2, Fig. 5, and Fig. S4). In addition to the reciprocal interaction between G-actin and TM5b regulated by AQP2 phosphorylation, there may be a spatiotemporally regulated binding between hsc70 and G-actin for the nonphosphorylated AQP2 C terminus, which may distinguish between exocytosis and endocytosis of AQP2. Therefore, hsc70 may also be involved in the apical localization of AQP2 in our study. Further analyses may be necessary to examine these possibilities.
There are several proteins whose interactions with actin are regulated by their phosphorylation. Caldesmon phosphorylation at serine 759 decreases its affinity with actin by its conformational change (Patchell et al., 2002). ADF/cofilin is dissociated from actin by its phosphorylation at serine 3, which is caused by steric blocking of actin binding by the phosphate moiety and not by a conformational change at the ADF/cofilin-actin interface (dos Remedios et al., 2003). The present study shows that AQP2 interactions with G-actin and TM5b are regulated by phosphorylation at serine 256 in the C terminus of AQP2. Further analyses are required for clarifying the structural basis for the interactions controlled by the AQP2 phosphorylation.
In this paper, AQP2 trafficking was examined using MDCK cells, which were derived from dog kidney tubules and exhibit properties of cortical collecting duct epithelial cells and proximal tubular epithelial cells (Richardson et al., 1981). MDCK cells are widely used to study AQP2 trafficking. As in collecting ducts, AQP2 expressed in MDCK cells is localized in intracellular vesicles in nonstimulated cells and translocates to the apical membrane after stimulation by vasopressin or the adenylate cyclase activator forskolin (Fig. S2; Brown, 2003). Because AQP2 is primarily expressed in collecting duct principle cells, it would be more physiologically relevant to use cell lines originating from collecting duct cells. However, for FCS and FCCS experiments performed in this study, proteins of interest should be fused with fluorescent protein and its expression level should be kept low in a cell to obtain the appropriate fluctuating signals. Therefore, we used MDCK cells, in which the control of transfection efficiency was relatively easy and AQP2 trafficking to the apical membrane was observed as in renal collecting ducts (Fig. S2).
The present study shows that AQP2 itself possesses an actin-regulatory function to initiate its movement by phosphorylation-dependent reciprocal interaction with G-actin and TM5b. Recently, there were several studies indicating the direct interactions of channel proteins with actin. ClC2 chloride channel directly interacts with F-actin and is activated by disruption of the actin cytoskeleton (Ahmed et al., 2000). Short ClC3 isoform binds to F-actin and inhibition of this binding leads to a reduced hypotonic activation of this channel (McCloskey et al., 2007). V-ATPase subunit C binds to both F- and G-actin and induces cross-linking of actin filaments (Vitavska et al., 2005). Voltage-dependent anion channel directly binds to G-actin (Roman et al., 2006), which modulates voltage-dependent anion channel gating (Xu et al., 2001). Mazzochi et al. (2006a,b) show that the α subunit of ENaC (epithelial sodium channel) directly interacts with F-actin and is colocalized with F-actin at both the apical membrane and the subapical cytoplasm. The authors suggest that the direct interactions with actin regulate not only the channel activity but also the intracellular trafficking of ENaC from a subapical pool to the plasma membrane. Although there are several studies showing the direct binding of channels with actin, the roles of the interactions in the regulation of each channel are not clarified. With regard to TM, a calcium-permeable nonselective cation channel polycystin-2 is shown to bind to TM1 (Li et al., 2003), although the roles of the interaction in polycystin-2 function are not clarified. This paper shows that AQP2 itself critically regulates actin reorganization to initiate its movement by phosphorylation-dependent reciprocal interaction between G-actin and TM5b. Because the trafficking of many channels is altered by their phosphorylation, the interactions of channels with the actin cytoskeleton may be regulated by posttranslational mechanisms, including phosphorylation, and this trafficking mechanism may be extended to other channel proteins.
Materials and methods
Expression and purification of recombinant proteins
Human AQP2 cDNA was subcloned into pET32 (EMD) to generate His-tagged Trx-fused AQP2 (AQP2/Trx). Rat TM5b cDNA was subcloned into pET28. AQP2/Trx and TM5b were expressed in Rosetta-Gami Escherichia coli (EMD) by induction with 1 mM IPTG for 3 h at 25°C and for 4 h at 30°C, respectively. The bacterial pellets were incubated with lysozyme, sonicated, and centrifuged at 10,000 g. For AQP2 purification, the pellets were suspended with 6 M urea in PBS and centrifuged. The supernatants were diluted to a concentration of 2 M urea and applied to a column of Talon resin (Clontech Laboratories, Inc.). The column was washed and eluted by buffer A (50 mM K-Hepes, pH 7.6, 100 mM KCl, and 10 mM MgCl2) containing 2% octylglucoside and 150 mM imidazole. For TM5b purification, the supernatants were applied to Talon column that was washed and eluted by buffer A containing 150 mM imidazole.
Reconstitution of recombinant proteins in liposomes
Lipids (Sigma-Aldrich) were mixed in chloroform/methanol at 2/1 (vol/vol) to yield the following molar ratios: phosphatidylcholine, 10; phosphatidylethanolamine, 5; phosphatidylinositol, 1; and cholesterol, 10. After drying under N2 gas, they were resuspended in buffer A containing 2% octylglucoside to a total lipid concentration of 7.2 mM, mixed with an equal volume of recombinant AQP2 (0.5 mg/ml), and dialyzed against buffer A. For PKA phosphorylation, the proteoliposomes were added with 1 mM ATP and 200,000 U/ml cAMP-dependent PKA (New England Biolabs, Inc.) and incubated at 30°C for 1 h. The proteoliposomes were overlaid with step gradients of 30 and 40% OptiPrep (Axis-Shield) and centrifuged using a SW41Ti rotor (Beckman Coulter) at 39,000 rpm for 4 h. Liposomes were collected at the 0–30% interface (Fig. 1 A). The phosphorylation was confirmed by immunoblotting using antiphosphoserine antibodies (Sigma-Aldrich; Fig. 1 B).
SPR experiments
Measurements were performed using the BIAcore 3000 (GE Healthcare). G-actin and F-actin, which were prepared from human platelet actin as recommended by the supplier (Cytoskeleton, Inc.), were immobilized onto a CM3-sensor chip surface at the mean binding density levels of 5.6 ± 0.11 and 5.8 ± 0.12 ng/mm2 (mean ± SE), respectively. Reference flow cells were generated using the same coupling procedure but without actin injections. Each proteoliposome was extruded through polycarbonate filters with 100-nm pores (Avestin, Inc.). Analyses were performed at 25°C and a flow rate of 5 μl/min. The signal did not return to baseline after injection stop, as was similarly observed in the reports using liposomes (de Haro et al., 2004; Sandhoff et al., 2005).
Immunofluorescence study
MDCK cells stably expressing AQP2 (MDCK/AQP2) were cultured and grown on permeable filter supports (Corning) as described previously (Asai et al., 2003; Noda et al., 2004b). AQP2 localization was examined using anti-AQP2 antibody (Yamashita et al., 2000) and anti-rabbit secondary antibody conjugated with Alexa Fluor 568 or Alexa Fluor 488 (Invitrogen). The localization of G-actin was examined using deoxyribonuclease-1 conjugated with Alexa Fluor 488. The localization of F-actin was examined using phalloidin conjugated with Alexa Fluor 568 or Alexa Fluor 488.
Imaging
Immunofluorescence images were captured using a confocal microscope (LSM 510; Carl Zeiss, Inc.) with a water immersion objective (C-Apochromat; 40×, 1.2 NA; Carl Zeiss, Inc.) at room temperature. Images were cropped using Photoshop 7.0 (Adobe).
Expression of AQP2, actin, and TM5b in MDCK cells
For expression of fluorescent protein–fused proteins, human AQP2 cDNA and S256A-AQP2 cDNA that were generated by PCR were subcloned into pDsRed-Monomer-C1 vector (Clontech Laboratories, Inc.), respectively. Rat TM5b cDNA was subcloned into pAcGFP1-C1 vector. MDCK cells were transfected with these plasmids and pAcGFP1-actin (Clontech Laboratories, Inc.) using Lipofectamine 2000 (Invitrogen). For TM5b overexpression in MDCK/AQP2 cells, pAcGFP1-TM5b was transfected into MDCK/AQP2 cells. For immunoprecipitation assays, WT-AQP2, S256A-AQP2, and S256D-AQP2 cDNA were subcloned into pcDNA3 vector (Invitrogen) and transfected into MDCK cells using Lipofectamine 2000. Cells were stimulated with 40 μM forskolin or preincubated with 30 μM H89 (Seikagaku Corporation) for 30 min before being treated with 40 μM forskolin for 10 min in the presence of 30 μM H89. For Rho inhibition, cells were incubated with 200 ng/ml C. difficile toxin B (Sigma-Aldrich) for 2 h. For inhibition of endocytosis, cells were incubated with 10 mM mβCD (Wako Pure Chemical Industries, Ltd.) for 30 min.
FCS and FCCS measurements
LSM 510/ConfoCor2 (Carl Zeiss, Inc.) was used for FCS and FCCS measurements. The excitation line was set at 488 nm for AcGFP1 and 543 nm for DsRed-monomer, respectively. The confocal pinhole diameter was adjusted to 70 μm for 488 nm and 78 μm for 543 nm. The emitted light was detected at 505–530 nm for AcGFP1 and at 600–650 nm for DsRed-monomer and scanned independently in a multitracking mode. The fluorescence autocorrelation functions of the red and green channels, Gr(τ) and Gg(τ), and the cross-correlation function, Gc(τ), were calculated using
 |
where τ denotes the time delay, Ii is the fluorescence intensity of the red channel (i = r) or green channel (i = g), and Gr(τ), Gg(τ), and Gc(τ) denote the autocorrelation function of red, green, and cross-correlation function, respectively. Acquired Gx(τ) was fitted by a one-, two-, or three-component model as
 |
where Fi and τi are the fraction and diffusion time of component i, respectively. N is the mean number of fluorescent particles in the excitation-detection volume defined by radius w0 and length 2z0, and s is the structure parameter (s = z0/w0). Acquired Gx(τ) was best fitted by a two-component model, and the diffusion coefficient of the major fraction is shown in Fig. S3. The structure parameter was calibrated using the known diffusion coefficient of Rhodamine-6G (DRh6G, 280 μm2/s). The diffusion coefficients of AQP2 and actin were calculated from DRh6G and measured diffusion times of Rh6G (τRh6G), AQP2, and actin as follows:
 |
where Dx and τx denote the diffusion coefficients and the diffusion times of AQP2 (x = AQP2) and actin (x = actin), respectively.
For quantitative evaluation, the amplitude of the cross-correlation function was normalized to the amplitude of the autocorrelation function of DsRed-monomer to calculate the relative cross-correlation ([Gc(0)-1]/[Gr(0)-1]). As positive control, FCCS analysis was performed using the cells expressing DsRed-monomer-AcGFP1 chimera (Fig. S3 A) and positive cross-correlation signal was observed ([Gc(0)-1]/[Gr(0)-1]; 0.48 ± 0.031). As negative control, FCCS analysis was performed using the cells expressing both DsRed-monomer and AcGFP1 and positive cross-correlation signal was not observed (Fig. S3 B).
Pyrene-actin assay
For pyrene-actin assay using papillae extract, 4 μM of human platelet actin containing 10% pyrene actin (Cytoskeleton, Inc.) was preincubated in buffer B (100 mM KCl, 0.2 mM CaCl2, 2 mM MgCl2, 10 mM K-Hepes, pH 7.6, 1 mM ATP, and 0.5 mM dithiothreitol) containing antiphotobleach solution (7.5 mM creatine phosphate, 13.5 mg/ml glucose, 0.1 mg/ml catalase, and 0.5 mg/ml glucose oxidase) and 9 μl of papilla extract (8 μg/μl). Then proteoliposomes, at a final concentration of 0.1 mM, were added before pyrene fluorescence was monitored with excitation at 365 nm and emission at 407 nm using a fluorescence spectrophotometer (F2500; Hitachi). Papilla extract was prepared as follows. Kidney papillae were excised from Wistar rats and homogenized in buffer B containing protease inhibitor mixture (Roche), centrifuged at 200,000 g, and the resultant supernatants were used. The animal experiments were approved by the Institutional Animal Care and Use Committee of Tokyo Medical and Dental University. For pyrene-actin assay using TM5b, gelsolin-capped actin filaments were prepared by polymerization of 3 μM actin containing 10% pyrene actin in the presence of 11.2 nM gelsolin (Cytoskeleton, Inc.) in buffer B. After 15 min of incubation with 0.65 μM TM5b, proteoliposomes, at a final concentration of 3 μM, were added. After 15 min of incubation, antiphotobleach solution was added. Then, the mixture was diluted fivefold and the pyrene fluorescence was monitored.
Cosedimentation assay with proteoliposome, F-actin, and TM5b
3 μM TM5b incubated with 1 μM F-actin for 15 min at 25°C was mixed with 10 μM proteoliposomes in 50 mM K-Hepes, 100 mM KCl, and 10 mM MgCl2 for 30 min at 25°C. The sample was overlaid on an OptiPrep step gradient (3 ml of 40%, 2.5 ml of 35%, 2.5 ml of 30%, 1.2 ml of 25%, 1 ml of 15%, and 1 ml of 5%) and centrifuged using a SW41Ti rotor for 3 h at 28,000 rpm. 5% of each fraction was analyzed by Western blot using antibodies for AQP2, actin (Sigma-Aldrich), or TM (Millipore).
Immunoprecipitation
MDCK cells were lysed in 20 mM Tris-HCl, pH 7.5, 150 mM NaCl, 1% Triton X-100, 100 μM 3-isobutyl-1-methylxanthine, 10 mM β-glycerophosphate, 0.15 mM Na orthovanadate, 1 mM dithiothreitol, and an EDTA-free protease inhibitor mixture (Roche). Cell lysates were sonicated and centrifuged at 20,000 g. The supernatants (1,600 μg of protein) were incubated with anti-AQP2 antibody or anti-TM antibody, followed by the addition of protein G–Sepharose. Normal rabbit IgG was used as a negative control. Immunoprecipitated samples were analyzed by Western blotting using antibodies for AQP2, phosphorylated AQP2, actin, or TM. Affinity-purified rabbit antibody for phosphorylated AQP2 was raised against a synthetic peptide corresponding to aa 253–262 of AQP2 with addition of a glycine residue at the N terminus and a cysteine residue at the C terminus (GRRQSVELHSPC) and chemically phosphorylated at serine 256 as previously described (Christensen et al., 2000).
For immunoprecipitation assay using AQP2 and G-actin protein (Fig. 5 J), 1 μM of recombinant AQP2 and 3 μM of G-actin, prepared as described in the previous paragraph, were incubated in 5 mM Tris-HCl, pH 7.5, 0.2 mM CaCl2, 200 μM ATP, and 2% octylglucoside for 1 h at 4°C. The sample was then incubated with anti-actin antibody, followed by the addition of protein G–Sepharose. For PKA phosphorylation, the immunoprecipitated samples were washed and incubated in 50 mM Tris-HCl, pH 7.5, 10 mM MgCl2, 1 mM ATP, and 200,000 U/ml cAMP-dependent PKA at 30°C for 1 h.
Immunoblot analysis of rat kidney papilla
The animal experiments were approved by the Institutional Animal Care and Use Committee of Tokyo Medical and Dental University. Kidney papilla lysates from Wistar rats water-deprived for 48 h were analyzed by Western blotting using antibodies for AQP2 and TM.
RNAi
siRNA for the region 716–740 of canine TM5b (GCAUCAGAUGCUGGAUCAGACUUUA) was obtained from Invitrogen. Mutated sequence (GCAUAGAGUCGCUAGCAGAUCUUUA) was used as a negative control. Transfection was performed using Lipofectamine 2000 (Invitrogen). 48 h after transfection, the cells were analyzed in the study. Double transfection of siRNA and Alexa Fluor 555–labeled dsRNA oligomer (Invitrogen) was performed to indicate transfected cells.
RT-qPCR
Total RNA from MDCK cells were extracted using GenElute Mammalian total RNA Miniprep kit (Sigma-Aldrich). 2 μg of total RNA was reverse-transcribed using SuperScript First-Strand Synthesis System for RT-PCR (Invitrogen). RT-qPCR was performed using Light Cycler (Roche) with SYBR Green. Primer sequences for TM5b were 5′-ACTACGAGAGGAAGCTGAGG-3′ (forward) and 5′-CCTCTGCAGCCATTAATGCT-3′ (reverse). For GAPDH the primers were 5′-GGTCGGAGTCAACGGATTTGGC-3′ (forward) and 5′-CATGTAGACCATGAGGTCCACCAC-3′ (reverse). TM5b mRNA expression level was normalized to GAPDH mRNA.
Apical cell surface biotinylation assay
Apical cell surface labeling of AQP2 was performed as previously described (Noda et al., 2004b). For quantification of F-actin associated with the apical membrane, cells were biotinylated on the apical surface and lysed in buffer C containing 20 mM Tris-HCl, pH 7.5, 150 mM NaCl, 100 mM sucrose, 0.8% octylglucoside, 0.1 mM sodium orthovanadate, and an EDTA-free protease inhibitor mixture (Roche). Cell lysates were sonicated and centrifuged at 20,000 g. The supernatants (300 μg of protein) were incubated with phalloidin conjugated with Alexa Fluor 568 for TM5b overexpression experiments and Alexa Fluor 488 for TM5b knockdown experiments, respectively, followed by the addition of streptavidin-agarose beads (Thermo Fisher Scientific). The agarose beads were washed and suspended in 1 ml of buffer C. Fluorescence was measured using an F2500 fluorescence spectrophotometer with excitation at 578 nm and emission at 600 nm for Alexa Fluor 568 and with excitation at 495 nm and emission at 520 nm for Alexa Fluor 488.
Statistics
Statistical analysis was performed using unpaired Student's t test. Differences were considered significant at p-values <0.05.
Online supplemental material
Fig. S1 shows SPR analyses of the binding of AQP2 reconstituted in liposomes to F-actin. Fig. S2 shows actin localization in MDCK cells during AQP2 trafficking. Fig. S3 shows FCCS analyses in MDCK cells and the diffusion coefficients of AQP2 and actin. Fig. S4 shows localization of S256A-AQP2 in MDCK cells. Fig. S5 shows that TM5b knockdown promotes AQP2 trafficking. Online supplemental material is available at http://www.jcb.org/cgi/content/full/jcb.200709177/DC1.
Supplementary Material
Acknowledgments
This study was supported in part by Grant-in-Aid for Creative Scientific Research from the Japan Society for the Promotion of Science and grants from The Japan Ministry of Education, Culture, Sports, Science and Technology.
Abbreviations used in this paper: AQP2, aquaporin-2; dsRNA, double-stranded RNA; FCCS, fluorescence cross-correlation spectroscopy; FCS, fluorescence correlation spectroscopy; mβCD, methyl-β-cyclodextrin; RT-qPCR, real time quantitative PCR; SPR, surface plasmon resonance; TM5b, tropomyosin-5b; Trx, thioredoxin; WT, wild type.
References
- Ahmed, N., M. Ramjeesingh, S. Wong, A. Varga, E. Garami, and C.E. Bear. 2000. Chloride channel activity of ClC-2 is modified by the actin cytoskeleton. Biochem. J. 352:789–794. [PMC free article] [PubMed] [Google Scholar]
- Asai, T., M. Kuwahara, H. Kurihara, T. Sakai, Y. Terada, F. Marumo, and S. Sasaki. 2003. Pathogenesis of nephrogenic diabetes insipidus by aquaporin-2 C-terminus mutations. Kidney Int. 64:2–10. [DOI] [PubMed] [Google Scholar]
- Bacia, K., S.A. Kim, and P. Schwille. 2006. Fluorescence cross-correlation spectroscopy in living cells. Nat. Methods. 3:83–89. [DOI] [PubMed] [Google Scholar]
- Baudendistel, N., G. Müller, W. Waldeck, A. Angel, and J. Langowski. 2005. Two-hybrid fluorescence cross-correlation spectroscopy detects protein-protein interactions in vivo. ChemPhysChem. 6:984–990. [DOI] [PubMed] [Google Scholar]
- Bernstein, B.W., and J.R. Bamburg. 1982. Tropomyosin binding to F-actin protects the F-actin from disassembly by brain actin-depolymerizing factor (ADF). Cell Motil. 2:1–8. [DOI] [PubMed] [Google Scholar]
- Blanchoin, L., T.D. Pollard, and S.E. Hitchcock-DeGregori. 2001. Inhibition of the Arp2/3 complex-nucleated actin polymerization and branch formation by tropomyosin. Curr. Biol. 11:1300–1304. [DOI] [PubMed] [Google Scholar]
- Broschat, K.O. 1990. Tropomyosin prevents depolymerization of actin filaments from the pointed end. J. Biol. Chem. 265:21323–21329. [PubMed] [Google Scholar]
- Broschat, K.O., A. Weber, and D.R. Burgess. 1989. Tropomyosin stabilizes the pointed end of actin filaments by slowing depolymerization. Biochemistry. 28:8501–8506. [DOI] [PubMed] [Google Scholar]
- Brown, D. 2003. The ins and outs of aquaporin-2 trafficking. Am. J. Physiol. Renal Physiol. 284:F893–F901. [DOI] [PubMed] [Google Scholar]
- Chapman, E.R., and R. Jahn. 1994. Calcium-dependent interaction of the cytoplasmic region of synaptotagmin with membranes. Autonomous function of a single C2-homologous domain. J. Biol. Chem. 269:5735–5741. [PubMed] [Google Scholar]
- Christensen, B.M., D. Marples, U.B. Jensen, J. Frokiaer, D. Sheikh-Hamad, M. Knepper, and S. Nielsen. 1998. Acute effects of vasopressin V2-receptor antagonist on kidney AQP2 expression and subcellular distribution. Am. J. Physiol. 275:F285–F297. [DOI] [PubMed] [Google Scholar]
- Christensen, B.M., M. Zelenina, A. Aperia, and S. Nielsen. 2000. Localization and regulation of PKA-phosphorylated AQP2 in response to V(2)-receptor agonist/antagonist treatment. Am. J. Physiol. Renal Physiol. 278:F29–F42. [DOI] [PubMed] [Google Scholar]
- de Haro, L., G. Ferracci, S. Opi, C. Iborra, S. Quetglas, R. Miquelis, C. Lévêque, and M. Seagar. 2004. Ca2+/calmodulin transfers the membrane-proximal lipid-binding domain of the v-SNARE synaptobrevin from cis to trans bilayers. Proc. Natl. Acad. Sci. USA. 101:1578–1583. [DOI] [PMC free article] [PubMed] [Google Scholar]
- dos Remedios, C.G., D. Chhabra, M. Kekic, I.V. Dedova, M. Tsubakihara, D.A. Berry, and N.J. Nosworthy. 2003. Actin binding proteins: regulation of cytoskeletal microfilaments. Physiol. Rev. 83:433–473. [DOI] [PubMed] [Google Scholar]
- Fattoum, A., J.H. Hartwig, and T.P. Stossel. 1983. Isolation and some structural and functional properties of macrophage tropomyosin. Biochemistry. 22:1187–1193. [DOI] [PubMed] [Google Scholar]
- Fushimi, K., S. Uchida, Y. Hara, Y. Hirata, F. Marumo, and S. Sasaki. 1993. Cloning and expression of apical membrane water channel of rat kidney collecting tubule. Nature. 361:549–552. [DOI] [PubMed] [Google Scholar]
- Hopkins, A.M., M. Bruewer, G.T. Brown, A.A. Pineda, J.J. Ha, L.M. Winfree, S.V. Walsh, B.A. Babbin, and A. Nusrat. 2004. Epithelial cell spreading induced by hepatocyte growth factor influences paxillin protein synthesis and posttranslational modification. Am. J. Physiol. Gastrointest. Liver Physiol. 287:G886–G898. [DOI] [PubMed] [Google Scholar]
- Ishikawa, R., S. Yamashiro, and F. Matsumura. 1989. Differential modulation of actin-severing activity of gelsolin by multiple isoforms of cultured rat cell tropomyosin. Potentiation of protective ability of tropomyosins by 83-kDa nonmuscle caldesmon. J. Biol. Chem. 264:7490–7497. [PubMed] [Google Scholar]
- Kamsteeg, E.J., I. Heijnen, C.H. van Os, and P.M. Deen. 2000. The subcellular localization of an aquaporin-2 tetramer depends on the stoichiometry of phosphorylated and nonphosphorylated monomers. J. Cell Biol. 151:919–930. [DOI] [PMC free article] [PubMed] [Google Scholar]
- Kitamura, A., H. Kubota, C.G. Pack, G. Matsumoto, S. Hirayama, Y. Takahashi, H. Kimura, M. Kinjo, R.I. Morimoto, and K. Nagata. 2006. Cytosolic chaperonin prevents polyglutamine toxicity with altering the aggregation state. Nat. Cell Biol. 8:1163–1169. [DOI] [PubMed] [Google Scholar]
- Klussmann, E., G. Tamma, D. Lorenz, B. Wiesner, K. Maric, F. Hofmann, K. Aktories, G. Valenti, and W. Rosenthal. 2001. An inhibitory role of Rho in the vasopressin-mediated translocation of aquaporin-2 into cell membranes of renal principal cells. J. Biol. Chem. 276:20451–20457. [DOI] [PubMed] [Google Scholar]
- Kogure, T., S. Karasawa, T. Araki, T. Saito, M. Kinjo, and A. Miyawaki. 2006. A fluorescent variant of a protein from the stony coral Montipora facilitates dual-color single-laser fluorescence cross-correlation spectroscopy. Nat. Biotechnol. 24:577–581. [DOI] [PubMed] [Google Scholar]
- Kostyukova, A.S., and S.E. Hitchcock-DeGregori. 2004. Effect of the structure of the N terminus of tropomyosin on tropomodulin function. J. Biol. Chem. 279:5066–5071. [DOI] [PubMed] [Google Scholar]
- Lerm, M., G. Schmidt, and K. Aktories. 2000. Bacterial protein toxins targeting rho GTPases. FEMS Microbiol. Lett. 188:1–6. [DOI] [PubMed] [Google Scholar]
- Li, Q., Y. Dai, L. Guo, Y. Liu, C. Hao, G. Wu, N. Basora, M. Michalak, and X.Z. Chen. 2003. Polycystin-2 associates with tropomyosin-1, an actin microfilament component. J. Mol. Biol. 325:949–962. [DOI] [PubMed] [Google Scholar]
- Lu, H., T.X. Sun, R. Bouley, K. Blackburn, M. McLaughlin, and D. Brown. 2004. Inhibition of endocytosis causes phosphorylation (S256)-independent plasma membrane accumulation of AQP2. Am. J. Physiol. Renal Physiol. 286:F233–F243. [DOI] [PubMed] [Google Scholar]
- Lu, H.A., T.X. Sun, T. Matsuzaki, X.H. Yi, J. Eswara, R. Bouley, M. McKee, and D. Brown. 2007. Heat shock protein 70 interacts with aquaporin-2 and regulates its trafficking. J. Biol. Chem. 282:28721–28732. [DOI] [PubMed] [Google Scholar]
- Mazzochi, C., J.K. Bubien, P.R. Smith, and D.J. Benos. 2006. a. The carboxyl terminus of the alpha-subunit of the amiloride-sensitive epithelial sodium channel binds to F-actin. J. Biol. Chem. 281:6528–6538. [DOI] [PubMed] [Google Scholar]
- Mazzochi, C., D.J. Benos, and P.R. Smith. 2006. b. Interaction of epithelial ion channels with the actin-based cytoskeleton. Am. J. Physiol. Renal Physiol. 291:F1113–F1122. [DOI] [PubMed] [Google Scholar]
- McCloskey, D.T., L. Doherty, Y.P. Dai, L. Miller, J.R. Hume, and I.A. Yamboliev. 2007. Hypotonic activation of short ClC3 isoform is modulated by direct interaction between its cytosolic C-terminal tail and subcortical actin filaments. J. Biol. Chem. 282:16871–16877. [DOI] [PubMed] [Google Scholar]
- Nielsen, S., J. Frokiaer, D. Marples, T.H. Kwon, P. Agre, and M.A. Knepper. 2002. Aquaporins in the kidney: from molecules to medicine. Physiol. Rev. 82:205–244. [DOI] [PubMed] [Google Scholar]
- Noda, Y., and S. Sasaki. 2006. Regulation of aquaporin-2 trafficking and its binding protein complex. Biochim. Biophys. Acta. 1758:1117–1125. [DOI] [PubMed] [Google Scholar]
- Noda, Y., S. Horikawa, Y. Katayama, and S. Sasaki. 2004. a. Water channel aquaporin-2 directly binds to actin. Biochem. Biophys. Res. Commun. 322:740–745. [DOI] [PubMed] [Google Scholar]
- Noda, Y., S. Horikawa, T. Furukawa, K. Hirai, Y. Katayama, T. Asai, M. Kuwahara, K. Katagiri, T. Kinashi, M. Hattori, et al. 2004. b. Aquaporin-2 trafficking is regulated by PDZ-domain containing protein SPA-1. FEBS Lett. 568:139–145. [DOI] [PubMed] [Google Scholar]
- Noda, Y., S. Horikawa, Y. Katayama, and S. Sasaki. 2005. Identification of a multiprotein “motor” complex binding to water channel aquaporin-2. Biochem. Biophys. Res. Commun. 330:1041–1047. [DOI] [PubMed] [Google Scholar]
- Ono, S., and K. Ono. 2002. Tropomyosin inhibits ADF/cofilin-dependent actin filament dynamics. J. Cell Biol. 156:1065–1076. [DOI] [PMC free article] [PubMed] [Google Scholar]
- Pack, C., K. Saito, M. Tamura, and M. Kinjo. 2006. Microenvironment and effect of energy depletion in the nucleus analyzed by mobility of multiple oligomeric EGFPs. Biophys. J. 91:3921–3936. [DOI] [PMC free article] [PubMed] [Google Scholar]
- Patchell, V.B., A.V. Vorotnikov, Y. Gao, D.G. Low, J.S. Evans, A. Fattoum, M. El-Mezgueldi, S.B. Marston, and B.A. Levine. 2002. Phosphorylation of the minimal inhibitory region at the C-terminus of caldesmon alters its structural and actin binding properties. Biochim. Biophys. Acta. 1596:121–130. [DOI] [PubMed] [Google Scholar]
- Perry, S.V. 2001. Vertebrate tropomyosin: distribution, properties and function. J. Muscle Res. Cell Motil. 22:5–49. [DOI] [PubMed] [Google Scholar]
- Richardson, J.C., V. Scalera, and N.L. Simmons. 1981. Identification of two strains of MDCK cells which resemble separate nephron tubule segments. Biochim. Biophys. Acta. 673:26–36. [PubMed] [Google Scholar]
- Roman, I., J. Figys, G. Steurs, and M. Zizi. 2006. Direct measurement of VDAC-actin interaction by surface plasmon resonance. Biochim. Biophys. Acta. 1758:479–486. [DOI] [PubMed] [Google Scholar]
- Saito, K., I. Wada, M. Tamura, and M. Kinjo. 2004. Direct detection of caspase-3 activation in single live cells by cross-correlation analysis. Biochem. Biophys. Res. Commun. 324:849–854. [DOI] [PubMed] [Google Scholar]
- Sandhoff, R., H. Grieshaber, R. Djafarzadeh, T.P. Sijmonsma, A.E. Proudfoot, T.M. Handel, H. Wiegandt, P.J. Nelson, and H.J. Gröne. 2005. Chemokines bind to sulfatides as revealed by surface plasmon resonance. Biochim. Biophys. Acta. 1687:52–63. [DOI] [PubMed] [Google Scholar]
- Simon, H., Y. Gao, N. Franki, and R.M. Hays. 1993. Vasopressin depolymerizes apical F-actin in rat inner medullary collecting duct. Am. J. Physiol. 265:C757–C762. [DOI] [PubMed] [Google Scholar]
- Tajika, Y., T. Matsuzaki, T. Suzuki, A. Ablimit, T. Aoki, H. Hagiwara, M. Kuwahara, S. Sasaki, and K. Takata. 2005. Differential regulation of AQP2 trafficking in endosomes by microtubules and actin filaments. Histochem. Cell Biol. 124:1–12. [DOI] [PubMed] [Google Scholar]
- Takamori, S., M. Holt, K. Stenius, E. Lemke, M. Grønborg, D. Riedel, H. Urlaub, S. Schenck, B. Brügger, P. Ringler, et al. 2006. Molecular anatomy of a trafficking organelle. Cell. 127:831–846. [DOI] [PubMed] [Google Scholar]
- Tamma, G., B. Wiesner, J. Furkert, D. Hahm, A. Oksche, M. Schaefer, G. Valenti, W. Rosenthal, and E. Klussmann. 2003. The prostaglandin E2 analogue sulprostone antagonizes vasopressin-induced antidiuresis through activation of Rho. J. Cell Sci. 116:3285–3294. [DOI] [PubMed] [Google Scholar]
- Tamma, G., M. Carmosino, M. Svelto, and G. Valenti. 2005. Bradykinin signaling counteracts cAMP-elicited aquaporin 2 translocation in renal cells. J. Am. Soc. Nephrol. 16:2881–2889. [DOI] [PubMed] [Google Scholar]
- Temm-Grove, C.J., W. Guo, and D.M. Helfman. 1996. Low molecular weight rat fibroblast tropomyosin 5 (TM-5): cDNA cloning, actin-binding, localization, and coiled-coil interactions. Cell Motil. Cytoskeleton. 33:223–240. [DOI] [PubMed] [Google Scholar]
- Temm-Grove, C.J., B.M. Jockusch, R.P. Weinberger, G. Schevzov, and D.M. Helfman. 1998. Distinct localizations of tropomyosin isoforms in LLC-PK1 epithelial cells suggests specialized function at cell-cell adhesions. Cell Motil. Cytoskeleton. 40:393–407. [DOI] [PubMed] [Google Scholar]
- Valenti, G., G. Procino, M. Carmosino, A. Frigeri, R. Mannucci, I. Nicoletti, and M. Svelto. 2000. The phosphatase inhibitor okadaic acid induces AQP2 translocation independently from AQP2 phosphorylation in renal collecting duct cells. J. Cell Sci. 113:1985–1992. [DOI] [PubMed] [Google Scholar]
- Valenti, G., G. Procino, G. Tamma, M. Carmosino, and M. Svelto. 2005. Aquaporin-2 trafficking. Endocrinology. 146:5063–5070. [DOI] [PubMed] [Google Scholar]
- Vitavska, O., H. Merzendorfer, and H. Wieczorek. 2005. The V-ATPase subunit C binds to polymeric F-actin as well as to monomeric G-actin and induces cross-linking of actin filaments. J. Biol. Chem. 280:1070–1076. [DOI] [PubMed] [Google Scholar]
- Xu, X., J.G. Forbes, and M. Colombini. 2001. Actin modulates the gating of Neurospora crassa VDAC. J. Membr. Biol. 180:73–81. [DOI] [PubMed] [Google Scholar]
- Yamashita, Y., K. Hirai, Y. Katayama, K. Fushimi, S. Sasaki, and F. Marumo. 2000. Mutations in sixth transmembrane domain of AQP2 inhibit its translocation induced by vasopressin. Am. J. Physiol. Renal Physiol. 278:F395–F405. [DOI] [PubMed] [Google Scholar]
Associated Data
This section collects any data citations, data availability statements, or supplementary materials included in this article.