Abstract
The calculated folding thermodynamics of a simple off-lattice three-helix-bundle protein model under equilibrium conditions shows the experimentally observed protein transitions: a collapse transition, a disordered-to-ordered globule transition, a globule to native-state transition, and the transition from the active native state to a frozen inactive state. The cooperativity and physical origin of the various transitions are explored with a single “optimization” parameter and characterized with the Lindemann criterion for liquid versus solid-state dynamics. Below the folding temperature, the model has a simple free energy surface with a single basin near the native state; the surface is similar to that calculated from a simulation of the same three-helix-bundle protein with an all-atom representation [Boczko, E. M. & Brooks III, C. L. (1995) Science 269, 393–396].
Keywords: Lindemann criterion, two-state transition, disordered and ordered globules, surface molten solid
An understanding of the thermodynamics of proteins is required for a solution of the folding problem (1). Proteins are known to have complex phase behavior consisting of the denatured (random) coil state, often a more or less structured compact globule state and the well-defined native state (1, 2). In addition, certain proteins have been shown to undergo a transition from a native state that is active at physiological temperatures to a low-temperature “glassy” state that is not (3–5). In this paper, we use an off-lattice heteropolymer model that has a structure similar to a three-helix-bundle fragment of Staphylococcus aureus protein A (6, 7) and discrete molecular dynamics to investigate the phase behavior. Such simplified models, whose thermodynamics can be fully characterized computationally, are an important source of information about the essential factors involved in protein folding. The present model exhibits the most important transitions of proteins. The behavior is determined by a single model parameter. In particular, the collapsed globule state can be changed from being essentially disordered to one with significant native secondary structure by varying the parameter.
Theoretical Method
Model.
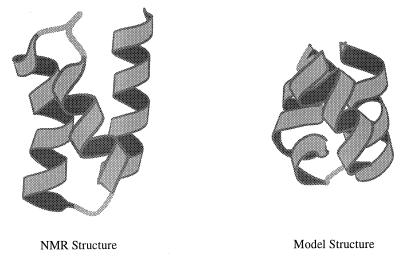
The model consists of 46 freely jointed beads, each of which represents an amino acid residue that can interact with other residues via a square-well potential (8). To obtain the global minimum structure for the model (Fig. 1), the 46 beads were initially placed at the Cα positions of the protein (6). The bond length σb is chosen to be 3.80 Å, the average Cα–Cα virtual-bond distance. The bond length is allowed to vary freely between 0.9σb and 1.1σb (8, 10). The hard-core diameter, σc, is chosen to be 4.27 Å, which is the minimum distance between two “nonbonded” Cα atoms found in the original three-helix-bundle structure. The square-well diameter σd is 1.5σc = 6.41 Å, an interaction cutoff distance that is close to 6.5 Å used by Miyazawa and Jernigan (11) to derive empirical pair contact energy parameters. Because no side chains are present, the model must contract from the actual structure to obtain reasonable packing. The structure was annealed from T* = 1 to T* = 0.001 for 200 million collisions (8, 10) during which the original 97 native contacts were kept intact. The final structure (Fig. 1) has reasonable packing with 254 contacts and a radius of gyration of 6.8 Å that is smaller than the original one (9.3 Å). To obtain a model with the minimum number of parameters, only two types of residue interactions were used. The 254 contacts that exist in the three-helix-bundle global minimum structure have a well-depth of BNɛ, and all other possible contacts are assigned the value BOɛ (BO > BN), where ɛ determines the energy scale. This Gō-type potential (12) makes it possible to relate the thermodynamic properties of the model protein to the “bias gap”, g (g = 1 − BO/BN) and the reduced temperature T* (T* = T/ɛ). The bias gap is a measure of the difference in stability between the global minimum contacts and other contacts; it has been used as an optimization parameter in the design of lattice models with stable structures (13). A value of g near or greater than 1 corresponds to a large stabilization energy of the global minimum structure, relative to other collapsed structures, and g near zero means that all contacts result in similar stabilization (ɛ < 0), as for a homopolymer (8).
Figure 1.
(Left) The three-helix-bundle protein [residues 10–55 of the B domain of Staphylococcus aureus protein A (Protein Data Base accession no. 1bdd) (6)]; the same 46 residue protein was used in ref. 7. (Right) The global energy-minimum structure for the model. [Drawn with molscript (9).]
Simulation.
Constant-temperature collision-driven discontinuous molecular dynamics simulations (8, 10) were made at g = 1.3, 1, 0.7, 0.5, and 0.3. Each model was simulated for between 11 and 30 reduced temperatures ranging from 0.1 to 5. For every temperature, five simulations (different initial configuration and velocities) were made to estimate statistical errors. Depending on the temperature, the simulations involve from 10 million to 1 billion collisions, the first half of which (equilibration) was discarded. For low-temperature simulations, the random initial configuration is annealed from high temperature (e.g., T* = 1) or slowly heated from the global minimum structure before starting an equilibrium average. This avoids the possibility that the system might be kinetically trapped in local free-energy minima. In the simulation, the time-averaged energy and squared energy are obtained. The heat capacity is calculated from the energy fluctuations (14). The thermodynamic properties at the temperatures that are not simulated are obtained by use of the weighted histogram method (10, 15), which is a least-square-optimization method for extracting the degeneracy factor of the energy levels from simulations at several temperatures so that the partition function can be determined. The radius of gyration and the average fraction of common global-minimum contacts were also obtained during the simulation.
Lindemann Parameter.
The Lindemann parameter, that is often used for characterizing the solid-to-liquid transition (16, 17), is defined as ΔL = (Σi 〈MSFi〉cf/N)½/σc, where N is 46, σc is the hard core diameter (σc = 4.27 Å), and MSFi is the mean-squared fluctuation for bead i (after the translation and rotation of the entire molecule are removed). Because ΔL is a sum over all atomic contributions, it is also useful to define partial Lindemann parameters for different portions of the system. In particular, we introduce ΔLin, the Lindemann parameter for the interior of the system, which is defined as a sphere located at the center of mass with a radius of 0.8 σc.
Results
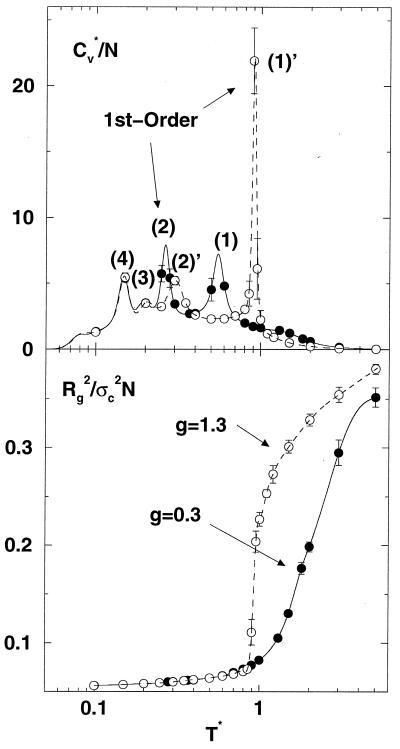
Fig. 2 shows the heat capacity Cv and squared radius of gyration Rg2 as a function of temperature for models with a bias energy gap equal to 0.3 and 1.3, respectively. There are four apparent peaks in the Cv curve that correspond to transitions between different states (18). Starting from high temperature, the first peak at T* = 0.9 in the large-gap model (g = 1.3) coincides with the strong collapse transition shown in the Rg2 curve. For the g = 0.3 model, the first well-defined peak occurs at a much lower temperature (T* = 0.55) and the collapse transition is weak; it appears as a plateau (or hump) at T* ∼ 1.5 in the Cv curve. Analysis of the distribution of states indicates that the first transition for the g = 1.3 model is a cooperative two-state-like transition (i.e., a bimodal distribution of potential energies representing the coil and collapsed states) and the transition at T* = 0.55 for the g = 0.3 model is continuous. The opposite is true for the transition represented by the second peak; i.e., it is first-order-like for the g = 0.3 model but not for the g = 1.3 model.
Figure 2.
The reduced heat capacity, Cv* (= Cv/kB) and the reduced squared radius of gyration per bead, Rg2/σc2N, as a function of temperatures. The lines in Cv* curves are obtained from the weighted histogram method (10, 15). The lines in Rg2 (dashed line, g = 1.3; solid line, g = 0.3) are from a spline fit. Error bars are less than the size of points excepted as shown.
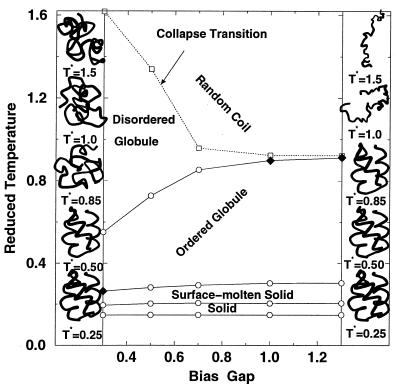
On the basis of the transition temperatures obtained from the Cv and Rg2 curve (Fig. 2), a phase diagram as a function of the reduced temperature T* and the bias gap g can be constructed (Fig. 3). The figure also shows structures associated with the states that are stable at different temperatures for the limiting cases, g = 0.3 and g = 1.3, whose Cv and Rg2 variation is presented in Fig. 2. At high T*, the random coil is stable and the transition temperature to a collapsed globule is sensitive to the bias gap. This is in accord with the fact that the contacts are stronger on average for small g so that the collapse transition moves to higher T*. Depending on g, the globule resulting from the collapse transition has different structural properties. For small g (g < 0.5), a disordered globule with little native secondary structure results from collapse and the globule is stable over a wide temperature range. As g increases, a more ordered (molten) globule with much of the secondary structure (60–90% helical contents) and some of the tertiary structure (30–80%) of the three-helix-bundle results from the collapse transition.
Figure 3.
Phase diagram of the three-helix-bundle protein along with the structures for g = 0.3 (Left) and g = 1.3 (Right) at selected temperatures. Four transitions (open circles connected by solid lines) are found from the peaks in the heat capacity. The collapse transition (open squares connected with dotted lines) was determined from the temperature at which dRg2/dT, the temperature derivative of the squared radius of gyration, is a maximum (see Fig. 2). All lines are drawn to serve as a guide. The first-order-like two-state transitions are indicated by a solid diamond. The structures shown for disordered globules and random coils are typical instantaneous structures and the structures for ordered globules and surface-molten solid are average structures; the average structures are obtained by averaging over 0.2–2 million configurations after removing translational and rotational motions by minimizing rms deviations with respect to the first configuration. [Drawn with molscript (9).]
To analyze the dynamics of the collapsed globule, we use the Lindemann parameter ΔL (16), which has been shown to be less than or equal to a critical value (0.10–0.14) for the solid state of many different substances and significantly greater than that for the liquid state (17). The values of ΔL for the collapsed globule depend somewhat on g and the temperature; they are in the range 0.2–1.0 for the ordered globule and greater than 1 for the disordered globules. Thus, they are both liquid-like in their dynamics.
For proteins, both disordered (premolten) and ordered (molten) globules have been observed during folding and unfolding (2, 19–22). Many proteins have an ordered (molten) globule phase that is stable under appropriate conditions (e.g., low pH and denaturants) (2). A first-order-like transition from the ordered globule to a disordered globule or the random coil has been observed in the presence of denaturants for certain proteins (2, 22). In the present model, the transition from the random coil to an ordered globule (specific collapse) is first-order-like but the disordered globule to ordered globule transition is “continuous.”
The higher temperature portion of the phase diagram described so far corresponds to the usual phase diagram of “protein-like” lattice models (23–25) and the predications of heteropolymer theories (26, 27); i.e., they show three states corresponding to a random coil, a disordered globule, and a highly ordered globule, the latter of which is often associated with the native state in such models (27). Further, the disordered globule phase has a triangular shape and the three phases meet at a triple point (Fig. 3 of this paper and figures 1–3 of ref. 23).
What is striking in the present off-lattice model and contrasts with most lattice model results is that the low-temperature portion of the phase diagram shows additional transitions. These transitions are relatively insensitive to the bias gap over the range 0.3 < g < 1.3 (Fig. 3). This is true because there are no major changes in structure and most of the contacts, independent of the state, are strong contacts (BNɛ). The transition at T* ∼ 0.3 (see Fig. 3) goes from the collapsed globule state to a state with more than 80% of the nonlocal contacts (|i − j| > 4) in the global minimum structure and an rms deviation of less than 1 Å relative to that structure. This state corresponds to the native state of the protein. It has a solid-like interior and a liquid-like surface (10, 28), as measured by the Lindemann criterion (16, 17) (i.e., ΔLin < 0.1 and 0.1 < ΔL < 0.2). For the small bias gap model (g ≅ 0.3), the transition to the native state is first-order-like, but it is not for the larger gap model (see also below).
At a lower temperature (T* ∼ 0.2), there is a much weaker transition (Fig. 2) that involves no structure changes (rms deviation < 1 Å), but the Lindemann parameter for the entire structure is now ΔL ≅ 0.1; i.e., the system changes from one that has a solid core with a fluid surface to one that is frozen (solid) throughout (28). This corresponds to the inactive “glassy” state observed in a number of proteins (3–5). If one assigns an energy scale such that T* ∼ 0.3, the native to globule melting transition temperature, corresponds to 350 K (ɛ = 2.3 kcal/mol; 1 cal = 4.184 J) the transition to the “glassy” state is at about 230 K, in satisfactory agreement with experiment (3, 4). At an even lower temperature (T* = 0.15, 175 K), there is an additional transition that involves subtle changes in the orientational order. A transition at 170 K in the dynamics of ligand binding to myoglobin has been observed (3). The transition also appears in a series of all-atom simulations of crambin and at different temperatures (Y.Z., D. Vitkup, M.K, unpublished results).
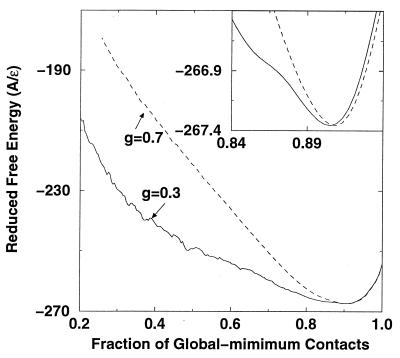
Fig. 4 shows that the average free energy at T* = 0.25 (280 K), a temperature where the native state is stable, as a function of Q, the fraction of the global minimum contacts. For low g (g = 0.3) and high g (g = 0.7), there is a free energy minimum at Q ≅ 0.9, corresponding to the fact that the average structure does not have all of the contacts of the minimum energy structure at a finite temperature. At g = 0.7, the curve decreases smoothly and there is no free energy barrier, but for g = 0.3, the free energy surface is somewhat rougher and there is a weak free energy barrier close to the native state near Q = 0.87 (the barrier is about 0.2 kcal/mol). These results can be compared with the free energy curve as a function of the radius of gyration obtained in a simulation by Boczko and Brooks (7) of the same three-helix-bundle protein with a fully solvated all-atom model. They found a similar, rather smooth, free energy surface with a small free energy barrier (∼0.5 kcal/mol) close to the native state. In addition, there is a transition state with 30% tertiary and 50–70% helical contacts (29), which compares well with 30–50% tertiary and 60–70% helical contents in the present model at the disordered to ordered globule transition temperature.
Figure 4.
Reduced free-energy landscape A* (A* = A/ɛ) at T* = 0.25 (the surface-molten-solid phase) for g = 0.3 and g = 0.7, as a function of the fraction of global-minimum contacts Q. The results were obtained with the weighted histogram method (10, 15). The larger gap model has a smoother landscape. There is a small free-energy barrier for g = 0.3 at Q ≈ 0.87; it yields a weakly bimodal potential energy distribution at the transition temperature (data not shown).
Concluding Discussion
The success of the present model of a three-helix bundle in reproducing the transitions observed in proteins indicates that it may be possible to describe certain fundamental aspects of protein thermodynamics in relatively simple terms. For example, the model shows that the nature of the coil-to-globule transition is very sensitive to the bias gap, but that the other transitions (globule to active native or active native to “glassy” inactive state) are much less so, as is the overall free energy diagram. That the globule to native state transition is weaker than in real proteins may suggest that side-chain packing, which is not included in the present model, is important for this aspect of protein folding. Nevertheless, certain aspects of the essential relationship between the amino acid sequence and the structure of a protein are included, as illustrated by the specific protein-like structure of the native state.
Acknowledgments
We thank Aaron R. Dinner for helpful discussion and Charles L. Brooks, III for providing a copy of the paper (29) before publication. This work was supported by a grant from the National Science Foundation and a grant from Pittsburgh Supercomputing Center. The Protein Data Bank provided the structure (1bdd) before its release after obtaining approval from the authors (6). Y.Z. is a National Institutes of Health Postdoctoral Fellow.
References
- 1.Karplus M, Shakhnovich E I. In: Protein Folding. Creighton T, editor. New York: Freeman; 1992. pp. 127–195. [Google Scholar]
- 2.Ptitsyn O B. Adv Protein Chem. 1995;47:83–230. doi: 10.1016/s0065-3233(08)60546-x. [DOI] [PubMed] [Google Scholar]
- 3.Austin R H, Beeson K W, Eisenstein L, Frauenfelder H, Gunsalus I C. Biochemistry. 1975;14:5355–5373. doi: 10.1021/bi00695a021. [DOI] [PubMed] [Google Scholar]
- 4.Rasmussen B F, Stock A M, Ringe D, Petsko G A. Nature (London) 1992;357:423–424. doi: 10.1038/357423a0. [DOI] [PubMed] [Google Scholar]
- 5.Ferrand M, Dianoux A J, Petry W, Zaccai G. Proc Natl Acad Sci USA. 1993;90:9668–9672. doi: 10.1073/pnas.90.20.9668. [DOI] [PMC free article] [PubMed] [Google Scholar]
- 6.Gouda H, Torigoe H, Saito A, Sato M, Arata Y, Shimada I. Biochemistry. 1992;31:9665–9672. doi: 10.1021/bi00155a020. [DOI] [PubMed] [Google Scholar]
- 7.Boczko E M, Brooks C L., III Science. 1995;269:393–396. doi: 10.1126/science.7618103. [DOI] [PubMed] [Google Scholar]
- 8.Zhou Y, Hall C K, Karplus M. Phys Rev Lett. 1996;77:2822–2825. doi: 10.1103/PhysRevLett.77.2822. [DOI] [PubMed] [Google Scholar]
- 9.Kraulis P J. J Appl Cryst. 1991;24:946–950. [Google Scholar]
- 10.Zhou, Y., Karplus, M., Wichert, J. M. & Hall, C. K. (1997) J. Chem. Phys., in press.
- 11.Miyazawa S, Jernigan R L. Macromolecules. 1985;18:534–552. [Google Scholar]
- 12.Taketomi H, Ueda Y, Go N. Int J Peptide Protein Res. 1975;7:445–459. [PubMed] [Google Scholar]
- 13.Abkevich V I, Gutin A M, Shakhnovich E I. Folding Design. 1996;1:221–230. doi: 10.1016/S1359-0278(96)00033-8. [DOI] [PubMed] [Google Scholar]
- 14.Friedman H L. A Course in Statistical Mechanics. Englewood Cliffs, NJ: Prentice–Hall; 1985. [Google Scholar]
- 15.Ferrenberg A M, Swendsen R H. Phys Rev Lett. 1989;63:1195–1197. doi: 10.1103/PhysRevLett.63.1195. [DOI] [PubMed] [Google Scholar]
- 16.Lindemann F A. Physik Z. 1910;11:609–612. [Google Scholar]
- 17.Stillinger F H. Science. 1995;267:1935–1939. doi: 10.1126/science.267.5206.1935. [DOI] [PubMed] [Google Scholar]
- 18.Beattle J A, Oppenheim I. Principles of Thermodynamics. Amsterdam: Elsevier; 1979. [Google Scholar]
- 19.Agashe V R, Shastry M C R, Udgaonkar J B. Nature (London) 1995;377:754–757. doi: 10.1038/377754a0. [DOI] [PubMed] [Google Scholar]
- 20.Sosnick T R, Mayne L, Englander S W. Proteins. 1996;24:413–426. doi: 10.1002/(SICI)1097-0134(199604)24:4<413::AID-PROT1>3.0.CO;2-F. [DOI] [PubMed] [Google Scholar]
- 21.Jacob M, Schindler T, Balbach J, Schmid F X. Proc Natl Acad Sci USA. 1997;94:5622–5627. doi: 10.1073/pnas.94.11.5622. [DOI] [PMC free article] [PubMed] [Google Scholar]
- 22.Uversky V N, Ptitsyn O B. J Mol Biol. 1996;255:215–228. doi: 10.1006/jmbi.1996.0018. [DOI] [PubMed] [Google Scholar]
- 23.Dinner A, Sali A, Karplus M, Shakhnovich E I. J Chem Phys. 1994;101:1444–1451. [Google Scholar]
- 24.Doniach S, Garel T, Orland H. J Chem Phys. 1996;105:1601–1607. [Google Scholar]
- 25.Gutin A M, Abkevich V I, Shakhnovich E I. Biochemistry. 1995;34:3066–3076. doi: 10.1021/bi00009a038. [DOI] [PubMed] [Google Scholar]
- 26.Shakhnovich E I, Gutin A M. Biophys Chem. 1989;34:187–199. doi: 10.1016/0301-4622(89)80058-4. [DOI] [PubMed] [Google Scholar]
- 27.Plotkin S S, Wang J, Wolynes P G. J Chem Phys. 1997;106:2932–2948. [Google Scholar]
- 28.Frauenfelder H, Petsko G A, Tsernoglou D. Nature (London) 1979;280:558–563. doi: 10.1038/280558a0. [DOI] [PubMed] [Google Scholar]
- 29.Guo Z, Brooks C L, III, Boczko E M. Proc Natl Acad Sci USA. 1997;94:10161–10166. doi: 10.1073/pnas.94.19.10161. [DOI] [PMC free article] [PubMed] [Google Scholar]


