

Abstract
We evaluated the region-to-region correlation, laterality and asymmetry of amyloid deposition in subjects with mild cognitive impairment (MCI) or Alzheimer's Disease (AD) using the amyloid tracer, Pittsburgh-Compound B (PiB). Seventeen subjects, including 7 with MCI (MMSE 26.7 ± 2.4) and 10 with AD (MMSE of 24.8 ± 2.7) underwent PiB imaging. Measures of laterality (i.e. group-wise predilection for right or left) and asymmetry (i.e. group-wise predilection for unequal PiB retention between the two hemispheres) were calculated for seventeen Regions of Interest (ROIs). Regional correlations were calculated along with within-group and between-groups statistical analyses of laterality and asymmetry metrics. The median correlation between PiB retention across all pairs of ROIs was 0.65, with highest correlations found in areas of highest PiB retention, (r = 0.74). Overall, PiB retention was symmetric bilaterally, but there was PiB laterality in MCI in dorsal frontal cortex [(t(6) = 3.05, p = 0.02, L>R] and sensory-motor area [t(6) = 3.10, p = 0.02, L>R] and in AD in the occipital pole (t(9) = −2.63, p = 0.03, R>L). The most significant asymmetries in PiB retention were found in sub-cortical white matter (t(6) = 3.99, p = 0.01) and middle precuneus [(t(6) = 3.57, p = 0.01] in MCI, and in lateral temporal cortex (t(9) = 3.02, p = 0.01) and anterior ventral striatum [t(9) = 2.37, p = 0.04] in AD. No group differences (AD versus MCI) were detected in laterality [F (1,15)= 0.15, p= 0.7] or asymmetry [F (1, 15) = 0.7, p = 0.42].
Introduction
Alzheimer's disease (AD) is the most common cause of clinical dementia of the elderly, diagnosed definitively after autopsy based upon the presence of two pathologic hallmarks: neurofibrillary tangles and amyloid plaques (Khachaturian, 1985; Mirra, 1991; NIA/Reagan Workgroup, 1997). Structural neuroimaging can be used to identify characteristic patterns of atrophy and to exclude other clinical conditions in order to support the diagnosis of AD (Husain and Garrett, 2005). However, molecular imaging of individuals at risk for AD has the potential to allow for definitive, even pre-symptomatic, diagnosis, evaluation of the effect of disease modifying drugs, and provide a better understanding of the underlying pathophysiology of the disease (Jagust, 2004). Such work also may result in a better understanding of mild cognitive impairment (MCI), which is thought to represent a transition phase between healthy aging and dementia (Petersen, 2004).
One such molecular imaging tool is Pittsburgh Compound-B (PiB), a thioflavin-T derivative that crosses the blood brain barrier and binds with high affinity to amyloid allowing for in vivo visualization using positron emission tomography (PET) (Klunk et al. 2004). The purpose of this study was to better understand patterns of amyloid deposition in MCI and AD, as measured by PiB PET, with respect to correlation of PiB retention across brain areas, the laterality of this retention, and the symmetry across hemispheres. To our knowledge, there have been no neuropathological or neuroimaging studies addressing the issue of region-to-region-correlation, laterality and symmetry of amyloid deposition. In the case of neuropathology research studies, this may be because only one side of the brain is typically examined histopathologically at autopsy (Braak et al, 2006). PiB PET is an ideal tool to measure symmetry and laterality of amyloid deposition, since the whole brain can be assessed simultaneously in vivo. The presence or absence of symmetrical amyloid deposition and region-to-region correlation of amyloid deposition have implications for the natural history of AD. Is amyloid deposition a global, symmetric phenomenon, that correlates across most of the brain, or does it appear lateralized on one side of the brain or in certain brain regions? For this study, we focused only on persons with AD or MCI as they consistently have measurable PiB deposition. Cognitively normal subjects were not included in this study as 75-80% lack detectable amyloid burden as measured by PiB (Klunk et al., 2004; Mintun et al., 2006).
Materials and Methods
Subjects
Approval for this study was granted by the Institutional Review Board of the University of Pittsburgh. Subjects and their caregivers provided informed consent for the PiB PET scanning protocol and related evaluations. All participants were recruited and evaluated through the University of Pittsburgh Alzheimer Disease Research Center (ADRC) and underwent detailed neurobehavioral evaluations before being given consensus diagnosis by neurologists, neuropsychiatrists, psychiatrists, and a neuroradiologist. The AD subjects met NINDS-ADRDA criteria for Probable AD (McKhann et al, 1984) and MCI subjects were classified using previously reported criteria (Lopez et al. 2000). Each subject had a Mini Mental State Exam (MMSE) administered within one day of the PiB scan. No significant differences between MCI and AD groups in either age [t(15) = 0.6, p = 0.58 ] or MMSE ](t(15) = 1.5, p = 0.15] were detected (Table 1). All subjects were right handed.
Table 1.
Human Subjects Characteristics
| Group | MCI | AD |
|---|---|---|
| MMSE | 26.7±2.4 | 24.8±2.7 |
| Age | 74.4±8.9 | 69.3±7.7 |
| Gender | (6M/1F) | (10M/0F) |
Demographic information on the study participants.
In order to focus on the symmetry of specific PiB retention to amyloid binding sites and to avoid low signal, only PiB-positive MCI and AD subjects were included in this study (i.e., no controls or PiB-negative MCI subjects (Lopresti et al., 2005). PiB-positivity was based on a subjective visual read of the image and an objective quantitative criterion requiring a standardized uptake value ratio (SUVR, see below) value of ≥1.8 units in at least one cortical ROI.
PET Imaging
Synthesis of PiB was conducted as described previously (Lopresti et al, 2005). PiB has been shown in prior work to have a high binding affinity (Kd = 1.4 nM) and specificity to amyloid in AD brains (Mathis et al, 2003) (Ikonomovic et al. 2008), (Klunk et al. 2003), (Klunk et al. 2005). PET scans were acquired using an ECAT HR+ PET scanner (Siemens Medical Solutions, Erlangen, Germany) in three-dimensional mode (63 transaxial planes, 2.4-mm thickness; in-plane resolution = 4.1 mm full-width at half-maximum over a 15.2-cm field-of-view). Following a 10-min. transmission scan acquired using rotating rods of 68Ge/68Ga, a subject's emission imaging immediately followed intravenous injection of 14.8 ± 1.6 mCi high specific activity (approximately 1 Ci/micromole) PiB. PET scanning was performed for 90 minutes and the data were corrected for radioactive decay and scatter using a model-based approach. PET image reconstruction was performed using filtered back-projection for a final reconstructed image resolution of about 6 mm.
MR Imaging
Magnetic resonance (MR) imaging was performed in all subjects to guide region-of-interest (ROI) placement and for performing partial volume correction. MR images were acquired using a Signa 1.5 Tesla scanner (GE Medical Systems, Milwaukee, WI) with a standard head coil. PET analysis focused on T1-weighted volumetric spoiled gradient-recalled (SPGR) magnetic resonance (MR) images. The SPGR sequence (TE = 5 ms, TR = 25 ms, flip angle = 40 degrees, NEX = 1; section thickness = 1.5 mm with no gap) was acquired in the coronal plane. PET-MR registration was accomplished using Automated Image Registration (Woods and Cherry, 1993).
Regions of Interest (ROIs)
ROIs were traced on the co-registered MR images according to anatomic landmarks using guidelines established within the laboratory and transferred to the dynamic PET data for regional sampling (Price et al., 2005). Each region was sampled bilaterally and data were measured from the precuneus (PRC), parietal (PAR), frontal (FRC), somatosensory-motor cortex (SMC), occipital cortex (OCC), occipital pole (OCP), the sub-cortical white matter (SWM), mesial temporal cortex (MTC; including amygdala, hippocampus, and a portion of the parahippocampal gyrus), cerebellum (CER), lateral temporal cortex (LTC), anterior cingulate gyrus (ACG), anterior-ventral striatum (AVS), and thalamus (THL). The frontal cortex was subdivided further into the dorsal frontal cortex (DFC; 5 planes above the genu of the corpus callosum) and ventral frontal cortex (VFC; 5 planes below the genu of the corpus callosum). The precuneus was subdivided further into precuneus upper (PCU; 5 planes above the most superior point of the parieto-occipital sulcus), precuneus middle (PCM; 5 planes below PCU), and precuneus lower (PCL; 5 planes below the PCM). The majority of these regions have been defined previously (Price et al., 2005). PiB retention in each ROI was reported as standardized uptake values (SUV) normalized to retention in the cerebellum during the 40-90 minute time interval (i.e., the SUVR90 as reported in Lopresti et al., 2005). The cerebellum was selected as a reference region because this area has relatively little neuritic amyloid plaque deposition (Mirra et al., 1994). The data were corrected for local grey matter atrophy (Meltzer et al., 1990; Meltzer et al., 1996).
Quantitative Analysis of PiB Laterality and Symmetry
All data were analyzed using Statistical Package for Social Science (SPSS, SPSS Inc, Chicago, IL). The laterality score was calculated using the following formula:
Determination of the group mean LS, while useful in classifying laterality of PiB retention, could miss significant asymmetries. For example, if an equal number of subjects had similar right- and left-predominant laterality in an ROI, this non-lateralized asymmetry would cancel out when the group mean was determined. To evaluate such asymmetries without regard for laterality, the absolute value of the laterality score was calculated and termed the asymmetry score (AS).
An LS distribution was considered significant if the 95% confidence interval did not include zero; left-greater-than-right if it was above 0 and right-greater-than-left if it was below 0. Within group analyses of AS were conducted by calculating standardized scores and doing paired t-tests between these scores by comparing each ROI to the region in each group that had the lowest standardized score between the mean AS and 0 (i.e. the lowest value of mean/standard deviation). This “least asymmetric region” was assumed to be symmetric for the purpose of this analysis. This proved to be the ACG for MCI and the OCP for AD. Standard distances from 0 were also calculated for LS. The AS and LS between the MCI and AD groups were compared using ANOVA with one between-subject factor (group status in this case).
To understand if PiB retention in one ROI correlated with retention in other areas, a correlation analysis was done. The Pearson correlation value, r, was computed for each ROI and median r values obtained for all ROIs and those ROIs with highest PiB retention (i.e., the subdivisions of the frontal cortex, precuneus, parietal lobe, and lateral temporal cortex).
Results
There were two main findings in this study. First, there is a high intercorrelation among the levels of PiB retention across all brain areas. The median r among all regions was 0.65 (p<0.01) and the largest intercorrelations were seen among areas of highest PiB retention (median r = 0.75), suggesting that amyloid deposition across brain regions is more of a global or multicentric phenomenon than a focal one (See Table 2).
Table 2.
Pearson Correlations Matrix of PiB Retention in Regions of Interest in All Subjects
| AVS | ACG | DFC | VFC | LTC | MTC | PCU | PCM | PCL | PAR | THL | OCC | OCP | SMC | |
|---|---|---|---|---|---|---|---|---|---|---|---|---|---|---|
| ACG | .778 | |||||||||||||
| DFC | .730 | .953 | ||||||||||||
| VFC | .705 | .956 | .993 | |||||||||||
| LTC | .620 | .906 | .920 | .927 | ||||||||||
| MTC | .757 | .722 | .631 | .605 | .617 | |||||||||
| PCU | .689 | .892 | .947 | .951 | .936 | .601 | ||||||||
| PCM | .661 | .898 | .927 | .944 | .933 | .582 | .970 | |||||||
| PCL | .600 | .877 | .883 | .902 | .942 | .562 | .922 | .973 | ||||||
| PAR | .577 | .906 | .942 | .941 | .966 | .604 | .939 | .924 | .914 | |||||
| THL | .778 | .448 | .436 | .395 | .330 | .669 | .411 | .401 | .392 | .305 | ||||
| OCC | .203 | .626 | .627 | .628 | .714 | .390 | .639 | .623 | .654 | .796 | −.106 | |||
| OCP | .256 | .645 | .618 | .611 | .703 | .465 | .597 | .603 | .656 | .792 | .009 | .961 | ||
| SMC | .559 | .764 | .774 | .751 | .867 | .609 | .805 | .747 | .785 | .852 | .466 | .636 | .636 | |
| SWM | .627 | .443 | .382 | .340 | .334 | .544 | .349 | .333 | .359 | .269 | .735 | −.061 | −.005 | .528 |
This table contains Pearson's r values for each ROI in all 17 subjects. Critical values for r values are 0.468 (p < 0.05), 0.590 (p < 0.01) and 0.708 (p < 0.001). df=15.
The second main finding was that PiB retention (and presumably amyloid deposition) is bilaterally symmetric in MCI and AD. Figure 1a shows mean LS (+/− 95% CI) for each ROI examined in MCI and the same is shown for AD in Figure 1b. Most areas show no laterality of PiB retention. While significant left-greater-than-right (L>R) laterality in PiB retention was observed in MCI in the dorsal frontal cortex (t(6) = 3.05, p = 0.02) and sensorimotor cortex [t(6) = 3.10, p = 0.02] (Table 3) and a significant right-greater-than-left (R>L) laterality was identified in the AD patients in the occipital pole (t(9) = −2.63, p = 0.03) (Table 3b), the small differences in LS and AS in all brain regions were not significant after correcting for multiple comparisons (Bonferroni correction threshold p = 0.003). Overall, the regional MCI-LS correlated significantly with the AD-LS (r=0.85; p=0.0001), suggesting that lateral preference extends across levels of disease severity, at least into early AD (Figure 2).
Figure 1a.
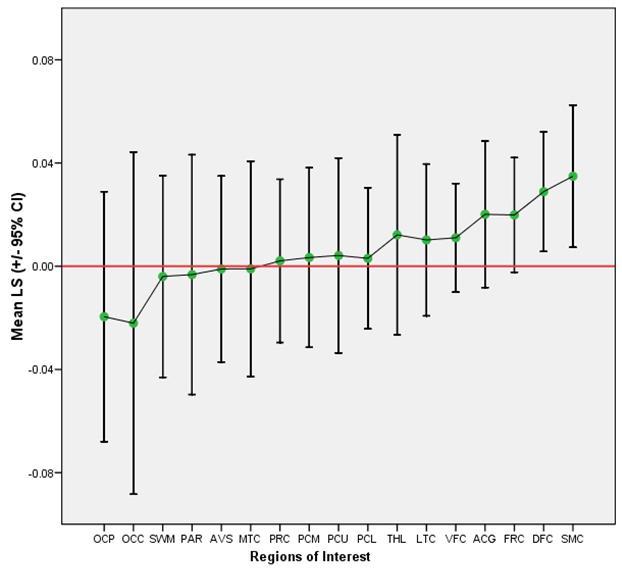
Mean LS and 95% Confidence Intervals per ROI in MCI
Figure 1b.
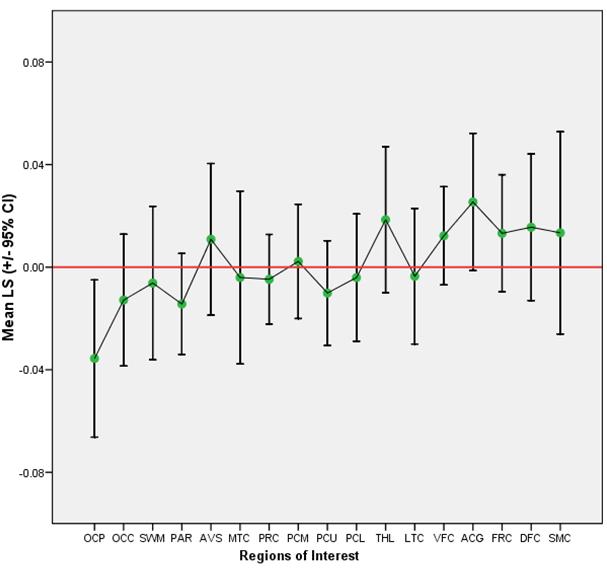
Mean LS and 95% Confidence Intervals per ROI in AD
Table 3a.
Laterality Scores in MCI per ROI
| ROI | Mean | Std. Deviation |
Maximum | Minimum | Standard Distance |
|
|---|---|---|---|---|---|---|
| Mean LS | Std. Error | LS | LS | LS | from 0.00 | |
| OCP | −.0196 | .01980 | .05238 | −.09 | .05 | −.37 |
| OCC | −.0221 | .02710 | .07169 | −.10 | .08 | −.31 |
| SWM | −.0040 | .01598 | .04227 | −.04 | .07 | −.09 |
| PAR | −.0033 | .01899 | .05024 | −.08 | .05 | −.07 |
| AVS | −.0011 | .01473 | .03898 | −.06 | .04 | −.03 |
| MTC | −.0010 | .01706 | .04512 | −.05 | .06 | −.02 |
| PRC | .0021 | .01293 | .03420 | −.04 | .05 | .06 |
| PCM | .0034 | .01422 | .03763 | −.04 | .05 | .09 |
| PCU | .0042 | .01544 | .04085 | −.05 | .07 | .10 |
| PCL | .0031 | .01117 | .02956 | −.04 | .05 | .10 |
| THL | .0122 | .01585 | .04195 | −.06 | .08 | .29 |
| LTC | .0102 | .01202 | .03180 | −.03 | .05 | .32 |
| VFC | .0110 | .00861 | .02277 | −.02 | .05 | .48 |
| ACG | .0201 | .01160 | .03070 | −.01 | .08 | .65 |
| FRC | .0199 | .00908 | .02402 | −.01 | .06 | .83 |
| DFC | .0289 | .00947 | .02504 | .00 | .07 | 1.15 |
| SMC | .0349 | .01125 | .02975 | −.01 | .08 | 1.17 |
Table 3b.
Laterality Scores in AD per ROI
| ROI | Mean | Std. Deviation |
Minimum | Maximum | Standard Distance |
|
|---|---|---|---|---|---|---|
| Mean LS | Std. Error | LS | LS | LS | from 0.00 | |
| OCP | −.0356 | .01355 | .04285 | −.11 | .01 | −.83 |
| PAR | −.0144 | .00870 | .02752 | −.04 | .05 | −.52 |
| OCC | −.0128 | .01136 | .03593 | −.07 | .04 | −.36 |
| PCU | −.0101 | .00902 | .02854 | −.05 | .04 | −.35 |
| PRC | −.0047 | .00773 | .02444 | −.05 | .03 | −.19 |
| SWM | −.0062 | .01324 | .04186 | −.07 | .05 | −.15 |
| PCL | −.0041 | .01097 | .03469 | −.07 | .05 | −.12 |
| LTC | −.0035 | .01169 | .03697 | −.07 | .06 | −.09 |
| MTC | −.0040 | .01490 | .04713 | −.09 | .08 | −.08 |
| PCM | .0023 | .00985 | .03116 | −.05 | .06 | .07 |
| SMC | .0134 | .01744 | .05514 | −.07 | .12 | .24 |
| AVS | .0109 | .01307 | .04134 | −.08 | .05 | .26 |
| DFC | .0156 | .01264 | .03996 | −.04 | .09 | .39 |
| FRC | .0132 | .01010 | .03194 | −.04 | .06 | .41 |
| VFC | .0122 | .00847 | .02679 | −.03 | .06 | .46 |
| THL | .0185 | .01261 | .03987 | −.03 | .08 | .46 |
| ACG | .0254 | .01183 | .03741 | −.02 | .08 | .68 |
Figure 2.
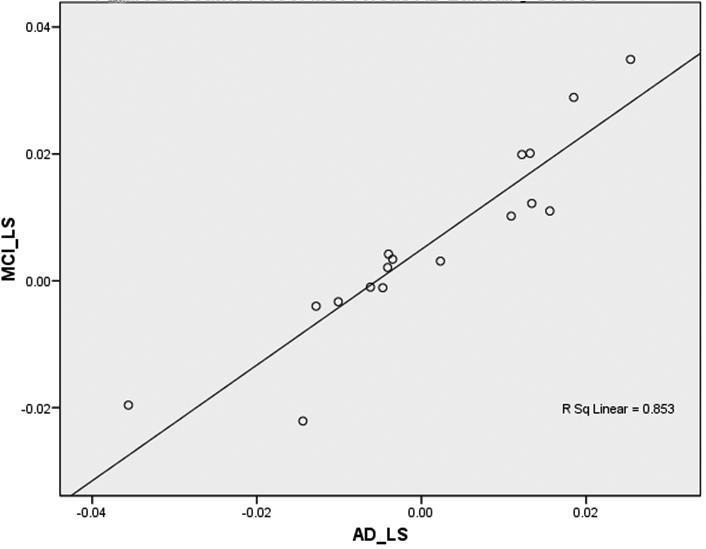
Scatter Plot of MCI versus AD Laterality Scores
Similarly, within-group analysis of AS showed little asymmetry of PiB retention in MCI and AD. In MCI, these asymmetries differed significantly from the least asymmetric region (ACG) only in the middle precuneus and sub-cortical white matter (Table 4a). In AD, the asymmetries differed significantly from the least asymmetric region (OCP) only in the AVS and LTC (Table 4b). In contrast to the correlations between LS in MCI and AD, MCI-AS and AD-AS were not correlated significantly with each other (r = 0.35, p = 0.17).
Table 4a.
Asymmetry Scores in MCI per ROI
| ROI |
Mean | Std. Deviation |
Minimum | Maximum | Standard Distance |
t-test (df = 6) |
|
|---|---|---|---|---|---|---|---|
| Mean AS | Std. Error | AS | AS | AS | from 0.00 | t, p | |
| ACG | .0245 | .01011 | .02674 | .00 | .08 | .92 | * |
| THL | .0310 | .01078 | .02853 | .00 | .08 | 1.09 | −.07, .95 |
| PCU | .0300 | .00954 | .02525 | .00 | .07 | 1.19 | −.22, .83 |
| FRC | .0240 | .00721 | .01907 | .01 | .06 | 1.26 | −1.07, .33 |
| DFC | .0302 | .00875 | .02315 | .00 | .07 | 1.30 | −.57, .59 |
| PRC | .0261 | .00738 | .01953 | .00 | .05 | 1.34 | −.54, .61 |
| PCL | .0228 | .00629 | .01664 | .00 | .05 | 1.37 | −.65, .54 |
| VFC | .0198 | .00538 | .01423 | .01 | .05 | 1.39 | −.91, .40 |
| PAR | .0396 | .01008 | .02666 | .01 | .08 | 1.49 | −.99, .36 |
| AVS | .0312 | .00744 | .01967 | .00 | .06 | 1.59 | −.89, .41 |
| SMC | .0384 | .00913 | .02414 | .01 | .08 | 1.59 | −1.03, .34 |
| OCC | .0607 | .01419 | .03755 | .01 | .10 | 1.62 | −.76, .48 |
| OCP | .0461 | .01010 | .02673 | .01 | .09 | 1.72 | −1.22, .27 |
| LTC | .0276 | .00590 | .01562 | .00 | .05 | 1.77 | −1.28, .25 |
| SWM | .0349 | .00741 | .01962 | .01 | .07 | 1.78 | −3.99, .01 |
| MTC | .0372 | .00773 | .02046 | .00 | .06 | 1.82 | −1.23, .27 |
| PCM | .0322 | .00558 | .01477 | .01 | .05 | 2.18 | −3.57, .01 |
Table 4b.
Asymmetry Score in AD per ROI
| ROI |
Mean | Std. Deviation |
Minimum | Maximum | Standard Distance |
t-test (df = 9) |
|
|---|---|---|---|---|---|---|---|
| Mean AS | Std. Error | AS | AS | AS | from 0.00 | t, p | |
| OCP | .0387 | .01258 | .03979 | .00 | .11 | .97 | * |
| DFC | .0306 | .00909 | .02873 | .00 | .09 | 1.07 | −.08, .94 |
| PCM | .0222 | .00653 | .02067 | .00 | .06 | 1.07 | −.48, .65 |
| FRC | .0250 | .00720 | .02276 | .00 | .06 | 1.10 | −.29, .77 |
| SWM | .0306 | .00869 | .02748 | .00 | .07 | 1.11 | −.17, .87 |
| OCC | .0285 | .00754 | .02385 | .00 | .07 | 1.19 | .08, .94 |
| ACG | .0345 | .00890 | .02815 | .00 | .08 | 1.23 | −.52, .62 |
| VFC | .0224 | .00573 | .01811 | .00 | .06 | 1.24 | −.47, .65 |
| PCL | .0263 | .00672 | .02126 | .01 | .07 | 1.24 | −.53, .61 |
| MTC | .0359 | .00898 | .02840 | .01 | .09 | 1.26 | −.61, .56 |
| SMC | .0438 | .01051 | .03323 | .01 | .12 | 1.32 | −.89, .39 |
| THL | .0344 | .00811 | .02565 | .00 | .08 | 1.34 | −.97, .36 |
| LTC | .0291 | .00661 | .02091 | .00 | .07 | 1.39 | 3.02, .01 |
| PAR | .0248 | .00549 | .01736 | .00 | .05 | 1.43 | −.84, .42 |
| PRC | .0198 | .00429 | .01357 | .00 | .05 | 1.46 | −.61, .56 |
| PCU | .0244 | .00515 | .01627 | .00 | .05 | 1.50 | −1.15, .28 |
| AVS | .0356 | .00656 | .02073 | .01 | .08 | 1.72 | 2.37, .04 |
=ROI with lowest standard distance score.
Finally, in an effort to identify between-group differences in the extent of the laterality and asymmetry in PiB disposition, we completed two MANOVAs using all 17 ROIs, with Group as the between-subject factor. Overall, there were no significant between-group differences in LS (F (1,15)= 0.15, p= 0.7, Partial Eta2 = 0.01) or AS (F (1, 15) = 0.7, p = 0.42, Partial Eta2 = 0.05). Thus, the extent of laterality and asymmetry across all 17 regions did not differ between groups.
Discussion
Our data indicate that the degree of PiB retention in one region of the brain was highly correlated with PiB retention in other brain areas, including those that serve very different cognitive functions. As expected, the size of this association was strongest in ROIs with highest PiB retention. This has implications for studies in which cognitive function or other imaging measures are correlated with PiB retention. A significant correlation between PiB retention in a given brain area and another measure (cognitive or imaging), does not necessarily mean that amyloid deposition in that particular brain area is driving the correlation, since the levels of amyloid across most brain regions appear to be highly correlated. One approach to this problem may be to correlate the cognitive (or imaging) parameter of interest with PiB retention across all brain regions and identify the brain area with the highest correlation. False-positive regional correlations could still result from this approach, however.
PiB deposition is generally symmetric in MCI and AD. Group status (i.e. AD or MCI) did not affect the extent of laterality or asymmetry metrics. DFC and SMC had small, yet significantly higher levels of amyloid (L>R) in the MCI subjects, as shown with LS. There was a R>L laterality in the occipital pole of AD. Bilaterally unequal PiB retention was found in SWM and PCM in MCI and in LTC and AVS in AD. Because we cannot completely exclude subcortical white matter from cortical ROIs, SWM asymmetry could potentially contribute to as well as mask the asymmetry measured in the MCI group. This does not apply to the AD group since there was no SWM asymmetry in this group or to our laterality findings since significant laterality was not detected in SWM. In addition, the importance of any asymmetry in SWM, is questionable because 1) such asymmetry was not significant upon correction for multiple comparisons; 2) there is no amyloid plaque in this region in neuropathological examination; and 3) PiB retention there mainly represents non-specific binding (Klunk et al., 2004). PiB retention therefore reflects a bilaterally symmetric phenomenon of amyloid deposition in MCI and AD. Understanding the relationships among patterns of regional PiB deposition is important; future studies that utilize latent structure analysis techniques (McIntosh, 1994) may be able to address this key question.
Because our calculation of the LS and AS involved normalization to the PiB retention in each brain region, it is possible that this procedure blunted real asymmetries in PiB retention in those areas with the highest PiB retention (i.e., in areas where the denominator would be largest). To address this concern, we repeated the analysis using a simple subtraction score between left and right ROIs and the results were identical to those reported above.
To our knowledge, this is the first study to use an in vivo tracer to analyze laterality and symmetry of amyloid deposition in MCI and AD. While caution should be taken in generalizing our results to females since the majority of subjects in this study were male, there have not been pathological studies in AD that suggest significant differences between males and females. Future studies should examine the symmetry of amyloid deposition in PiB-positive cognitively normal subjects to assess whether or not asymmetry is a component of the earliest phases of amyloid deposition in developing AD. The study of PiB positive subjects across the spectrum of normal aging, MCI, and AD will allow a better understanding of how PiB retention in a given brain area co-varies with that in other regions. The results of such studies may also provide a neuropathological/neuroimaging metric that could be useful to evaluate the role of amyloid, regional atrophy, and regional dysfunction on the expression of cognitive abnormalities, as well as provide further markers for evaluation of anti-amyloid therapeutics studies.
Acknowledgements
Supported by The National Institutes of Health: R01 AG018402, P50 AG005133, K02 AG001039, R01 AG020226, R01 MH070729, K01MH001976, R37 AG025516, P01 AG025204, The Alzheimer's Association: TLL-01-3381, The U.S. Department of Energy DE-FD02-03 ER63590.
Footnotes
Publisher's Disclaimer: This is a PDF file of an unedited manuscript that has been accepted for publication. As a service to our customers we are providing this early version of the manuscript. The manuscript will undergo copyediting, typesetting, and review of the resulting proof before it is published in its final citable form. Please note that during the production process errors may be discovered which could affect the content, and all legal disclaimers that apply to the journal pertain.
Financial Disclosures: GE Healthcare holds a license agreement with the University of Pittsburgh based on the technology described in this manuscript. Drs. Klunk and Mathis are co-inventors of PiB and, as such, have a financial interest in this license agreement. GE Healthcare provided no grant support for this specific study and had no role in the design or interpretation of results or preparation of this manuscript. All other authors have no conflicts of interest with this work. No other authors report financial disclosures.
References
- Braak H, Alafuzoff I, Arzberger T, Kreztzschmar H, Tredici K. Staging of Alzheimer disease associated neurofibrilliary pathology using paraffin sections and immunocytochemistry. Acta Neuropathologica. 2006;112:389–404. doi: 10.1007/s00401-006-0127-z. [DOI] [PMC free article] [PubMed] [Google Scholar]
- Husain MM, Garrett RK. Clinical Diagnosis and Management of Alzheimer's Disease. Neuroimag Clin NA. 2005;15(4):767–777. doi: 10.1016/j.nic.2005.09.005. [DOI] [PubMed] [Google Scholar]
- Ikonomovic MD, Klunk WE, Abrahamson EE, Mathis CA, Price JC, Tsopelas ND, Lopresti BJ, Ziolko S, Bi W, Paljug WR, Debnath ML, Hope CE, Isanski BA, Hamilton RL, Dekosky ST. Post-mortem correlates of in vivo PiB-PET amyloid imaging in a typical case of Alzheimer's disease. Brain. 2008 doi: 10.1093/brain/awn016. (in press):doi:10.1093/brain/awn1016. [DOI] [PMC free article] [PubMed] [Google Scholar]
- Jagust W. Molecular neuroimaging in Alzheimer's disease. NeuroRx. 2004;1(2):206–12. doi: 10.1602/neurorx.1.2.206. [DOI] [PMC free article] [PubMed] [Google Scholar]
- Khachaturian ZS. Diagnosis of Alzheimer's disease. Arch Neurol. 1985;42:1097–1105. doi: 10.1001/archneur.1985.04060100083029. [DOI] [PubMed] [Google Scholar]
- Klunk WE, Wang Y, Huang G-F, Debnath ML, Holt DP, Shao L, Hamilton RL, Ikonomovic MD, DeKosky ST, Mathis CA. The binding of BTA-1 to post-mortem brain homogenates is dominated by the amyloid component. Journal of Neuroscience. 2003;23:2086–2092. doi: 10.1523/JNEUROSCI.23-06-02086.2003. [DOI] [PMC free article] [PubMed] [Google Scholar]
- Klunk WE, Engler H, Nordberg A, Wang Y, Blomqvist G, Holt DP, Bergstrom M, Savitcheva I, Huang GF, Estrada S, Ausen B, Debnath ML, Barletta J, Price JC, Sandell J, Lopresti BJ, Wall A, Koivisto P, Antoni G, Mathis CA, Langstrom B. Imaging brain amyloid in Alzheimer's disease with Pittsburgh Compound-B. Ann Neurol. 2004;55:306–319. doi: 10.1002/ana.20009. [DOI] [PubMed] [Google Scholar]
- Klunk WE, Lopresti BJ, Ikonomovic MD, Lefterov IM, Koldamova RP, Abrahamson EE, Debnath ML, Holt DP, Huang GF, Shao L, DeKosky ST, Price JC, Mathis CA. Binding of the positron emission tomography tracer Pittsburgh compound-B reflects the amount of amyloid-beta in Alzheimer's disease brain but not in transgenic mouse brain. Journal of Neuroscience. 2005;25:10598–10606. doi: 10.1523/JNEUROSCI.2990-05.2005. [DOI] [PMC free article] [PubMed] [Google Scholar]
- Lopez OL, Becker JT, Klunk W, Saxton J, Hamilton RL, Kaufer DI, Sweet RA, Cidis Meltzer C, Wisniewski S, Kamboh MI, DeKosky ST. Research evaluation and diagnosis of probable Alzheimer's disease over the last two decades: I. Neurology. 2000;55(12):1854–1862. doi: 10.1212/wnl.55.12.1854. [DOI] [PubMed] [Google Scholar]
- Lopresti BJ, Klunk WE, Mathis CA, Hoge JA, Ziolko SK, Lu X, Meltzer CC, Schimmel K, Tsopelas ND, Dekosky ST, Price JC. Simplified Quantification of Pittsburgh Compound B Amyloid Imaging PET Studies: A Comparative Analysis. J Nucl Med. 2005;46:1959–1972. [PubMed] [Google Scholar]
- Mathis CA, Yang Y, Holt DP, Huang GF, Debnath ML, Klunk WE. Synthesis and Evaluation of 11C-Labeled 6-Substituted 2-Arylbenzothiazoles as Amyloid Imaging Agents. J. Med. Chem. 46(13):2470–2754. doi: 10.1021/jm030026b. [DOI] [PubMed] [Google Scholar]
- McIntosh AR, Gonzalez-Lima F. Structural equation modeling and its application to network analysis in functional brain imaging. Hum. Brain Mapp. 1994;2:2–22. [Google Scholar]
- McKhann G, Drachman D, Folstein M, Katzman R, Price D, Stadlan EM. Clinical diagnosis of Alzheimer's disease: report of the NINCDS-ADRDA Work Group under the auspices of Department of Health and Human Services Task Force on Alzheimer's disease. Neurology. 1984;34(7):939–944. doi: 10.1212/wnl.34.7.939. [DOI] [PubMed] [Google Scholar]
- Meltzer CC, Leal JP, Mayberg HS, Wagner HN, Jr, Frost JJ. Correction of PET data for partial volume effects in human cerebral cortex by MR imaging. J Comput Assist Tomogr. 1990;14(4):561–570. doi: 10.1097/00004728-199007000-00011. [DOI] [PubMed] [Google Scholar]
- Meltzer CC, Zubieta JK, Links JM, Brakeman P, Stumpf MJ, Frost JJ. MR-based correction of brain PET measurements for heterogeneous gray matter radioactivity distribution. J Cereb Blood Flow Metab. 1996;16(4):650–658. doi: 10.1097/00004647-199607000-00016. [DOI] [PubMed] [Google Scholar]
- Mintun MA, Larossa GN, Sheline YI, et al. [11C]PIB in a nondemented population: potential antecedent marker of Alzheimer disease. Neurology. 2006;67:446–52. doi: 10.1212/01.wnl.0000228230.26044.a4. [DOI] [PubMed] [Google Scholar]
- Mirra SS, Heyman A, McKeel D, Sumi SM, Crain BJ, Brownlee LM, Vogel FS, Hughes JP, van Belle G, Berg L. The Consortium to Establish a Registry for Alzheimer's Disease (CERAD). Part II. Standardization of the neuropathologic assessment of Alzheimer's disease. Neurology. 1991;41:479–486. doi: 10.1212/wnl.41.4.479. [DOI] [PubMed] [Google Scholar]
- Mirra SS, Gearing M, McKeel DW, Jr, Crain BJ, Hughes JP, van Belle G, Heyman A. Interlaboratory comparison of neuropathology assessments in Alzheimer's disease: a study of the Consortium to Establish a Registry for Alzheimer's Disease (CERAD) J Neuropathol Exp Neurol. 1994;53(3):303–15. doi: 10.1097/00005072-199405000-00012. [DOI] [PubMed] [Google Scholar]
- NIA/Reagan_Workgroup Consensus recommendations for the postmortem diagnosis of Alzheimer's disease The National Institute on Aging, and Reagan Institute Working Group on Diagnostic Criteria for the Neuropathological Assessment of Alzheimer's Disease. Neurobiol Aging. 1997;18:S1–2. [PubMed] [Google Scholar]
- Petersen R. Mild cognitive impairment as a diagnostic entity. J Intern Med. 2004;256:183–194. doi: 10.1111/j.1365-2796.2004.01388.x. [DOI] [PubMed] [Google Scholar]
- Price JC, Klunk WE, Lopresti BJ, Lu X, Hoge JA, Ziolko SK, Holt DP, Meltzer CC, DeKosky ST, Mathis CA. Kinetic modeling of amyloid binding in humans using PET imaging and Pittsburgh Compound-B. J Cereb Blood Flow Metab. 2005;25(11):1528–47. doi: 10.1038/sj.jcbfm.9600146. [DOI] [PubMed] [Google Scholar]
- Woods RP, Mazziotta JC, Cherry SR. MRI-PET Registration with automated algorithm. J. Comput. Assisted. Tomogr. 1993;17(4):536–546. doi: 10.1097/00004728-199307000-00004. [DOI] [PubMed] [Google Scholar]