Abstract
The fifth order contributions to the signals of ultrafast infrared spectrally resolved stimulated vibrational echoes at high intensities have been investigated in carbonmonoxy heme proteins. High intensities are often required to obtain good data. Intensity dependent measurements are presented on hemoglobin-CO (Hb–CO) and a mutant of myoglobin, H64V–CO. The spectrally resolved vibrational echoes demonstrate that fifth order effects arise at both the 1-0 and the 2-1 emission frequencies of the stretching mode of the CO chromophore bound at the active site of heme proteins. Unlike one-dimensional experiments, in which the signal is integrated over all emission frequencies, spectrally resolving the signal shows that the fifth order contributions have a much more pronounced influence on the 2-1 transition than on the 1-0 transition. By spectrally isolating the 1-0 transition, the influence of fifth order contributions to vibrational echo data can be substantially reduced. Analysis of fifth order Feynman diagrams that contribute in the vibrational echo phase-matched direction demonstrates the reason for the greater influence of fifth order processes on the 1-2 transition, and that the fifth order contributions are heterodyne amplified by the third order signal. Finally, it is shown that the anharmonic oscillations in vibrational echo data of Hb–CO that previous work had attributed strictly to fifth order effects arise even without fifth order contributions.
I. INTRODUCTION
Since their inception,1,2 ultrafast infrared vibrational echo experiments have become a widely used method for the investigation of complex molecular systems.3–7 In the stimulated vibrational echo experiment, three short infrared (IR) pulses, tuned to the transition frequency of the vibrations of interest, are crossed in the sample. The light-matter interactions generate a nonlinear polarization that acts as a source term in Maxwell’s equations and produces a vibrational echo pulse that emerges from the sample in a unique direction a short time after the third pulse. The vibrational echo is a third order nonlinear experiment.7 In a homodyne experiment, the intensity of the vibrational echo signal is proportional to the intensity of each of the three incoming pulses.8,9 Therefore, the signal is proportional to I3, where I is the intensity of the IR pulse that is split into the three excitation pulses. To obtain a reasonable signal, the input pulse intensity is relatively high. This can lead to complications in the experiments because higher order processes may contribute to the signal.10 In noncentrosymmetric systems, the next highest order set of processes that produce a contribution in the vibrational echo phase matched signal direction is fifth order (I5). Such contributions add additional features to the vibrational echo data and have the potential to complicate the interpretation of experiments. It might be expected that it would be relatively easy to suppress the fifth order contribution because of the steep difference in the intensity dependence, I5 versus I3. As will be shown later, the fifth order polarization actually comes in with an intensity dependence of I4 because it “heterodynes” with the third order portion of the polarization producing a cross term with I4 dependence when measured with a square law detector.
In the three-pulse vibrational echo experiment, there is one matter-radiation field interaction with each pulse that leads to the generation of the vibrational echo signal.8 For example, the first interaction produces a 0-1 coherence, that is a coherent superposition state of the ground and first excited vibrational states. The second interaction can produce a population in the first excited state vibrational level. The third interaction produces a 1-0 coherence, which gives rise to a polarization at the 1-0 transition frequency that emerges from the sample as the vibrational echo pulse. For a fifth order signal to contribute to a vibrational echo decay curve, it must produce a polarization that propagates in the same direction as the third order echo. This can occur quite easily. For example, three matter-radiation field interactions can all occur within the first pulse. In one possible pathway, the first interaction produces a 0-1 coherence; the second interaction produces a population in the first vibrationally excited state, 1; and the third interaction produces a 0-1 coherence. Thus, after the first pulse, the system is in essentially the same state as if there had been only one interaction with the first pulse. The remainder of the pulse sequence continues as it would at the third order. Two issues are of concern if fifth order contributions are mixed in with a vibrational echo signal. The first is that the time dependence of the vibrational echo decay is significantly modified by fifth order contributions. The second is that entirely new features are added to the vibrational echo signal. As will be shown later, by spectrally resolving the vibrational echo pulse and studying the 1-0 transition separately from the 2-1 transition, the first concern is negligible and the second concern can be substantially mitigated.
The spectrally resolved vibrational echo experiments presented here were conducted on the CO stretching mode of the heme proteins, hemoglobin-CO (Hb–CO) and H64V–CO. H64V is a mutant of myoglobin in which the distal histidine (residue 64) is replaced with a valine.11 Early one-dimensional studies of metal carbonyl compounds and CO bound to the active site of myoglobin (Mb–CO) noted strong oscillations9,12 in two pulse vibrational echo decays. It was found that the frequency of the oscillations is equal to the anharmonic vibrational shift, that is, the difference in frequency between the 1-0 transition and the 2-1 transition. The oscillations permit the vibrational anharmonicity to be determined, but they also must be accounted for in analyzing the vibrational echo decays to obtain information on vibrational dephasing and dynamics. The oscillations were identified as interferences between various quantum pathways (Feynman diagrams)8 that lead to the generation of the vibrational echo signal. Some pathways involve only the ground and first excited vibrational states, while other pathways involve the ground, first, and second excited vibrational states. The observations were explained by the requirement that beats would arise if the 0-1 line and the 1-2 line overlapped spectroscopically because of inhomogeneous broadening.9,12
Understanding of the anharmonic beats and other contributions to vibrational echo signals was increased by the experimental and theoretical investigations of spectrally resolved vibrational echoes, a type of multidimensional spectroscopy in which the vibrational echo signal is dispersed through a monochromator and detected as a function of wavelength.13–16 Beats were observed between taxonomically different subensembles of molecules that had overlapping spectral lines.15 This general class of beats is called accidental degeneracy beats (ADB), and can arise, for example, when the 1-2 transition of a vibrational chromophore A spectrally overlaps the 0-1 transition of another chromophore B. The 0-1 transition of A, the 1-2 transition of A, and the 0-1 transition of B must all fall within the bandwidth of the IR excitation pulses. Although the vibrational echo is detected at a single wavelength of the 1-0 transition of B, a beat will occur at the anharmonic shift frequency of A when the 2-1 transition of A is accidentally degenerate with the 1-0 transition of B. This type of beat is known to contribute significantly to the oscillations observed in the spectrally resolved stimulated vibrational echo studies of Mb–CO, which has a number of spectroscopically distinct structural substates.17
The mechanism described briefly earlier for the generation of anharmonic beats and their influence on vibrational echo data is based on the vibrational echo only having third order contributions. Hamm et al.10 studied Hb–CO, and observed anharmonic beats in the vibrational echo decay. They performed intensity dependent studies and found that the amplitudes of the beats were intensity dependent. Because of the observed intensity dependence and the fact that there is no overlap between the 0-1 and 1-2 CO stretch transitions of Hb–CO, they attributed the anharmonic beats to a fifth order mechanism. The beating in the echo decays was explained by three interactions with the first pulse followed by single interactions with the second and third pulses. The Hb–CO experiments were nonspectrally resolved and used wide spectral bandwidth (short) pulses. In a nonspectrally resolved vibrational echo, the measured decay is integrated over the echo spectrum. Therefore, contributions from distinct spectral lines were not separated.
Spectrally resolved stimulated vibrational echo experiments presented below on H64V–CO confirm the fifth order mechanism for generation of anharmonic beats at high intensities. However, they show that the beats are much more pronounced at the detection frequency of the 2-1 transition, ω21, than at the frequency of the 1-0 transition, ω10. Intensity studies demonstrate that the fifth order contributions to the 1-0 transition are quite small even at very high intensity. In contrast to Mb–CO, H64V–CO has only a single conformation resulting in a single CO stretch absorption band. The spectroscopic lines are sufficiently narrow that when the intensity is reduced, there are no anharmonic beats at either ω21 or ω10, when the fifth order contributions are negligible.
Experiments on Hb–CO are different. At high intensity, pronounced beats are observed at both ω10 and ω21, with the beats at ω21 having much greater amplitude. However, when the intensity is reduced, the ω21 beats decrease dramatically, but the beats at ω10 are unchanged. The oscillations at ω10 are intensity independent. Examination of the linear absorption spectrum shows that there is a small but significant Hb–CO substate to the blue of the main peak. This blue substate is at a frequency such that its 2-1 transition overlaps with the 1-0 transition of the main substate peak. The overlap produces intensity independent ADBs at third order. The previously reported nonspectrally resolved experiments on Hb–CO interpreted all of the observed beats as fifth order, but fifth processes are only responsible for beats at ω21. Analysis of the fifth order quantum pathways (Feynman diagrams) that contribute to the signals at ω10 and ω21 provide theoretical understanding of the larger oscillatory contributions to the ω21 signal than to the ω10 signal. The analysis is confirmed by quantitative comparison of the fifth order contributions to the two transitions.
II. EXPERIMENTAL PROCEDURES
The experimental setup has been described in detail elsewhere.17 Briefly, pulses from a Ti:sapphire oscillator are regeneratively amplified and used to pump an optical parametric amplifier (OPA). The OPA generates tunable nearly transform-limited Gaussian pulses with a time domain full width at half maximum of 150 fs and frequency bandwidth of 105 cm−1. The bandwidth was limited to provide more intensity at the relevant transitions yet be sufficiently broad to cover all relevant frequencies. The laser spot size (1/e radius of the E field) was, w0 = 150 µm. The pulse center was tuned to the center of each sample’s ω01 absorption line (1951 cm−1 for HbCO and 1969 cm−1 for H64V). The output of the OPA passed through a ZnSe rotatable polarizer that was followed by three Brewster angle germanium plates that served as a second polarizer. The polarizer/ Ge plates combinations allowed continuous attenuation of the beam intensity without changing its pointing or chirp. The intensity was monitored on a calibrated Joule meter before and after each run to monitor stability.
Following the variable attenuator, the beam was split into four beams of equal intensity. Three of the four daughter pulses were used in the experiment. Two of the pulses traversed independent computer controlled delay stages before the three pulses were refocused into the sample with a 6 in. focal length, 90° gold-coated off-axis parabolic reflector. The signal generated in the phase-matched direction was dispersed using a SPEX 0.5 m monochromator (210 lines/mm) and collected with a 32-element HgCdTe detector (Infrared Associates/ Infrared Systems Development).
Human HbA in the met form was obtained from Sigma, dissolved in 0.1 M pH 7 phosphate buffer (VWR) and passed through a 0.45 µm acetate filter. The human myoglobin mutant H64V was prepared as described previously11,18 and concentrated with a centrifugal size-exclusion filter in the same 0.1 M pH 7 phosphate buffer. A small amount of dithionite reducing agent was added to each sample to reduce the heme-Fe+3 to heme-Fe+2. The reduction was followed by stirring under a CO atmosphere for 1 h to yield either Hb–CO or H64V–CO. The samples were loaded into a custom-made sample cell with CaF2 windows and a 50 µm Teflon spacer. The concentration of each sample was 15 mM as determined from visible absorption spectroscopy.19
The procedure for fitting the experimental data was similar to that described for Mb–CO.17 The third order nonlinear polarization was obtained by including all pulse orderings in the calculation. H64V–CO is known to exist in a single substate and the ratio of substate concentrations for Hb–CO was estimated by fitting the peaks at 1951 and 1969 cm−1 in the linear absorption spectrum to two Voigt functions. The relative concentration of the two substates was assumed to be proportional to the area under the curves and was approximately 10:1 in Hb–CO. The nonlinear and linear spectra were fit simultaneously with an automated simplex minimization method. Since the experimental vibrational echo data were known to have fifth-order contributions that were not included in the calculations, the data were fit at sufficiently low intensity that fifth order contributions were negligible. As a check, the data were fit at several wavelengths around the 1-0 transition center.
III. RESULTS AND DISCUSSION
A. Intensity dependent oscillations
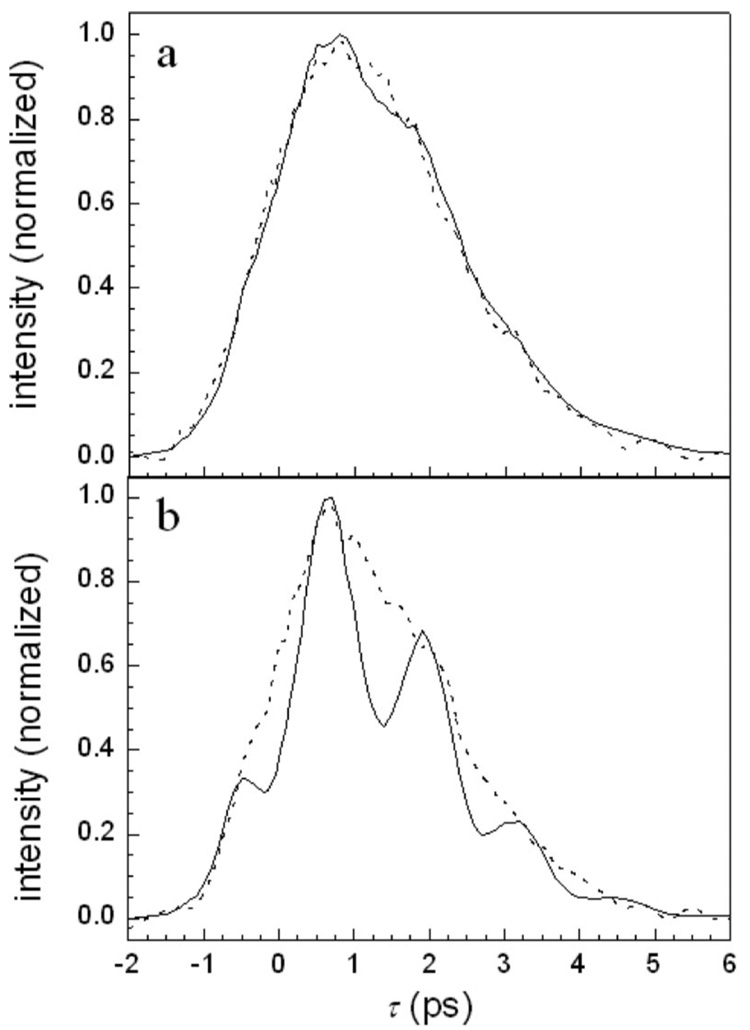
Figure 1 shows frequency slices through three-pulse vibrational echo scans for H64V–CO as a function of intensity. Figures 1(a) and 1(b) show the vibrational echo decays at 1969 and 1944 cm−1, the centers of the 1-0 and 2-1 transition frequencies, respectively. The solid curves correspond to no attenuation of the pulse intensity (7.6 GW/cm2 per pulse), and the dashed curves are the data for reduced intensity (1.4 GW/cm2 per pulse). First, consider the 2-1 data at high intensity [Fig. 1(b), solid]. The data exhibit very pronounced oscillations with a period of 1.3 ps, which corresponds to 25 cm−1. This matches the measured anharmonicity for heme-CO proteins.20 The low intensity 2-1 data [Fig. 1(b), dashed] is dramatically different from the high intensity data. Within the reduced signal-to-noise ratio, the beats are virtually undetectable. The high and low intensity scans on the 1-0 wavelength, Fig. 1(a), solid and dash curves, respectively, show some change when the intensity is reduced, but clearly, the change is much less than for the 2-1 wavelength. The high intensity 1-0 data does show evidence of beats, particularly in the data just after the curves maximum. The difference in the extent of beating in the high intensity data for the two transitions will be analyzed quantitatively later, but the important qualitative point is that there is a significant variation in the amplitude of the beats for the two transitions.
FIG. 1.
(a) H64V–CO vibrational echo decays detected at the 1-0 transition frequency. Solid curve—high intensity. Dashed curve—low intensity. (b) H64V–CO vibrational echo decays detected at the 2-1 transition frequency. Solid curve—high intensity. Dashed curve—low intensity. Note the pronounced oscillations on the 2-1 transition at high intensity.
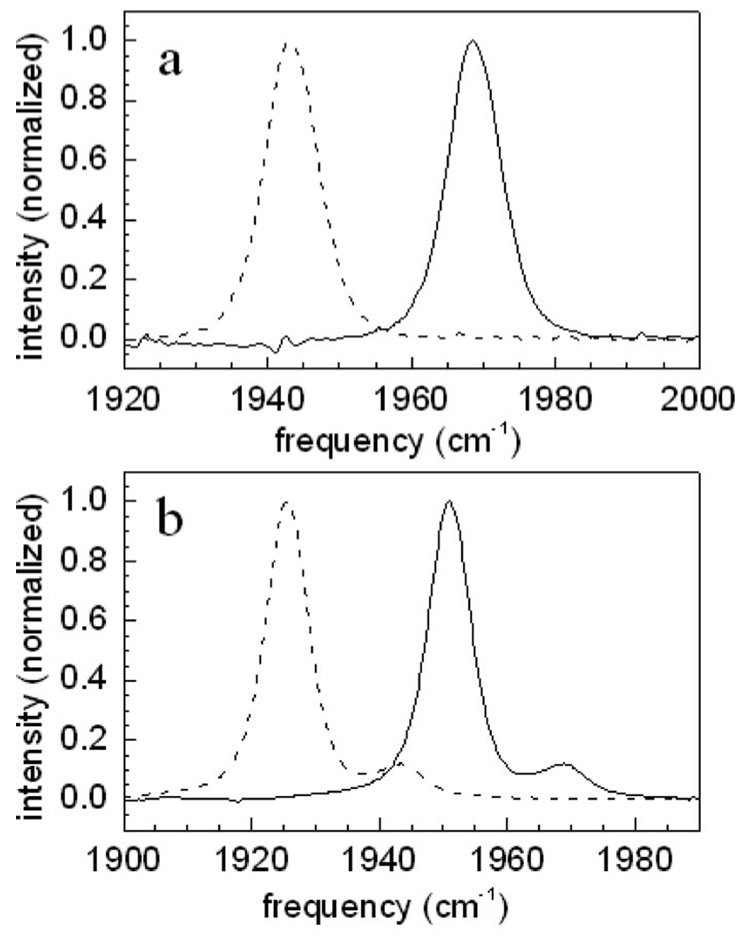
Figures 2(a) and 2(b) show background subtracted Fourier-transform infrared (FTIR) spectra of H64V–CO and Hb–CO, respectively. The solid lines are the 0-1 absorption spectra. The dashed lines represent the 1-2 spectra shifted to lower frequency by the anharmonicity. Experiments on myoglobin have shown that the 0-1 and 1-2 inhomogeneous line shapes are essentially identical.17 The H64V–CO spectrum shows a single absorption band with virtually no overlap between the 0-1 and 1-2 transitions. Thus the beats seen in Fig. 1 are inconsistent with the ADB mechanism both because of the intensity dependence and the lack of spectral overlap. In contrast, the Hb–CO spectrum displays a large absorption band and a much smaller, but significant band to the blue of the main peak. The 1-2 transition of the bluer band overlaps with the 0-1 transition of the main band, making the ADB mechanism possible.
FIG. 2.
FTIR absorption spectra. (a) H64V–CO 0-1 absorption (solid curve) and the 0-1 absorption shifted to lower energy by 25 cm−1 to model the 1-2 absorption (dashed curve). (b) Hb–CO 0-1 absorption (solid curve) and the 0-1 absorption shifted to lower energy by 25 cm−1 to model the 1-2 absorption (dashed curve). Note that the Hb–CO spectrum has a main band and a small band to the blue of the main band. The 1-2 transition of the blue band overlaps the 0-1 transition of the main band.
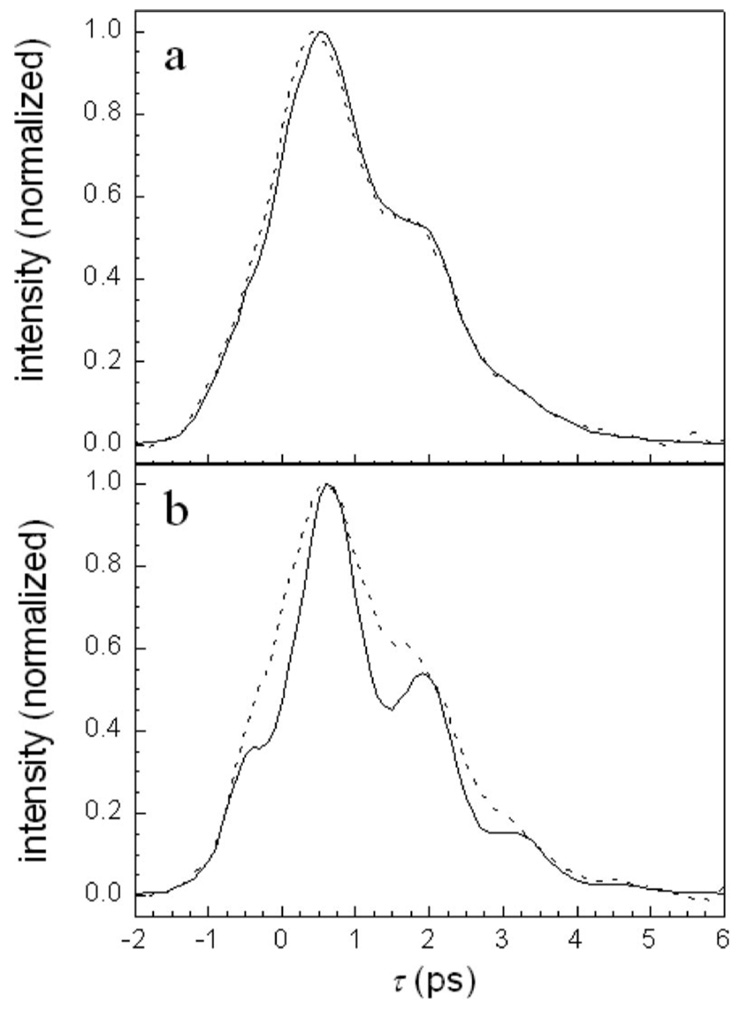
Figure 3 displays Hb–CO vibrational echo data taken at the center of the 1-0 transition (a) and at the center of the 2-1 transition (b). In each panel, data taken at high intensity (solid curve, 6.9 W/cm2 per pulse) and at lower intensity (dashed curve, 2.2 W/cm2 per pulse) are shown. In Fig. 3(b), the high intensity data show very pronounced beats. The low intensity data display greatly reduced beats. Clearly there is a very pronounced intensity dependence. In Fig. 3(a), both the high intensity and low intensity data display substantial beats. The high and low intensity data are virtually identical and further reductions in intensity (not shown) do not change the data at ω10. This is in contrast to the 1-0 transition data of H64V–CO [Fig. 1(a)] that shows a very small beat at high intensity and essentially no beat at low intensity.
FIG. 3.
(a) Hb–CO vibrational echo decays detected at the 0-1 transition frequency. Solid curve—high intensity. Dashed curve—low intensity. Note the intensity independent beats. (b) Hb–CO vibrational echo decays detected at the 1-2 transition frequency. Solid curve—high intensity. Dashed curve—low intensity. Note the pronounced oscillations on the 1-2 transition at high intensity that are substantially reduced at low intensity.
The difference between the data in Fig. 1(a) and Fig. 3(a) can be understood qualitatively from Fig. 2. H64V–CO [Fig. 2(a)] displays a single absorption band (0-1 transition) with virtually no overlap with the 1-2 transition. Therefore, the only mechanism for anharmonic beats is via a fifth order process.10 The data in Fig. 1 show that the beats are much more pronounced on the 2-1 transition than on the 1-0 transition at high intensity. The beats are virtually nonexistent at low intensity. The 0-1 transition of Hb–CO [Fig. 2(b)] also has virtually no overlap between it and the 1-2 transition. However, Hb–CO has a second substate that gives rise to a small absorption band to the blue of the main band. The 1-2 transition of this blue band overlaps with the 0-1 transition of the main band. This makes it possible to have beats at third order that are a result of ADBs.15 Because the fifth order generated beats at the 1-0 transition wavelength are small, even at high intensity, the ADB is dominant at the 1-0 transition wavelength, and the oscillations are intensity independent.
B. Model calculations
As has been discussed previously in connection with nonspectrally resolved vibrational echo experiments, fifth order processes can give rise to anharmonic beats in the vibrational echo signal.10 To understand quantitatively why fifth order processes contribute more to the 2-1 transition beats than to the 1-0 transition beats and to explain the intensity independent beats on the 1-0 transition of Hb–CO, it is necessary to compare the third and fifth order pathways for the matter-radiation field interactions that contribute to the signals detected at the emission frequencies of the two transitions.
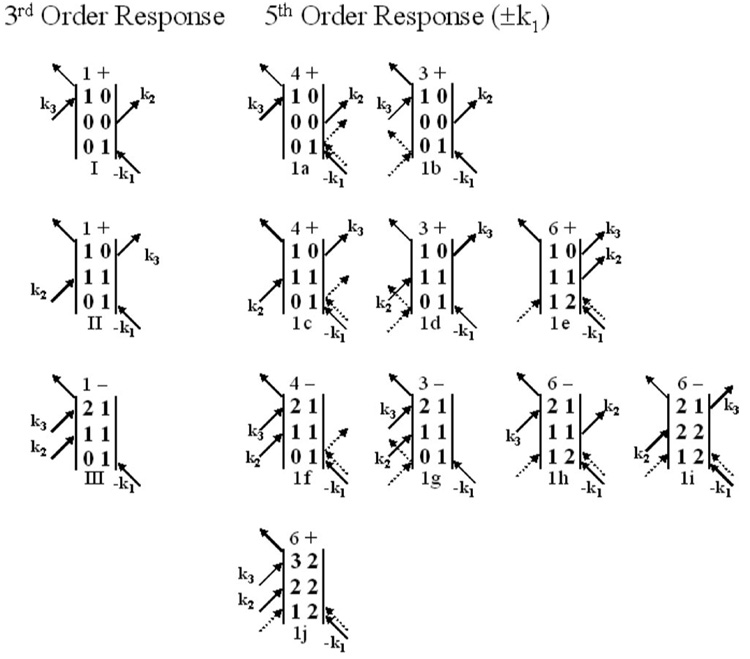
The third and fifth order Feynman diagrams responsible for generating a vibrational echo signal in the phase-matched direction are shown in Fig. 4. Only those diagrams that remain when the pulses are properly time ordered (τ, Tw>0) and do not temporally overlap are presented. The rotating wave approximation was used to eliminate oscillatory terms.8 Coherence periods within the higher order interactions are not explicitly shown and the population periods of all diagrams are included to facilitate rapid comparison between the third and fifth order signals. Interactions that would not be present in third order diagrams are shown as dashed arrows. The number of possible permutations of the incoming fields is included on top of each diagram followed by the sign of the diagram.
FIG. 4.
Third order diagrams giving rise to the vibrational echo signal and the related fifth order diagrams with the two additional radiation field-matter interactions occurring in pulse 1 (±k1). The coherence periods caused by the extra interactions are omitted, but the population periods are shown explicitly. The two additional interactions are shown as dashed arrows. Diagram 1e causes oscillations in the vibrational echo decays at the 0-1 transition frequency. Diagrams 1h and 1i cause oscillations in the vibrational echo decays at the 1-2 transition frequency. The number of permutations of the incoming fields and the sign of the diagram are shown before each diagram.
The observation that the fifth order signal is dependent on the detection frequency can be understood by analyzing the possible interaction pathways that contribute to the polarization responsible for vibrational echo generation in the phase-matched direction. In isotropic media with a center of inversion, all even order polarization components vanish.21 The macroscopic polarization induced in the sample as a result of interacting with the radiation fields can be written as
| (1) |
The third order nonlinear polarization, P(3)(t), is the first nontrivial term in the expansion of the polarization. It is generated when each of the three laser pulses interacts once with the sample. When the pulses are well separated in time, the evolution of the density matrix of the system is described by the three third order Feynman diagrams presented in the first column of Fig. 4. (At third order, there are five other diagrams that contribute to the signal near t = 0.3 These are included in third order calculations presented later. However, because the anharmonic beats are observed well after t = 0, the third and fifth order diagrams shown in Fig. 4 are sufficient to understand the relative contributions of the third and fifth order processes.) Diagrams I and II correspond to pathways that place the chromophore in either the ground or first excited vibrational state following the first two pulses, respectively. The third pulse produces a 1-0 coherence, and the vibrational echo is emitted at the 1-0 transition frequency. Diagram III corresponds to a pathway that places the vibration in the first excited state following the first two pulses. The third pulse produces a 2-1 coherence, and the vibrational echo is emitted at the 2-1 transition frequency, which is shifted from the 1-0 frequency by the anharmonicity.
The fifth order term, P(5), is created from five interactions of the radiation field with the sample. Because the third order signal is detected in the −k1+k2+k3 phase matched direction, where k1, k2, and k3 are distinct, the only fifth order contributions with the proper phase matching come from two additional interactions (with wave vectors ±k1, ±k2, or ±k3) beyond the three third order interactions. Only the interactions with wave vectors that sum to equal −k1 can produce beats when observing in the direction of the third order vibrational echo signal. To observe a beat, there must be two radiation-matter pathways that involve different frequencies during the dephasing period following the first pulse but involve the same frequency during the rephasing period following the third pulse.15 The frequencies of the oscillators that followed the two pathways during the rephasing period must be the same so that the two pathways can interfere, producing a beat in the polarization that gives rise to the vibrational echo signal.15 Rephasing pathways that involve oscillators with two different frequencies are separated by the spectral resolution of the monochromator. For this reason, Fig. 4 only has fifth order diagrams that involve two interactions from −k1 and +k1, in addition to the −k1 interaction that occurs at the third order. Because the additional two interactions occur as −k1 and +k1, their contributions to the total wave vector cancel, and the fifth order contribution to the vibrational echo propagates in the same direction as the third order contribution. The two extra interactions with wave vectors −k1 and +k1 are shown as dashed arrows in Fig. 4, and the wave vectors are not explicitly labeled.
In the experiments, the sum of the P(3) and P(5) components are detected with a square-law detector. Therefore, the signal is proportional to
| (2) |
All of the terms in Eq. (2) depend on the square of the chromophore concentration, but have different intensity and transition dipole moment dependences. The term that involves only the third order polarization scales as I3 and where I is the intensity of each of the three pulses and µ10 is the 1-0 transition dipole moment. The system is assumed to be weakly anharmonic, so that . The cross-term scales as I4 and , and the pure fifth order contribution to the total signal has a I5 and dependence. The last term in Eq. (2) can be neglected under normal experimental conditions. While the pure third order term and the third–fifth order crossterm give rise to signals at the 1-0 and 2-1 transition frequencies, only the pure fifth order term produces a signal at the 3-2 transition frequency. At the very highest intensity available in the experiments, it was possible to detect a very small vibrational echo spectral peak (fix τ and Tw and record the signal as a function of wavelength) at the 3-2 frequency. The intensity was slightly attenuated to eliminate this peak for the data presented earlier and later. However, the crossterm is non-negligible because it is heterodyne amplified by the relatively strong third order polarization.
The fifth order diagrams 1e, 1h, and 1i in Fig. 4 leave the chromophore in a 1-2 coherence after the three interactions with the first pulse (k1). The subensemble that undergoes these interaction pathways undergoes dephasing following the first pulse with the oscillators having the 1-2 transition frequency, ω21. The polarization generated by these diagrams following the third pulse interferes with the third order polarization, which always undergoes dephasing following the first pulse with the oscillators having frequency ω10. Since the frequencies of the oscillators in the fifth and third pathways during the dephasing period are different, a phase shift will accrue and manifest itself as oscillations in the frequency resolved vibrational echo signal decays. Diagram 1e involves oscillators at ω10 during the rephasing period, and emits at the 1-0 transition frequency. Therefore, diagram 1e will interfere with the third order diagrams I and II in the first column of Fig. 4 and give rise to a beat at the 1-0 transition frequency. Diagrams 1h and 1i involve oscillators at ω21 during the rephasing period and emit at the 2-1 transition frequency. Therefore, these two diagrams will interfere with the third order diagram III and give rise to a beat at the 2-1 transition frequency.
Fifth-order diagrams 1a–1d all involve oscillators only at ω10 during both the dephasing and rephasing periods. Therefore, they do not contribute to beats, although they do contribute to an increase of the vibrational echo signal emitted at ω10 (see later). Diagrams 1f and 1g involve oscillators at ω01 during the dephasing period and at ω21 during the rephasing period. This is the same as the third order diagram III. While they contribute to the vibrational echo signal emitted at ω21, they do not produce a beat. If the pure fifth order signal provided a significant contribution to the total polarization [the last term in Eq. (2) that was dropped], the interference between diagrams 1f–1g against 1h–1i would produce a beat at the ω21 emitted frequency. This is negligible in the experiments and is indistinguishable from the large amplitude beat that occurs between the third and fifth order diagrams [crossterm in Eq. (2)]. Diagram 1j is only a pure fifth order term that produces emission at ω32, and is vanishing small.
As discussed in Sec. III A, all of the oscillations in the vibrational echo decays of H64V–CO come from fifth order effects. However, as seen in Fig. 1, at high intensity where fifth order effects are non-negligible, the beats are much more pronounced on the signal emitted at ω21 than that emitted at ω10. The difference in the amplitudes at the two emission frequencies can be understood quantitatively by examining the combinations of the third and fifth order diagrams that give rise to the beats. First, two fifth order diagrams (1h and 1i) contribute to the oscillations at ω21, while only a single diagram (1e) gives rise to the oscillations at ω10. In addition, because the transition dipole moment for the 1-2 transition is larger than the 0-1 transition moment, diagrams 1h and 1i each have a factor of determining their amplitude, while the single diagram 1e only has a factor of . Therefore, the oscillations at ω21 should be a factor of 4 times larger than those at ω10. (Note that all three fifth order diagrams that contribute to the beats have permutation factors of 6. Therefore, the number of time ordered permutations of the three k1 interactions that give the same diagram do not come into the determination of the beat amplitudes.)
To test the prediction of the relative beat amplitude that is based solely on the number of diagrams and the relative transition dipole moments for the two transitions, model calculations were performed. The vibrational echo decays of H64V–CO at low intensity (Fig. 1, dashed curves) were fit with a third order theoretical model. The low intensity H64V–CO data have very small fifth order contributions. The data were fit using a time dependent diagrammatic perturbation theory formalism.8 A triexponential frequency–frequency correlation function (FFCF) was employed in the fitting.3 The excited state lifetime (22 ps) was measured with IR transient grating experiments. The anharmonicity (25 cm−1) is known from the frequency of the anharmonic beats observed at high intensity. The vibrational echo data and linear absorption spectrum were simultaneously fit with an automated simplex algorithm. The parameters of the FFCF were varied with the restriction that the FFCF would reproduce the vibrational echo decay curve as well as the linear absorption spectrum.17 Because the fitting was done with a large number of adjustable parameters and at only a single Tw, the fits are purely phenomenological and the fit parameters are not presented. The aim was to accurately reproduce the low intensity third order decays, and then use the results to extract the relative amplitudes of the ω10 (1969 cm−1) and the ω21 (1944 cm−1) fifth order beats from the high intensity data. Work is currently underway to study the H64V–CO FFCF in detail and to compare it to molecular dynamics simulations, as has been done previously for Mb–CO.17
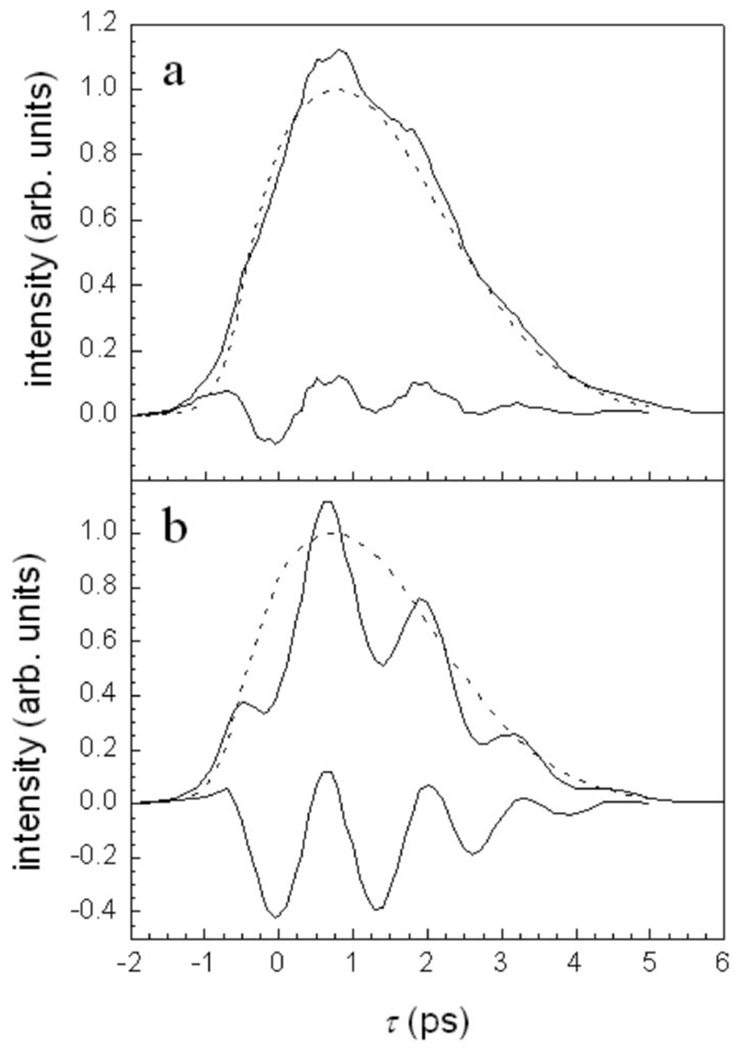
Figure 5 displays the same high intensity ω10 data (a) and ω21 data (b) that are shown in Fig. 1. The dashed curves are the fits to the low intensity data. Note that the calculated curves have no beats because at the third order there is no spectral overlap between the 0-1 and 1-2 transitions for the single H64V–CO absorption peak. Below each set of data and calculated curves are the difference curves (data minus calculated). As expected, the residuals oscillate with a period that corresponds to the anharmonicity of H64V–CO. The difference oscillations for the ω21 data are large, while those for the ω10 data are considerably smaller. The peak-null difference was determined for three oscillations after τ=0 for the two transitions. The data at τ=0 was not used because the diagrams given in Fig. 4 do not include all diagrams that occur near τ=0. For the ω10 oscillations, the peak-null difference has significant error. Nonetheless, the average ratio of the amplitude of the ω21 oscillations to the ω10 oscillations was found to be ~3.9, which is well within experimental error of the predicted factor of 4.
FIG. 5.
H64V–CO high intensity vibrational echo data (solid line), calculated third order decay (dashed line), and their difference (solid line below other two curves). (a) Detection at the 1-0 transition frequency. (b) Detection at the 2-1 transition frequency. The difference curves show the anharmonic oscillations caused by fifth order processes. The oscillations in b are a factor of ~4 larger than the oscillations in a, as predicted by theory.
In H64V–CO [Fig. 1(a)] the vibrational echo detected at ω10 shows only a small anharmonic beat at high intensity and virtually no beat at low intensity. In contrast, Hb–CO [Fig. 3(a)] shows a significant beat at ω10 at both high and low intensity and there is no measurable intensity dependence. As discussed qualitatively in Sec. III A, the small absorption caused by a structurally different protein substate to the blue of the main band will have its 1-2 transition overlapping with the 0-1 transition of the main band [see Fig. 2(b)]. This overlap can produce an anharmonic ADB at the third order. If the ADB is large compared to the fifth order beat even at high intensity, then the beat will be pronounced on the vibrational echo decay detected at ω10 and will be intensity independent. In contrast to the ω10 Hb–CO vibrational echo, the ω21 signal [Fig. 3(b)] shows an intensity dependent beat. At lower intensity, the beat is substantially reduced. At very low intensity (not shown), the beat vanishes. The intensity dependence shows that this is a fifth order beat.
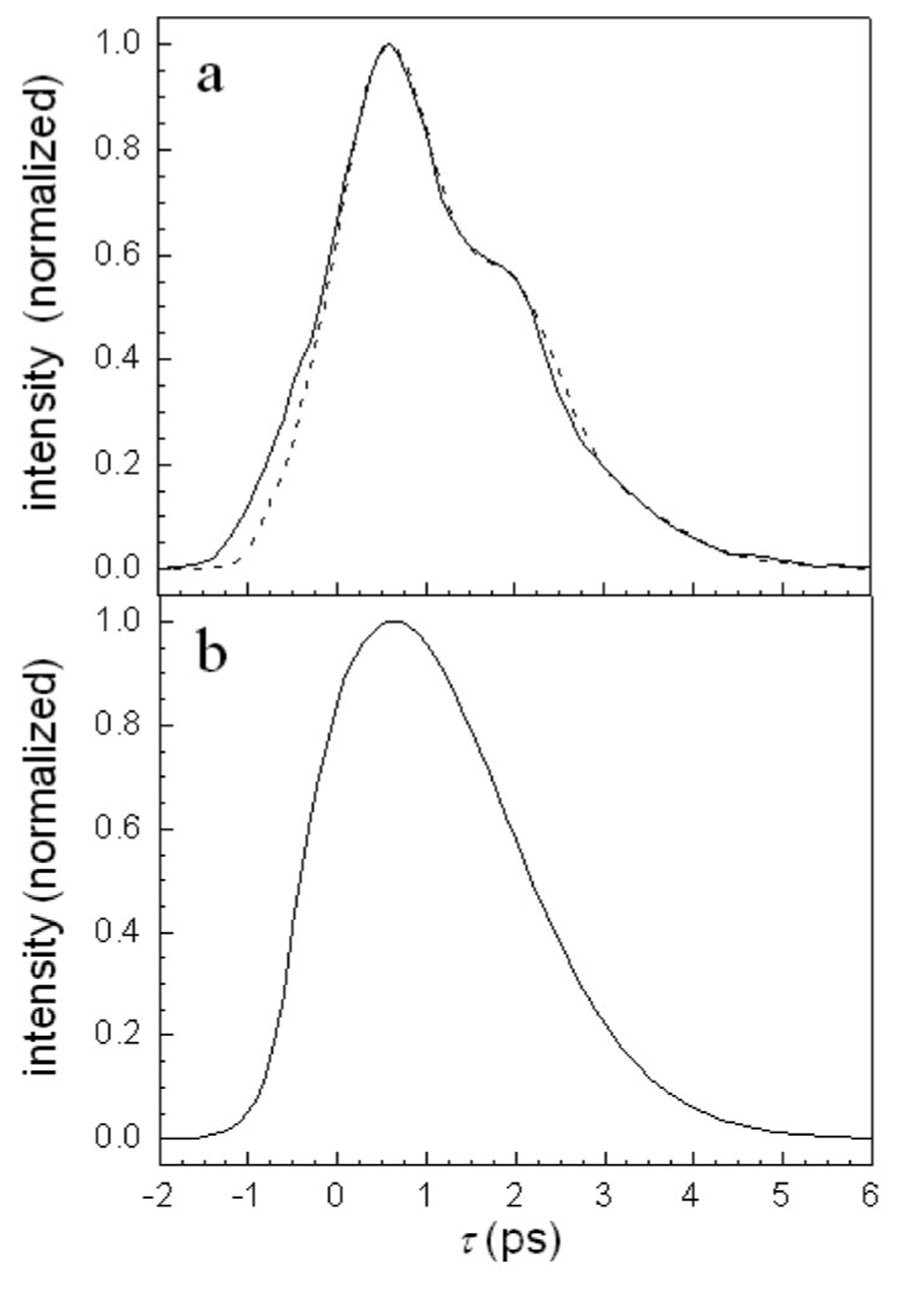
Figure 6(a) displays the Hb–CO ω10 (1951 cm−1) data (solid curve) and a third order fit to the data (dashed curve). The FFCF used in the fit was an optimized form of the triex-ponential that was published previously.3 The previous FFCF was obtained from a one-dimensional (1D) vibrational echo experiment that did not include the blue substate in the analysis and assumed that all beats on the 1D decay arose from fifth order contributions. The dynamics of the small blue substate were modeled as having the same FFCF as the main band, but its amplitude was scaled at the polarization level by the relative concentrations of the main band and the blue substate band (band areas). The blue substate was assigned the wavelength of its absorption maximum (1969 cm−1) and an anharmonicity of 25 cm−1 [see Fig. 2(b)]. The important point is that the calculations are able to accurately reproduce the data including the beats at the third order. The results demonstrate that the beat is an ADB15 rather than a fifth order effect. Figure 6(b) shows a calculation that is identical to that displayed in Fig. 6(a) except the amplitude of the blue substate band is set equal to zero. Consistent with the ADB mechanism,15 in the absence of overlap between the blue substate 1-2 transition with the main bands 0-1 transition, there are no beats.
FIG. 6.
(a) Hb–CO data at high intensity detected at the 0-1 transition frequency (solid curve) and the corresponding third order calculation which includes both the main absorption band and the blueshifted substate band. The data are accurately reproduced by the strictly third order calculation. (b) The same third order calculation without the inclusion of the blueshifted substate band. The lack of beats demonstrates that the ADB mechanism is responsible for the beats.
C. Other fifth order diagrams
In Sec. IIIA and Sec. III B, attention was directed toward the three fifth order ±k1 diagrams (1e, 1h, and 1i in Fig. 4) that give rise to anharmonic beats. The issue arises as to whether other ±k1 diagrams or any of the ±k2 or ±k3 diagrams can result in significant modifications of the third order vibrational echo data. The ±k1 diagrams 1a–1d, 1f, and 1g are analogous to the third order diagrams that are in the same row in the figure. Following the first pulse, each of the third order diagrams has the system in a superposition of the 0-1 state. This is true of the six diagrams named earlier. However, during the first pulse, the fifth order diagrams contain two more interactions with the radiation field, that of a coherence and a population or two coherences prior to the third interaction in the first pulse, which leaves the system in the 0-1 coherence. For example, one path represented by diagram 1b would place the system in a 0-1 coherence, then a first excited state, and then the 0-1 coherence. The time spent in the first excited state is distinct from the third order path. However, this time is, on average, much shorter than the duration of the pulse. Because the pulse duration is short compared to the dynamics that are being measured, the time that the system spends that is distinct from the third order path is negligible compared to the dynamical evolution of the system. Furthermore, even though the system spends a short time in a different state (e.g., a first excited state rather than a 0-1 coherence) it is still evolving under the same FFCF, which further reduces any differences. In the experiments and analysis presented here, the fifth order contribution was produced by the crossterm with the third order polarization [see Eq. (2)]. This further reduces any modification of the signal caused by diagrams 1-d, 1f, and 1g. Diagram 1j will only contribute to the vibrational echo experiment at pure fifth order because it results in an emission at ω32. Therefore, in a two-dimensional (2D) spectrally resolved experiment, it appears as a distinct signal.
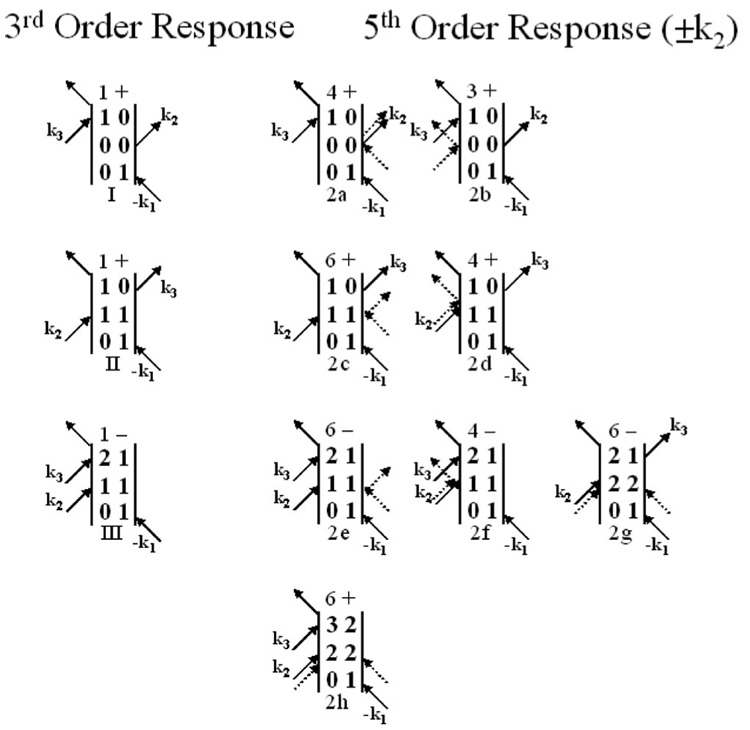
Figure 7 displays the ±k2 fifth order diagrams. These represent three interactions with the radiation field during the second pulse. The diagrams 2a–2f are similar to the diagrams just discussed. At the third order, the second pulse takes the system to a population, either the ground or first excited vibrational state. The fifth order diagrams reflect paths in which, for example, the second pulse creates a population, followed by a coherence, and then either a ground or first excited state population. The result of these six diagrams is the same as the equivalent third order diagram except the system spends a short time period in different states. As discussed earlier, the time is sufficiently short that the influence on the observed third order signal should be very small and the fifth order influence is further reduced because it only comes in as a cross term. Diagram 2g is different. After the three interactions during the second pulse, the system is left in the second excited vibrational state. This cannot occur at the third order. If the dynamics of the second excited vibrational state are different during the time period between the second and third pulses this path can affect the observed vibrational echo signal. The signal from this diagram is emitted at ω21. Therefore, spectrally resolved experiments that focus on the ω10 will not be affected. Diagram 2h comes into play only at the pure fifth order, and emits at ω32.
FIG. 7.
Third order diagrams giving rise to the vibrational echo signal and the related fifth order diagrams with the two additional radiation field-matter interactions occurring in pulse 2 (±k2). The coherence periods caused by the extra interactions are omitted, but the population periods are shown explicitly. The two additional interactions are shown as dashed arrows. The number of permutations of the incoming fields and the sign of the diagram are shown before each diagram.
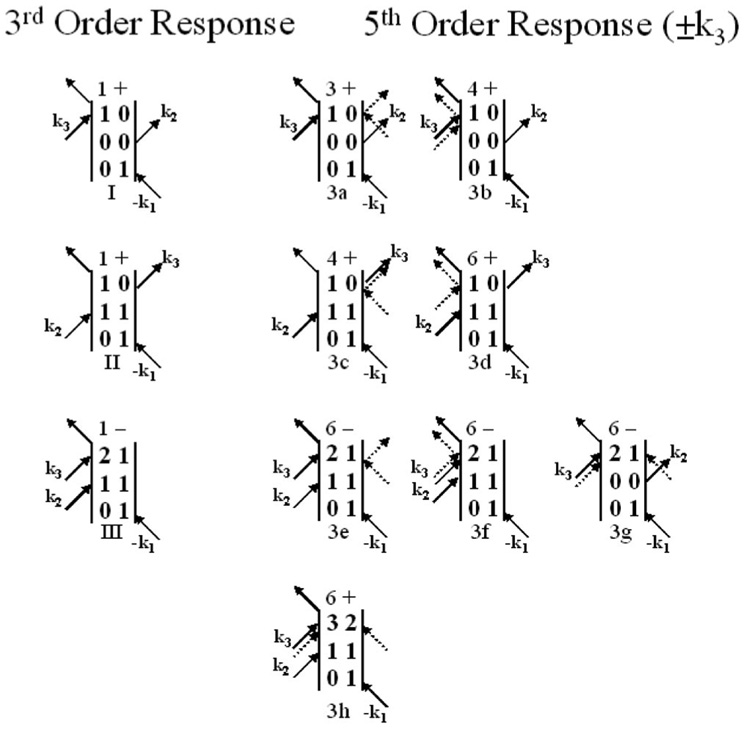
Figure 8 shows the fifth order ±k3 diagrams. All of the diagrams with the exception of 3h and 3g only influence the nature of the vibrational echo decay in that the system spends a very short time period in states other than the final coherent state that leads to emission of the vibrational echo signal. Diagram 3h comes into play only at the pure fifth order, and emits at ω32. Diagram 3g leaves the system in a ground vibrational state after the second pulse. The signal generated from this pathway is emitted at ω21 and will not contribute to the spectrally resolved vibrational echo signal at ω10.
FIG. 8.
Third order diagrams giving rise to the vibrational echo signal and the related fifth order diagrams with the two additional radiation field-matter interactions occurring in pulse 3 (±k3). The coherence periods caused by the extra interactions are omitted, but the population periods are shown explicitly. The two additional interactions are shown as dashed arrows. The number of permutations of the incoming fields and the sign of the diagram are shown before each diagram.
In the discussions of the experiments, the model calculations, and the diagrams, only 2D spectrally resolved vibrational echoes that are homodyne detected were considered. The situation is somewhat different if the experiments are heterodyne detected.6,22–25 In the context of Eq. (2), it was pointed out the crossterm between the third order and the fifth order polarizations lead to an amplification of the fifth order contribution and an effective I4 intensity dependence. When the vibrational echo is detected at the polarization level by heterodyning the emitted electric field with a local oscillator pulse, the signal is simply proportional to P(3) + P(5), rather than the absolute value squared given in Eq. (2). Thus, only the pure fifth order contributions will be observed. This will reduce the influence of the fifth order component relative to the third order component at a given intensity. Observation of signals emitted at ω32 or lack thereof provides a test for the presence of fifth order contributions to the vibrational echo signal if the pulse bandwidth is wide enough to span the ω32 transition frequency.
IV. CONCLUDING REMARKS
This paper has addressed the influence of fifth order processes on stimulated vibrational echo experiments, which is generally analyzed as a third order experiment. Fifth order contributions to the vibrational echo signal can occur at high intensities. Experiments were performed on the CO stretching mode of the proteins, H64V–CO and Hb–CO. The study focused predominantly on the difference between fifth order contributions to spectrally resolved vibrational echoes detected at the 1-0 transition frequency and the 2-1 transition frequency. For homodyne detection, the fifth order contribution is amplified by a cross term in the polarization between the third and fifth order polarizations, resulting in an effective I4 intensity for the fifth order contribution. The most prominent fifth order effect is oscillations in the vibrational echo decay with a period equal to the anharmonic frequency shift between the first and second exited states. The depth of modulation produced by the fifth order contribution at ω21 is a factor of four larger than that at ω10, in agreement with theoretical predictions. In H64V–CO, for which the anharmonic beats arise solely from the fifth order contributions, it was shown that the decay detected at ω10 displays little dependence on the intensity. This is in contrast to detection at ω21, where there is a dramatic change in the decay with reduction in intensity. In contrast to H64V–CO, Hb–CO shows significant anharmonic beats at ω10 that are intensity independent. While H64V–CO displays a single peak in its absorption spectrum, Hb–CO has a small structural substate absorption band to the blue of the main absorption band. The detailed calculations that were presented demonstrate that this band gives rise to an accidental degeneracy beat15 that is responsible for the oscillations observed at ω10, of the main band rather than a fifth order mechanism.10
The stimulated three-pulse vibrational echo is one of several third order material susceptibility experiments that have been used to investigate ultrafast dynamics in condensed phase systems. IR transient grating (TG) experiments are used to measure vibrational lifetimes. In a TG experiment, τ is set to zero, and Tw is scanned. In addition to the Feynman diagrams presented in this paper there are many additional diagrams that occur when pulses 1 and 2 are time coincident. Higher order contributions to the TG signal will also come into play at high intensity. Vibrational echo peak shift measurements26 will also be susceptible to fifth order contributions at high intensity.
The results presented earlier underscore the efficacy of spectrally resolving the vibrational echo signal. In most cases it is more clear-cut to interpret the vibrational echo decay of the ω10 transition rather than a combination of two transitions. When there is more than one species contributing to the signal, examining the time dependence of the entire spectrally resolved vibrational echo signal can be essential in assigning the dynamics.17 In addition, it was pointed out that heterodyne detection of the vibrational echo6 reduces the influence of fifth order processes; however, it adds to the complexity of the experiment. In this work we demonstrated that the influence of fifth order processes can be reduced by observing ω10 even at relatively high intensity.
ACKNOWLEDGMENTS
The authors would like to thank Dr. Kusai Merchant for important contributions to this work. They thank Dr. E. Park and Professor S. Boxer for providing the H64V mutant used in this study. This research was supported by the National Institutes of Health (2 R01 GM061137-05). One of the authors (I.J.F.) is grateful for partial support by a Veatek and Stauffer Memorial Fellowship.
References
- 1.Zimdars D, Tokmakoff A, Chen S, Greenfield SR, Fayer MD, Smith TI, Schwettman HA. Phys. Rev. Lett. 1993;70:2718. doi: 10.1103/PhysRevLett.70.2718. [DOI] [PubMed] [Google Scholar]
- 2.Tokmakoff A, Zimdars D, Sauter B, Francis RS, Kwok AS, Fayer MD. J. Chem. Phys. 1994;101:1741. [Google Scholar]
- 3.Hamm P, Hochstrasser RM. In: Ultrafast Infrared and Raman Spectroscopy. Fayer MD, editor. Vol. 26. New York: Dekker; 2001. p. 273. [Google Scholar]
- 4.Fayer MD. Annu. Rev. Phys. Chem. 2001;52:315. doi: 10.1146/annurev.physchem.52.1.315. [DOI] [PubMed] [Google Scholar]
- 5.Asplund MC, Zanni MT, Hochstrasser RM. Proc. Natl. Acad. Sci. U.S.A. 2000;97:8219. doi: 10.1073/pnas.140227997. [DOI] [PMC free article] [PubMed] [Google Scholar]
- 6.Asbury JB, Steinel T, Stromberg C, Gaffney KJ, Piletic IR, Goun A, Fayer MD. Phys. Rev. Lett. 2003;91:237402. doi: 10.1103/PhysRevLett.91.237402. [DOI] [PubMed] [Google Scholar]
- 7.Fourkas JT. Annu. Rev. Phys. Chem. 2002;53:17. doi: 10.1146/annurev.physchem.53.082001.144216. [DOI] [PubMed] [Google Scholar]
- 8.Mukamel S. Principles of Nonlinear Optical Spectroscopy. New York: Oxford University Press; 1995. [Google Scholar]
- 9.Rector KD, Kwok AS, Ferrante C, Tokmakoff A, Rella CW, Fayer MD. J. Chem. Phys. 1997;106:10027. [Google Scholar]
- 10.Hamm P, Lim M, Asplund M, Hochstrasser RM. Chem. Phys. Lett. 1999;301:167. [Google Scholar]
- 11.Braunstein D, Ansari A, Berendzen J, et al. Proc. Natl. Acad. Sci. U.S.A. 1988;85:8497. doi: 10.1073/pnas.85.22.8497. [DOI] [PMC free article] [PubMed] [Google Scholar]
- 12.Tokmakoff A, Kwok AS, Urdahl RS, Francis RS, Fayer MD. Chem. Phys. Lett. 1995;234:289. [Google Scholar]
- 13.Merchant KA, Thompson DE, Fayer MD. Phys. Rev. Lett. 2001;86:3899. doi: 10.1103/PhysRevLett.86.3899. [DOI] [PubMed] [Google Scholar]
- 14.Thompson DE, Merchant KA, Fayer MD. J. Chem. Phys. 2001;115:317. [Google Scholar]
- 15.Merchant KA, Thompson DE, Fayer MD. Phys. Rev. A. 2002;65:023817. [Google Scholar]
- 16.Merchant KA, Xu Q-H, Thompson DE, Fayer MD. J. Phys. Chem. A. 2002;106:8839. [Google Scholar]
- 17.Merchant KA, Noid WG, Akiyama R, Finkelstein IJ, Goun A, McClain BL, Loring RF, Fayer MD. J. Am. Chem. Soc. 2003;125:13804. doi: 10.1021/ja035654x. [DOI] [PMC free article] [PubMed] [Google Scholar]
- 18.Springer BA, Sligar SG. Proc. Natl. Acad. Sci. U.S.A. 1987;84:8961. doi: 10.1073/pnas.84.24.8961. [DOI] [PMC free article] [PubMed] [Google Scholar]
- 19.Antonini E, Brunori M. Hemoglobin and Myoglobin in Their Reactions with Ligands. North-Holland, Amsterdam: 1971. [Google Scholar]
- 20.Hill JR, Dlott DD, Rella CW, Peterson KA, Decatur SM, Boxer SG, Fayer MD. J. Phys. Chem. 1996;100:12100. [Google Scholar]
- 21.Boyd RW. Nonlinear Optics. San Diego: Academic; 1992. [Google Scholar]
- 22.Asbury JB, Steinel T, Stromberg C, Gaffney KJ, Piletic IR, Goun A, Fayer MD. Chem. Phys. Lett. 2003;374:362. doi: 10.1103/PhysRevLett.91.237402. [DOI] [PubMed] [Google Scholar]
- 23.Golonzka O, Khalil M, Demirdoven N, Tokmakoff A. Phys. Rev. Lett. 2001;86:2154. doi: 10.1103/PhysRevLett.86.2154. [DOI] [PubMed] [Google Scholar]
- 24.Zanni MT, Asplund MC, Hochstrasser RM. J. Chem. Phys. 2001;114:4579. [Google Scholar]
- 25.Zanni MT, Gnanakaran S, Stenger J, Hochstrasser RM. J. Phys. Chem. B. 2001;105:6520. [Google Scholar]
- 26.Piryatinski A, Skinner JL. J. Phys. Chem. B. 2002;106:8055. [Google Scholar]


