Abstract
A cell of the bacterium Escherichia coli was tethered covalently to a glass coverslip by a single flagellum, and its rotation was stopped by using optical tweezers. The tweezers acted directly on the cell body or indirectly, via a trapped polystyrene bead. The torque generated by the flagellar motor was determined by measuring the displacement of the laser beam on a quadrant photodiode. The coverslip was mounted on a computer-controlled piezo-electric stage that moved the tether point in a circle around the center of the trap so that the speed of rotation of the motor could be varied. The motor generated ≈4500 pN nm of torque at all angles, regardless of whether it was stalled, allowed to rotate very slowly forwards, or driven very slowly backwards. This argues against models of motor function in which rotation is tightly coupled to proton transit and back-transport of protons is severely limited.
Many species of bacteria swim with the aid of helical flagella that are powered at their base by a rotary motor embedded in the cell envelope. The power source for the motor is an electrochemical gradient of ions across the cytoplasmic membrane, the motor being a device for coupling rotation to ionic flux. These ions are either H+ (protons) or, in alkalophilic or marine bacteria, Na+. In Escherichia coli, the motor can rotate in either direction, and cells navigate toward regions rich in nutrients by controlling this direction (1). Flagellar rotation traditionally has been measured by using the “tethered cell” assay, in which a single flagellum is attached to the surface, causing the cell body to counter-rotate (2). Whereas the flagella of swimming E. coli rotate at over 100 Hz and are difficult to observe directly, tethered cells rotate at ≈10 Hz and are comparatively easy to monitor.
Measurement of the rotation rates of tethered cells and of flagellar bundles in swimming cells (3) established that the motor generates more torque under conditions of high load and low speed (tethered cells, or cells swimming in highly viscous media) than at low load and high speed (cells swimming in normal aqueous media). This behavior is predicted by most models of the motor mechanism and cannot, therefore, be used to distinguish between them. The torque generated when the motor is forced to rotate against its natural direction provides more information and has been measured by using electrorotation (4, 5). The latter authors (5) found a barrier to backwards rotation, i.e., that approximately twice as much torque was needed to make cells rotate backwards as was sufficient to stop them. This is predicted by some models of the motor mechanism, in particular those that include a stage in the torque-generating cycle in which the rotor and stator are tightly bound to each other, but not by others, for example those that generate torque by long range electrostatic interactions. However, further work using electrorotation suggested that the barrier to backwards rotation might be an artefact of that technique (6) arising from angular variation in the torque generated by either the electrorotation apparatus or the motor itself. To resolve this matter, we have used an optical trap to measure the torque generated by the motor moving in either direction near stall.
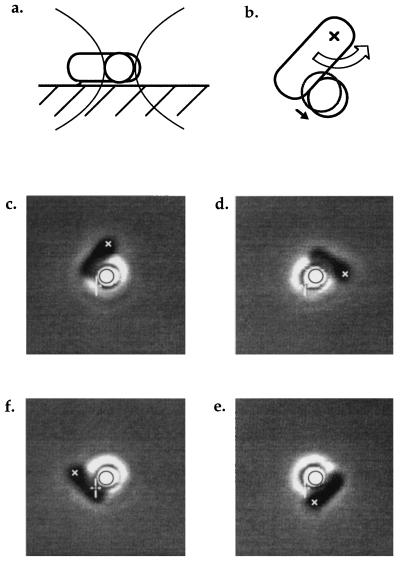
Cells tethered to a coverslip were stalled either by holding one end of the cell body in the trap or by holding a bead in the trap in a position that blocked rotation (Fig. 1). As the motor exerted torque, it pushed the end of the cell body or the bead away from the center of the trap. This deflection was monitored with a quadrant detector, providing a measure of the magnitude and direction of the force. Next, the tether point was moved in a circle centered on the trap by moving the coverslip with a piezo-electric stage. This is equivalent to rotating the trap about a fixed tether, but it avoids variations in trap geometry or strength that might arise from deflecting the laser beam. (For the sake of simplicity, subsequent discussions may describe the trap rotating around a fixed tether rather than the tether rotating around a fixed trap.) To test for a barrier to backwards rotation, we allowed the cell to turn slowly in either direction. If there were a barrier, the torque measured for backwards rotation should be larger than for forwards rotation. We found the torque to be nearly the same at all angles regardless of direction. Thus, we conclude that there is no barrier to backwards rotation. Evidently, the earlier results (5) were due to a variation in torque applied by the electrorotation apparatus that depended on cell angle (6).
Figure 1.
(a) A tethered cell stalled by a bead held in the trap, viewed from the side. (b) The same cell viewed from below the coverslip. The large arrow represents the torque exerted on the cell body by the flagellar motor; the small arrow represents the resulting displacement of the bead away from the center of the trap. The initial position of the bead is shown by the gray circle. (c–f) Video-recorded images of a tethered cell pushing a trapped bead as the tether point was rotated clockwise at −1/8 Hz, driving the motor backwards. In each panel, the black circle and the white cursor are fixed relative to the center of the trap, allowing the displacement of the bead to be seen. The cross (x) marks the approximate position of the tether point. The first panel shows the same view as the diagram in b.
MATERIALS AND METHODS
Cells.
Cells of strain KAF95 were grown, prepared, and tethered covalently (to glass) as described (5). This strain, constructed by Karen Fahrner, carries a cheY deletion and thus rotates its flagella exclusively counterclockwise. It also has “sticky” flagellar filaments that adhere spontaneously to a variety of surfaces.
Beads.
Polystyrene beads (1.03 μm diameter; Polysciences) were added at low density, diluted 1:1000 from the purchased stock. They did not stick to the surface or to the cells. We used beads, in part, because it was easier to calibrate the force exerted on them by the trap and, in part, to minimize possible photo damage to the cells.
Optical Trap.
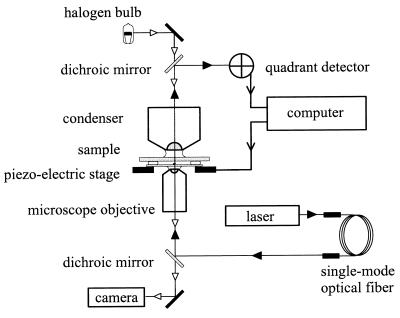
The optical trap is shown schematically in Fig. 2. The laser was a 1-W continuous-wave MOPA diode laser operating at 985 nm [SDL (San Jose, CA) model 5762-A6]. Its beam was contracted by passage (backwards) through a 3× beam expander [Special Optics (Wharton, NJ) model 50–25-3x-985], attenuated by passage through a half-wave plate (Special Optics model 8R-8008–985) and polarizing beamsplitter (Oriel, Stamford, CT, model 26170), and then coupled to a single-mode fiber [Oz Optics (Carp, Ontario, Canada) model SMJ-3A-125–3-2]. The coupling was ≈50% efficient. Before entering the microscope (Nikon Diaphot model 200), the beam was expanded with two confocal plano-convex lenses (Newport, Fountain Valley, CA) so as just to overfill the back aperture of the objective. The beam power at the entrance to the microscope was set at 370 mW for experiments with beads and was lowered as far as possible without losing the ability to stall cells for experiments without beads. The dichroic mirror (Chroma Technology, Brattleboro, VT, model 850DCSP) was coated to reflect infra-red light at its front surface and to transmit visible light at its back surface. The objective was a 60× phase-contrast apochromat, 1.4 numerical aperture oil (Nikon).
Figure 2.
A schematic diagram of the experimental apparatus. The computer simultaneously controlled the motion of the piezo-electric stage and recorded data from the quadrant detector. The specimen was viewed by using standard microscope illumination, either in phase contrast or when the quadrant detector was recording, in bright field.
Quadrant Detector.
The phase condenser, 1.25 numerical aperture (Nikon), was oiled to the coverslip and set for bright-field illumination. The trapping light emerged from the back of the condenser approximately collimated, was reflected by a dichroic mirror (a Chroma Technology hot mirror), and was collected onto the quadrant photodiode (Spot 9DM1, United Detector Technology, Santa Monica, CA, 10 mm OD) by a plano-convex lens placed about half its focal length in front of the photodiode. This made the laser spot fill approximately half the face of the photodiode. For a discussion of this detection scheme, see refs. 7–9.
Currents from each of the four quadrants were converted to voltages, and the normalized differential signals Y signal = (Vtop − Vbottom)/Vsum and X signal = (Vright − Vleft)/Vsum (where Vtop, Vbottom, Vleft, and Vright are sums of the voltages from various pairs of quadrants, and Vsum is the sum of voltages from all four quadrants) were calculated by using custom-built electronics. These signals were low-pass filtered at 10 kHz to avoid aliassing, sampled at 8 kHz (by using National Instruments, Austin, TX, hardware with labview software, as in ref. 5), digitally filtered, and resampled at 2 kHz. With a bead stalling a typical cell, the size of the actual normalized differential signal was on the order of 0.05.
Piezo-Electric Stage.
The piezo-electric stage was designed and constructed by Will Ryu. Nested x- and y-flexural bearings were milled from a single piece of titanium and moved by preloaded piezo stacks [ThorLabs (Newton, NJ) model AE0505D16, with MDT690 drivers]. Hysteresis in the stage was measured by digitization of video images of beads fixed to a coverslip and compensated by using the computer to generate nonsinusoidal driving voltages. The program allowed for movement in circles of radius 1.17, 1.55, and 1.93 μm and in other patterns for force calibration. Circles were checked by video and were found to be round to within a 2% variation in radius over a considerable range of DC voltage offsets.
Force Calibration.
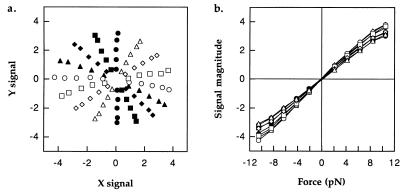
The piezo stage was moved at a variety of constant speeds at various angles while the signal from a bead held still in the trap was recorded. The viscous drag coefficient of a spherical bead moving at a fixed distance from a plane surface can be calculated (10, 11), and therefore the force exerted by the fluid on the bead is known. Fig. 3a shows the differential signals obtained for forces of 1, 2, 3, 4, and 5 times 2.1 pN along eight evenly spaced axes. Evidently, the signal for a given force varies with angle although we are not sure why this should be. Fig. 3b shows the magnitude of the signal vs. force for each of the eight axes. In cases in which tethered cells were stalled by beads held in the trap, the force exerted by the cell on the bead was calculated by interpolation from the data of Fig. 3. When cells were held directly by the trap, smaller differential signals were obtained. In this case, forces were interpolated as before and then scaled to give the same force as with the bead when averaged over one cycle.
Figure 3.
(a) Differential signals from a bead held in the trap 2 μm from the surface, while the stage was moved in straight lines at constant speed in various directions. (b) Signal amplitude vs. force (in pico-Newtons) from the data of a. The forces were calculated by using the formula for viscous drag on a sphere at low Reynolds number, with a correction for the proximity of the surface (see text).
RESULTS
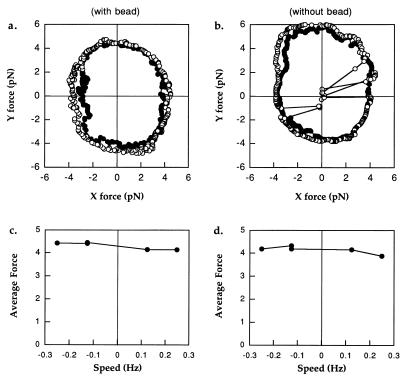
Fig. 4 shows data obtained from one cell, stalled with (a) and without (b) a bead. The sequence of events was as follows: (i) The cell was stopped by lowering a trapped bead into its path (as in Fig. 1); (ii) the stage was rotated in a counter-clockwise circle, in the forwards or positive direction, at +1/2 Hz, and the centering of the tether circle on the trap was checked by eye; (iii) the stage was rotated at speeds of +1/4, +1/8, −1/8, and −1/4 Hz for 8 s each (one or two rotations) while the torque exerted by the motor was recorded; (iv) the trap was turned off, and the bead was allowed to diffuse away; and (v) step 3 was repeated but with the cell held directly in the trap. Fig. 4 a and b show the forces obtained with circles at speeds of +1/8 Hz (filled symbols, moving counter-clockwise) and −1/8 Hz (open symbols, moving clockwise). In each case, data were recorded with the cell truly stalled for 2 s before and after each circle, leading to a clustering of data points in the lower right quadrant. Because cells were less refractile than beads, the trap was able to exert less force on them. Many cells could not be held at all angles by the trap alone. Indeed, this cell escaped the trap several times, as shown in Fig. 4b, resulting in the lines to the origin representing the periods during which the cell made full rotations away from the trap and back.
Figure 4.
(a) Forces exerted by a tethered cell on a trapped bead when allowed to rotate slowly forwards (filled symbols, counter-clockwise, + 1/8 Hz) or pushed slowly backwards (open symbols, clockwise, −1/8 Hz). The circles started from the bottom right, where extra points were recorded while the cell was stalled before and after rotations. (b) Forces as in a, recorded with the same cell, only now held directly in the trap without a bead. Note how the cell escaped the trap on several occasions during the backwards push. (c) Mean force vs. speed for this cell with the bead. (d) Mean force vs. speed for this cell without the bead.
It is clear that the forwards and backwards forces were nearly the same, either with or without the bead. That is, the motor generated the same torque whether stalled, allowed to move very slowly forwards, or forced to move very slowly backwards. Fig. 4 c and d show average forces 〈(Fx2 + Fy2)1/2〉 as a function of rotation speed. There is almost no difference between forwards and backwards rotations. By contrast, if there were a barrier to backwards rotation, we would expect the torque to be far larger backwards than forwards. Berg and Turner (5) reported values between 1.2 and 4.0 (with an average of 2.2) for the ratio of backwards to forwards torque, and Berry and Berg (6) showed that this ratio was not larger than ≈1.5. The data here show that the ratio is smaller than 1.07. As we shall see, much of the difference can be accounted for by viscous drag on the cell body and possibly by friction or sticking to the surface.
The cell of Fig. 4 exerted a force of ≈4 pN on the bead at all angles. With a perpendicular distance of 1.2 μm between the motor and the point of contact between the cell and the bead, this tells us that the motor generates a torque of ≈4800 pN nm. This translates to a force of 200 pN at the periphery of the C ring (12), or 25 pN from each of eight independent force-generating elements (13, 14). There is some uncertainty in these numbers because the presence of the cell next to the bead might perturb the optical signal obtained with the free bead in the calibration experiment. Nevertheless, our measurement is consistent with earlier estimates of flagellar motor torque, based on rotation rates and calculated frictional drag coefficients of tethered cells (see, e.g., ref. 3 for Streptococcus), which fell in the vicinity of 3000 pN nm.
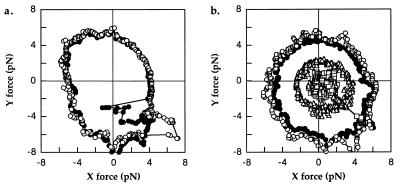
Table 1 classifies 27 cells, all of which were manipulated via a bead and 14 of which also were manipulated directly by the trap. “Sticking” cells were those that showed evidence of interactions between the cell body (or the bead) and the glass surface. An example is shown in Fig. 5a. Here, a cell with a bead was initially stuck to the surface. When the trap was rotated forwards, away from the cell (filled symbols), the bead did not immediately follow, as shown by a transient fall in the force toward 0. Shortly afterward, the bead or cell came loose, and the force returned to its initial magnitude because the motor could once again push the bead away from the trap center. When the trap was rotated backwards, toward the cell (open symbols), there was a high initial transient force, as the trap pushed against the stuck bead or cell. As before, the bead or cell came loose, and the force returned to its initial magnitude. Other cells showed evidence of sliding friction between the cell (or bead) and the surface. This impeded the motor so that forwards, the trap had to provide less force to move the cell, whereas backwards, it had to provide more force to move the cell. This behavior would be indistinguishable from a true barrier to backwards rotation were it not for the fact that cells that showed it gave signals typical of stick-and-slip behavior (similar to but less pronounced than that shown in Fig. 5a). Also, these cells occasionally stuck to the surface, even with no trap or bead present. The most likely explanation for this is that unsheared stubs of “sticky” filaments remained on the tethered cell that were long enough to stick to the surface now and again but not to prevent rotation of the cell entirely.
Table 1.
The number of cells that behaved in different ways
| Classification | Cells with bead, n | Cells without bead, n |
|---|---|---|
| Good | 4 | 4 |
| Sticking | 17 | 4 |
| Loose tether | 2 | 5 |
| Breaking | 4 | 1 |
Figure 5.
Forces exerted by cells that behaved badly. (a) A cell that stuck to the surface at the beginning of the rotations. This caused a transient decrease in force at the beginning of the forwards rotation and a transient increase in force at the beginning of the backwards rotation. (b) A cell that broke during backwards rotation at −1/8 Hz (open circles), following an earlier revolution at +1/8 Hz (filled circles). The break appears as a line from the largest to the smallest circle (open squares). This cell recovered partially before the final rotations at −1/4 Hz (open triangles).
Cells with a “loose tether” (Table 1) showed irregular signals that varied from one run to the next. Sometimes these cells came off the glass during the course of an experiment. In a few cases, the motor broke, as seen in the electrorotation experiments (5). Fig. 5b shows a cell that broke the second time it was pushed backwards at −1/8 Hz (open squares). The sequence of speeds here was +1/8 Hz (solid circles), −1/8 Hz (open circles), −1/8 Hz again (open squares), and −1/4 Hz (open triangles). This cell recovered somewhat between the −1/8 Hz and −1/4 Hz rotations, as indicated by the open triangles in the lower right quadrant, recorded for 2 s before the rotation at −1/4 Hz began.
Cells, such as the one shown in Fig. 3, that did not stick, shift their tether, or break were classified as “good.” For these cells, Table 2 shows the ratio of the average force at −1/8 Hz (backwards) to the average force at +1/8 Hz (forwards). These cells rotated between 5 and 10 Hz in the absence of the trap and bead. Assuming that the rotational drag coefficient of the cell and bead together is nearly double that of the cell alone, we can say that the torque generated by the motor typically corresponds to rotation of the cell and bead by at most ≈5 Hz. Therefore, for cells with beads, the difference in velocity of 1/4 Hz between our forwards and backwards circles at + and −1/8 Hz corresponds to a torque of ≈1/20th of the motor torque, so we would expect a ratio in the vicinity of 1.05 caused by viscous drag alone. For cells without beads, we would expect a ratio in the vicinity of 1.02. Any remaining difference between forwards and backwards torque is most probably due to friction with the surface. We conclude, to the precision possible with these experiments, that there is no barrier to backwards rotation. The motor appears to generate the same torque when forced slowly backwards as when allowed to rotate slowly forwards.
Table 2.
The ratio of mean force during backwards rotation (−1/8 Hz) to mean force during forwards rotation (+1/8 Hz) for cells classified as good
| Cell with bead (identifier) | Ratio | Cell without bead (identifier) | Ratio |
|---|---|---|---|
| 1 | 1.07 | 1 | 1.01 |
| 2 | 0.93 | 2 | 1.01 |
| 3 | 1.08 | 5 | 1.01 |
| 4 | 1.09 | 6 | 1.04 |
| Mean | 1.04 | 1.02 |
DISCUSSION
We have shown that there is no barrier to backwards rotation of the E. coli flagellar motor. The differences in the torque needed to make cells rotate slowly in either direction are very small (Table 2) and are consistent with what one would expect for viscous drag on the bead and/or cell body. The maximum force exerted by our optical tweezers could only make cells rotate backwards at approximately −1 Hz. The electrorotation data of Berry and Berg (6), after correction for the measured angular variation in the torque exerted by the rotating electric field, demonstrate that the torque vs. speed relation of the motor is linear up to at least −20 Hz. Unpublished electrorotation data using cells of the strain KAF84 (5), in which the motor spontaneously switches direction, extend this linear relationship to −100 Hz. [In plots of cell speed (ω) against applied torque (Tapp), KAF84 motors switched between two parallel straight lines, one for each directional mode of the motor, symmetrically disposed about the origin and separated by twice the unassisted rotation rate. In these experiments, the torque generated by the motor (Tm) is given by Tm = fω-Tapp, where f is the frictional drag coefficient of the cell body. Thus, the observed linearity between ω and Tapp implies that Tm is also a linear function of ω.] Data were not obtained beyond −100 Hz because motors tended to break at these speeds. Additional evidence on this point might be obtained by other means, e.g., by fixing magnets to tethered cells and subjecting them to rotating magnetic fields.
The absence of a barrier to backwards rotation removes an important constraint on models of how the motor works. A barrier to backwards rotation would imply two things: first, that there is a state in the working cycle of the motor in which the rotor and stator are tightly bound and second, that transitions out of this state only can occur with corresponding forwards rotation. These conditions are met in models in which rotation and proton flux are tightly coupled (see, e.g., ref. 15) provided that the back-transport of protons is severely limited and cannot be speeded up even by considerable backwards torque. This is equivalent to saying that there is an irreversible step in proton influx that does not involve rotation of the rotor—if it did, it would have to be sensitive to torque—but rather allows subsequent forwards rotation to occur. In a sense, then, the motions of protons and the rotor are indirectly coupled. A barrier to backwards rotation would be evidence against the class of models for which there is no tightly bound state but, instead, for which the forces between rotor and stator are longer range and presumably electrostatic in nature (16, 17; reviewed in ref. 5). The absence of a barrier means that these models can once more offer a possible explanation of how the motor might function.
Our data also suggest that motor torque is approximately constant with angle. Some force-position curves were more elliptical than others. Compare, for example, Fig. 5a to Figs. 4a and 5b. However, some ellipticity is expected from imperfect alignment of the center of the trap and the circle made by the tether point. This leads to angular variation in the distance between the axis of the motor and the point of contact with the bead and thus to angular variation in the measured force even with constant torque. Thus, it appears that the main difficulty encountered with electrorotation was not variation in torque by the motor itself but rather variation, with cell angle, in torque applied by the high frequency rotating electric field (see ref. 6).
We encountered a number of cells in which the motor appeared to break (Table 1; Fig. 5b). One motor even broke while stalled after forwards rotation at +1/4 Hz, before ever being forced backwards (data not shown). This suggests that breaking is probably not caused by transiently high torque in motors driven backwards, as previously suggested (6). One possibility is that motors are vulnerable to lateral forces, such as those exerted here by the optical trap. However, if this were the case, one would expect freely spinning tethered cells to break as well because viscous drag also exerts lateral forces on the tether, forces that are larger when cells are tethered near one end. In the electrorotation experiments, cells broke much more readily when driven backwards than when driven forwards (5). It is possible that motor torque decreases linearly with speed in the vicinity of 0 speed (6, 18), which would mean that motors driven backwards were subjected to higher torque than those driven forwards.
Acknowledgments
We thank Markus Meister and Don Eden for their comments on the manuscript and Linda Turner for her help with the figures. R.M.B. is a recipient of a Wellcome Trust International Prize Traveling Research Fellowship. This work was supported by the Rowland Institute for Science.
References
- 1.Macnab R M. In: Escherichia coli and Salmonella: Cellular and Molecular Biology. 2nd Ed. Neidhardt F C, Curtiss R III, Ingraham J L, Lin E C C, Low K B, Magasanik B, Reznikoff W S, Riley M, Schaechter M, Umbarger H E, editors. Washington, D. C.: Am. Soc. Microbiol.; 1996. pp. 123–145. [Google Scholar]
- 2.Silverman M, Simon M. Nature (London) 1974;249:73–74. doi: 10.1038/249073a0. [DOI] [PubMed] [Google Scholar]
- 3.Lowe G, Meister M, Berg H C. Nature (London) 1987;325:637–640. [Google Scholar]
- 4.Washizu M, Kurahashi Y, Iochi H, Kurosawa O, Aizawa S-I, Kudo S, Magariyama Y, Hotani H. IEEE Trans Ind Appl. 1993;29:286–294. [Google Scholar]
- 5.Berg H C, Turner L. Biophys J. 1993;65:2201–2216. doi: 10.1016/S0006-3495(93)81278-5. [DOI] [PMC free article] [PubMed] [Google Scholar]
- 6.Berry R M, Berg H C. Biophys J. 1996;71:3501–3510. doi: 10.1016/S0006-3495(96)79545-0. [DOI] [PMC free article] [PubMed] [Google Scholar]
- 7.Visscher K, Gross S P, Block S M. IEEE J Sel Top Quantum Electr. 1996;2:1066–1076. [Google Scholar]
- 8.Visscher, K. & Block, S. M. (1997) Meth. Enzymol., in press. [DOI] [PubMed]
- 9.Gittes, F. & Schmidt, C. F. (1997) Opt. Lett., in press. [DOI] [PubMed]
- 10.Happel J, Brenner H. Low Reynolds Number Hydrodynamics. Dordecht, The Netherlands: Kluwer; 1991. pp. 322–331. [Google Scholar]
- 11.Svoboda K, Schmidt C F, Schnapp B J, Block S M. Nature (London) 1993;365:721–727. doi: 10.1038/365721a0. [DOI] [PubMed] [Google Scholar]
- 12.Francis N R, Sosinsky G E, Thomas D, DeRosier D J. J Mol Biol. 1994;235:1261–1270. doi: 10.1006/jmbi.1994.1079. [DOI] [PubMed] [Google Scholar]
- 13.Blair D F, Berg H C. Science. 1988;242:1678–1681. doi: 10.1126/science.2849208. [DOI] [PubMed] [Google Scholar]
- 14.Samuel A D T, Berg H C. Biophys J. 1996;71:918–923. doi: 10.1016/S0006-3495(96)79295-0. [DOI] [PMC free article] [PubMed] [Google Scholar]
- 15.Meister M, Caplan S R, Berg H C. Biophys J. 1989;55:905–914. doi: 10.1016/S0006-3495(89)82889-9. [DOI] [PMC free article] [PubMed] [Google Scholar]
- 16.Berry R M. Biophys J. 1993;64:961–973. doi: 10.1016/S0006-3495(93)81462-0. [DOI] [PMC free article] [PubMed] [Google Scholar]
- 17.Elston T C, Oster G. Biophys J. 1997;73:703–721. doi: 10.1016/S0006-3495(97)78104-9. [DOI] [PMC free article] [PubMed] [Google Scholar]
- 18.Berry R M, Turner L, Berg H C. Biophys J. 1995;69:280–286. doi: 10.1016/S0006-3495(95)79900-3. [DOI] [PMC free article] [PubMed] [Google Scholar]


