Abstract
An automated data analysis method for real-time PCR needs to exhibit robustness to the factors that routinely impact the measurement and analysis of real-time PCR data. Robust analysis is paramount to providing the same interpretation for results regardless of the skill of the operator performing or reviewing the work. We present a new method for analysis of real-time PCR data, the maxRatio method, which identifies a consistent point within or very near the exponential region of the PCR signal without requiring user intervention. Compared to other analytical techniques that generate only a cycle number, maxRatio generates several measurements of amplification including cycle numbers and relative measures of amplification efficiency and curve shape. By using these values, the maxRatio method can make highly reliable reactive/nonreactive determination along with quantitative evaluation. Application of the maxRatio method to the analysis of quantitative and qualitative real-time PCR assays is shown along with examples of method robustness to, and detection of, amplification response anomalies.
INTRODUCTION
Real-time PCR has become a widely used methodology for both qualitative and quantitative determination of molecular targets. The power of real-time PCR is that the fluorescence response observed is a direct measure of the dynamics of the amplification reaction process. The real-time PCR curve is a fluorescence response with a roughly sigmoidal shape that correlates to the growth of amplified product during the PCR amplification process. The shape of the PCR amplification curve reflects the dynamics of the PCR reaction for an individual sample that is controlled by the assay design, which includes reactive components (primer and probe designs and concentrations, concentrations of enzymes, activators, buffers, dNTPs, etc.) and cycling conditions for the reaction.
Current analytical methods primarily concentrate on quantitative responses that involve cycle number determination. These approaches provide a quantitative assessment by focusing on one portion of the amplification growth curve, namely the region of observed exponential growth. The cycle threshold (Ct) method (1) determines a cycle number based on the point where the fluorescence response grows above the background level to cross a predetermined fluorescence threshold value. The critical steps involved in Ct determination include defining the baseline, establishing a suitable threshold for quantification of the target and using either an external calibration curve or an internal quantitation standard (2) for quantitation. The Ct method is an excellent method for providing quantitative PCR analysis because of the consistency in signal intensity during the exponential growth phase of the PCR. However, it is susceptible to baselining error when challenged with signal anomalies such as spectral crosstalk or transients due to bubbles in the reaction or noise. For example, to generate a Ct value within the exponential growth region of the PCR curve, a low threshold may be required. With a low threshold, there is a potential for a threshold crossing due to an anomalous signal, e.g. spectral crosstalk rather than true amplification. It is difficult to discriminate between a Ct value caused by a false threshold crossing and one generated by a valid reactive response. In such cases, analysis can require some measure of interpretation on the part of the data reviewer to assess whether a particular response is truly an amplification or not. In addition, it is difficult to determine the true Ct value in the presence of such signal anomalies. Even small errors in the baselining process can cause negative reactions to cross the threshold or reactive signals to cross early or late. An alternate method for determination of cycle numbers is the use of derivative methods, such as the second derivative maximum method (3), which do not require baselining. Both Ct and derivative methods provide a cycle number response for the PCR reaction, but do not provide any means for assessing the efficiency of the individual reaction or suitability of the PCR curve for quantitative analysis.
We present here a new method for analysis of real-time PCR data, the maxRatio method, which identifies a consistent point within or very near the exponential region of the PCR signal without requiring user intervention. Compared to other analysis techniques that generate only a cycle number, maxRatio generates several measurements of amplification including cycle numbers and relative measures of amplification efficiency and curve shape. By using these values, the maxRatio method can achieve highly reliable reactive/nonreactive determination along with quantitative evaluation.
MATERIALS AND METHODS
maxRatio method description
The maxRatio method takes a PCR amplification signal and calculates a ratio at each cycle using Equation (1).
| 1 |
where Signaln is the measured real-time PCR fluorescence response for the target of interest at cycle n. Because Equation (1) has the signal in the numerator and denominator, the ratio is a self-normalizing, dimensionless expression. The effect of normalization by a nearly constant reference signal divides out and either raw or normalized fluorescence may be used. This self normalizing characteristic also provides the ratio transformation with an inherent insensitivity to variability in signal intensity such as might occur from well-to-well within an instrument or between instruments.
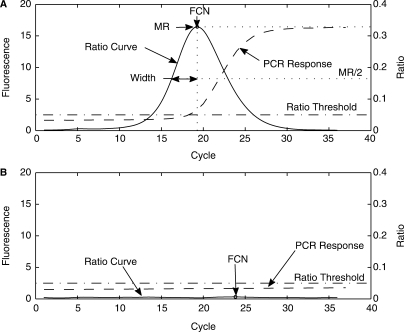
The ratio calculation transforms the roughly sigmoidal shaped amplification curve to a ratio curve with a well-defined peak. Figure 1 illustrates this transformation. The ratio curve exhibits several well-defined features.
Figure 1.
MR, FCN and width definition. (A) PCR response and ratio curve for a positive reaction with definition of MR, FCN and width. (B) PCR response and ratio curve for a negative reaction.
The maximum value of the ratio curve defines two values. The magnitude of the ratio curve at the maximum is defined as the MR (maxRatio) value. The cycle number at which the maximum occurs is defined as the FCN value or fractional cycle number. The ratio curve is based on a cycle-by-cycle ratio of signal intensities, which differs from the first or second derivative maximum methods (3) as the derivative calculation is a difference measurement. The FCN value generated by the maxRatio method is consequently not the same value as the cycle number generated by either derivative method. The ratio curve has a characteristic width, measured as the half width at half maximum, referred to as the width parameter.
The ratio curve is a relative measure of the fluorescence signal growth throughout the PCR reaction. The early cycle ratio curve near zero represents the baseline region of the PCR curve and the late cycle region corresponds to the plateau phase. The ascending part of the ratio curve corresponds to the exponential growth phase; the descending part of the ratio curve is the transition from the exponential to the plateau phase in the PCR curve. Nonreactive responses have ratio curves that are nearly flat with an MR value near zero. A ratio threshold can be established, which separates reactive versus nonreactive responses based on MR values.
The signal value, Signaln, in the ratio Equation (1) includes the PCR signal intensity and the inherent background fluorescence level. As such, MR values are a relative measure of reaction efficiency. The magnitude of the MR value even for a perfectly efficient reaction is always less than one because of the inherent level of background fluorescence incorporated in the ratio equation. By including the background fluorescence in the ratio equation, the resulting ratio curve avoids the problem of division by zero and is highly insensitive to even moderate baseline slope variation. Different probe designs and dye/quencher combinations can exhibit different levels of quenching. An assay with higher background fluorescence will typically have lower MR values.
Many efforts have been made to estimate absolute PCR reaction efficiency from individual responses (4–7). Although an absolute measurement of reaction efficiency would be ideal, it has been reported that even nominal variations in baseline determination can make calculation of absolute amplification efficiency from individual responses unreliable. Calculating initial starting concentration using such an absolute efficiency measure is difficult. In any case, all such methods rely on precise removal of background fluorescence level and slope, and generally require curve fitting functions to relatively few points. It should be noted that the relative efficiency measure MR value generated by the maxRatio method is not used to directly estimate reaction efficiency or to calculate initial sample concentration. Instead, MR is used to determine if a response is reactive or nonreactive and for reactive responses if it is a normal amplification for that assay.
It has been found that for some assays, low target amplification curves exhibit suppressed signal levels, for example due to competition with nonspecific amplification products. As a result, the exponential growth portion of the amplification curve is reduced. This causes the ratio peak and therefore the FCN value to shift slightly earlier. The result is a slight overquantitation for low copy samples. At the same time, these suppressed signals exhibit reduced MR responses. We can take advantage of this correlated behavior between the FCN and MR response values for these samples to create an adjusted FCN value (FCNA) that uses the MR value to compensate for the earlier FCN determination. The FCNA is defined in Equation (2).
| 2 |
Use of FCNA may provide more linear quantitation to the lowest detectable responses for some assays.
Ratio threshold use
The ratio threshold is used to separate populations of responses based on relative reaction efficiency (MR) values. Setting of the ratio threshold is determined by characterization of the assay and is determined primarily by analysis of negatives. One method might be to determine the mean and SD of the MR values for negative reactions and then set the ratio threshold to a level of the mean plus some number of SDs (typically 5 to 10 SD). Other considerations when setting the ratio threshold include the presence of spectral crosstalk in multiplex assays and signal anomalies such as initial transients. Although shown in Figure 1 as a straight line, the ratio threshold can be set with different levels at different cycles. The setting of the ratio threshold is determined during assay development and typically does not need to be changed even for different instruments or reagent lots. Unlike the threshold used for Ct analysis, the ratio threshold is only used to determine reactivity of the response. It has no effect on the FCN value used for quantification of positive reactions.
More than one ratio threshold can be established. While one ratio threshold can be set on the basis of separating nonreactive from reactive responses, a second threshold can be applied based on separating normal reactive responses from abnormal reactive responses.
Use of response shifting
Because the ratio transformation is inherently self-compensating for reaction signal intensity, it can be applied to a reaction's raw fluorescence signal. When a reference dye is available, the normalized fluorescence signal is typically analyzed. It should be noted that the fluorescence signal naturally has a background level of unquenched fluorescence. Because of the division in the ratio transformation, it is necessary to maintain this background fluorescence level to avoid division by zero. As an alternative to utilizing the raw or normalized fluorescence response directly, the response may be shifted to fixed positive background fluorescence level. The advantage of this response shifting is to eliminate sensitivity to factors that can change the level of background fluorescence, such as variability in probe manufacture or fluorescence contamination in the thermal cycler block. The disadvantage of shifting the response is that it removes the inherent insensitivity to signal intensity and can introduce some instrument-to-instrument variability. For this reason, if response shifting is implemented, using a shift value near the natural level of background fluorescence is recommended. It should be noted that shifting will directly affect the magnitude of the MR value. Shifting to a low value will increase both the MR value of positive reactions as well as the mean and SD of the MR for negative reactions. In terms of statistical separation of populations, this rarely makes significant difference. Shifting to a low level can also reduce robustness to spectral crosstalk, initial signal transients and other anomalies in the baseline portion of the amplification response. It is important therefore when developing the assay, to focus on statistical separation of reactive from nonreactive populations by MR, not on maximizing the MR value.
Method implementation
The maxRatio method has been implemented as part of the Abbott m2000™ system. The m2000 system consists of two instruments: the Abbott m2000sp and the m2000rt. The m2000sp automates the extraction, purification and preparation of DNA and RNA from patient samples. The m2000rt real-time PCR instrument amplifies and detects real-time PCR assays. Because the m2000 system has an effective automatic baselining algorithm, baseline slope correction (but not offset) is applied. Although normalization and baseline slope correction are not required by the maxRatio method, a small improvement in performance may be achieved using them. In addition, the signal has a smoothing filter applied. It is a feature of the maxRatio method that a much more aggressive noise filter can be applied without significantly affecting the cycle number compared to the Ct method. The m2000rt instrument implements a fourth order, zero-phase noise filter. In order to obtain 0.01 cycle resolution, a cubic spline interpolation is applied to the ratio curve.
Example data sets
The PCR data used to illustrate attributes of the maxRatio analysis method consist of actual and modified data derived from Abbott RealTime PCR assays processed on the m2000 system. Modified data is used as noted to demonstrate the performance of different algorithms to anomolous responses that may occur periodically in the course of normal processing.
RESULTS AND DISCUSSION
Assay quantification using maxRatio
A comparison of quantification using the maxRatio algorithm was made using an Abbott RealTime HIV-1 linearity panel (8). A dilution series of Armored HIV-1 RNA ranging from 7.44 log10 copies/ml to 1.56 log10 copies/ml (27.5 million copies/ml to 36 copies/ml) was analyzed. Three runs were performed with four replicates per run at each concentration. All 12 replicates were detected for the highest seven dilutions, while 11 out of 12 replicates were detected at 36 copies/ml. The maxRatio method was implemented with response shifting set to 0.7. FCN and FCNA cycle numbers were used for quantitation by the maxRatio method.
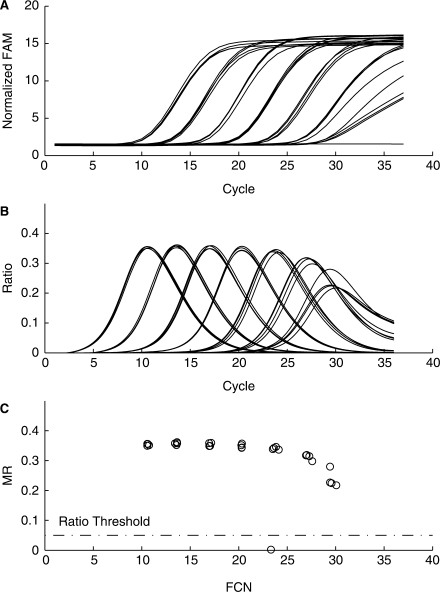
Figure 2 illustrates HIV-1 normalized FAM (6-carboxyfluorescein) fluorescence for one of the runs processed with the maxRatio algorithm. Plotting the MR versus FCN values generates the characteristic MR–FCN plot for this data. The only negative response is from the negative control, which is identified in the MR versus FCN plot with an MR value near zero. Since there is no signal growth in reactions without target, the ratio curve is nearly equal to zero throughout the amplification process. The MR value of approximately zero easily distinguishes the negative response from the reactive samples.
Figure 2.
Analysis by maxRatio of RealTime HIV-1 assay amplification plots. HIV-1 RNA ranging from 7.44 log10 copies/ml to 1.56 log10 copies/ml were tested in replicates of four using the m2000sp and m2000rt instruments. (A) Amplification plots of the HIV-1 normalized FAM fluorescence versus cycle number. (B) Corresponding plots after applying the ratio transformation. (C) Plot of MR versus FCN values derived from the peaks of the ratio responses.
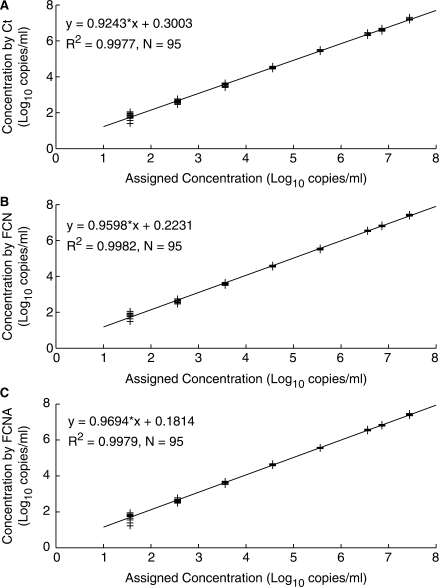
Comparable quantification performance using either Ct, FCN or FCNA values was observed as shown in Figure 3. Ct values were generated using m2000rt software. This system uses an automatic baselining algorithm, which determines the optimum background regression region on an individual responses basis.
Figure 3.
Analysis by maxRatio of a RealTime HIV-1 linearity panel. HIV-1 RNA ranging from 7.44 log10 copies/ml to 1.56 log10 copies/ml were tested using the m2000sp and m2000rt instruments. (A) Observed versus assigned concentration calculated using Ct values. (B) Observed versus assigned concentration calculated using FCN values. (C) Observed versus assigned concentration calculated using FCNA values.
Qualititative data analysis
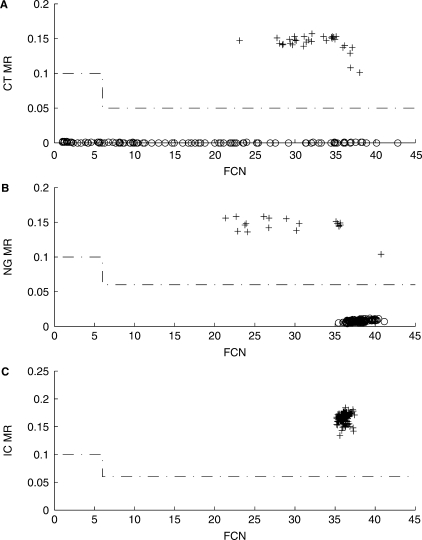
An Abbott RealTime Chlamydia trachomatis/Neisseria gonorrhoeae (CT/NG) assay (not available in the US) was used to test 623 patient specimens collected with the Abbott multi-Collect Specimen Collection Kit. The samples included male and female urine specimens, male urethral swab specimens and female endocervical and vaginal swab specimens. A total of 15 Abbott RealTime CT/NG runs were performed using three m2000sp and two m2000rt instruments. The maxRatio method was implemented without response shifting. Figure 4 shows the MR–FCN plots for a representative subset of the data. As can be seen, negative sample MR values are exceptionally low for C. trachomatis responses. Neisseria gonorrhoeae negative sample MR values are slightly elevated and have FCN values between 35 and 40 showing the effect of modest spectral crosstalk from the internal control responses.
Figure 4.
Analysis by maxRatio of RealTime CTNG results. Representative MR–FCN plots of (A) C. trachomatis responses (B) N. gonorrhoeae responses and (C) IC responses. Each plot represents collated responses from three out of the 15 runs. Reactive samples are denoted with a plus plot symbol and nonreactive with a circle plot symbol.
Detection of suppressed amplification
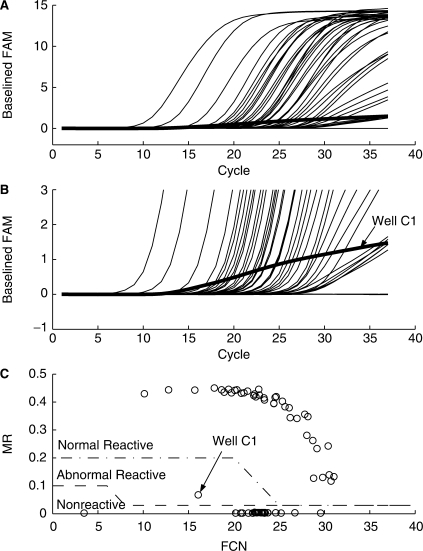
The MR value consistently identifies efficient from inefficient amplifications even in the presence of factors such as baseline anomalies. As discussed earlier, multiple ratio thresholds can be established to partition responses into categories such as nonreactive, normally reactive and abnormally reactive. Figure 5 demonstrates this approach using a RealTime HIV-1 example. A single well (C1) from this run had a suppressed amplification. The signal in this well starts rising above background as early as cycle 12, but clearly is not amplifying as strongly as the other reactive samples on the plate. The response for well C1 rises above the Ct threshold, but the accuracy of quantification would be in doubt. Final fluorescence level cannot be used to invalidate this well in that it is comparable to the final fluorescence from the wells with low viral load samples. Figure 5C shows the clear partitioning of this abnormal response from both the nonreactive and normal reactive responses using two ratio thresholds. This approach allows the ability to differentiate and invalidate such suppressed amplifications without requiring visual inspection by the operator. The Kinetic Outlier Detection (KOD) method presented by Bar et al. (9) presents an approach to detecting anomalous amplification using an absolute efficiency estimate. While a very attractive approach, this method shares the issues common to other methods which attempt to determine absolute efficiency from individual responses. In particular, sensitivity to the background subtraction process, difficulty of identifying the exponential region and complexity of implementation.
Figure 5.
Detection of suppressed amplification by maxRatio analysis of RealTime HIV-1 assay amplification plots. Single PCR run containing 72 samples processed using the m1000 and m2000rt instruments. (A) Amplification plots of the HIV-1 baselined FAM fluorescence versus cycle number. (B) Same responses plotted with a narrowed fluorescence range to highlight well C1 response. (C) Plot of MR versus FCN values for the assay responses showing partitioning of samples into nonreactive, normal reactive and abnormal reactive populations.
Primer dimers and other sources of nonspecific amplification can have a deleterious effect on assay signal. Nonspecific products can compete for resources and thereby interfere with specific amplifications. Alternatively, with SYBR assays, nonspecific amplification products can be falsely interpreted as positive reactions. Nonspecific reactions are usually inefficient with correspondingly low MR values. To the extent that nonspecific products affect the PCR response shape, then maxRatio should provide tools with which to identify compromised assay results. Both suppressed amplification and false positives can be handled using maxRatio analysis with careful selection of parameters.
Internal control evaluation
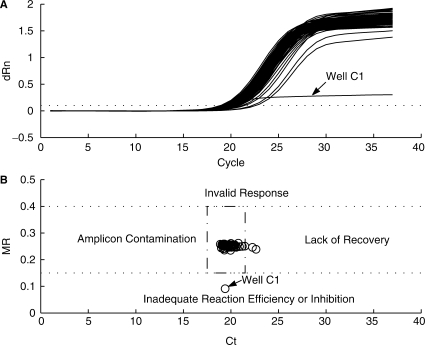
Real-time PCR assays commonly include an internal control. In Abbott RealTime assays, the internal control provides confirmation of the successful processing of the sample from sample preparation through amplification. For the Abbott RealTime HIV-1 assay, PCR amplification of the internal control (IC) is accomplished with a different set of primers than those used to amplify HIV-1. The IC primers target a sequence of 136 nt that is derived from the hydroxypyruvate reductase (HPR) gene from the pumpkin plant. The IC Probe is labeled with VIC dye. Because the IC is noncompetitive with the target reaction, the IC MR and cycle number values are expected to be consistent across all reactions independent of target concentration. Standard Ct analysis can only evaluate the internal control based on cycle number. The maxRatio analysis method may be used to provide a 2D evaluation of the internal control. When setting the ratio threshold for an internal control, the objective is not to distinguish reactive from nonreactive responses, but rather to distinguish normal reactive from unacceptable reactive responses. Using this 2D analysis, one can potentially distinguish between concentration and inhibition-related problems. Figure 6 illustrates this evaluation. The IC data from the same assay run used for Figure 5 is shown. As can be seen, the response from well C1 crosses the threshold at a comparable point to other reactions, but is significantly suppressed. This is reflected in the lower plot with a corresponding suppressed MR value. This response would not be deemed invalid by inspecting cycle number alone. Also present are several late rising internal control responses whose MR values are normal, but cycle numbers are delayed.
Figure 6.
IC evaluation by maxRatio. IC MR value versus Ct value corresponding to HIV-1 responses displayed in Figure 5.
Robustness to spectral crosstalk
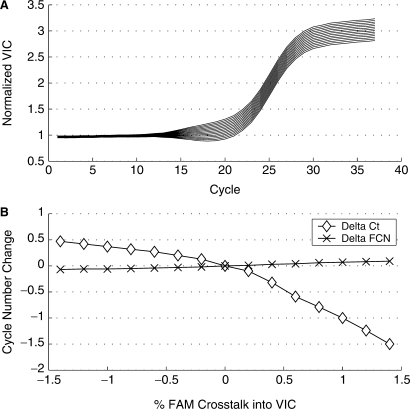
The broad, overlapping fluorescence spectra of dyes used in multiplex assays presents a challenge to accurately determine the contribution of each dye response to the measured signal. Although dye calibration procedures are in general very effective, several issues limit the ability to perfectly calibrate a system. These include variable read temperatures for different assays, differences in mastermix components compared to the dye calibration solution, quencher used and even the probe oligo sequence (10). As an example of the robustness of the maxRatio method to spectral crosstalk, the response from a single well (C6) in the HIV-1 data set shown in Figure 2 was modified by taking a fraction of the signal from the FAM response and adding it to the VIC response. This simulates the effect of spectral crosstalk commonly observed with multiplex assays. The FAM response in this reaction represents a typical 6.68 log copies/ml sample and the VIC response a typical internal control. From –1.4% to 1.4% of the FAM response was added to the VIC response in increments of 0.2%. Figure 7 shows the effect of spectral crosstalk on VIC Ct and FCN values. From nominal, over the range of spectral crosstalk tested, Ct values varied from –1.50 to 0.47. From nominal, FCN values varied only from –0.07 to 0.09 cycles.
Figure 7.
Spectral crosstalk analysis of an IC response from a 6.86 log10 copy/ml RealTime HIV-1 sample. (A) Amplification plots of the modified VIC IC reactions. (B) Plot of the difference in Ct and FCN cycle numbers from an unmodified response shown. Ct values calculated based on a threshold of 0.3 and FCN values calculated from normalized VIC responses.
Detection of Ct validity
By using both maxRatio and Ct methods simultaneously, an enhancement to analysis validity can be obtained. As shown in Figure 3, FCN, FCNA and Ct values closely correlate to log sample concentration. Because of this close correlation, they can be used to detect and invalidate responses with baselining errors. The cycle difference between the FCN or FCNA value and the Ct value tends to be nearly constant across the dynamic range for any particular assay. This cycle difference (FCNA – CT) can be monitored as a parameter to assess validity of the cycle number determination.
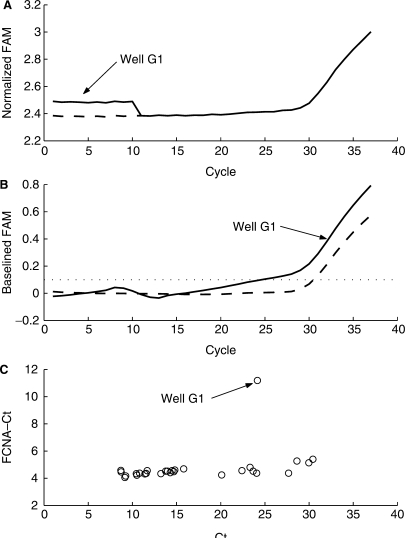
An example of how this FCNA – CT cycle difference is used to detect invalid responses is provided in Figure 8. The figure shows an anomalous assay response from an Abbott RealTime HCV (11) (not available in the US) run on the m2000rt with a manually prepared PCR plate. The response exhibits a discontinuity in the background region that caused an errant Ct determination. The exact source of the anomaly is unknown, but it is possibly due to a bubble in the PCR well or a similar transient event. The anomaly resulted in the baselining process tilting the response up causing it to cross the threshold early. To evaluate the impact of this tilt on the analysis, the response fluorescence data was manually corrected and reanalyzed. It should be noted that this manual correction is not part of the maxRatio analysis algorithm, but only used here to illustrate the ability to detect incorrect baselining. The Ct value of the original response was 24.16 and the FCNA value was 35.34. The corrected response Ct value was 30.48 and the FCNA value was 35.39. The baseline anomaly caused a 6.32 cycle Ct change with only a 0.05 cycle FCNA change. The cycle difference (FCNA – Ct) was 11.18 cycles for the uncorrected response and 4.91 cycles for the corrected response. Figure 8C displays the cycle difference for the 28 positive assay responses from the same PCR run. As can be seen, well G1 is clearly an outlier.
Figure 8.
Baseline anomaly of a RealTime HCV assay response. (A) Amplification plots of the HCV normalized FAM fluorescence versus cycle number. Solid line is actual response of well G1. Dashed line represents the same response with discontinuity removed. (B) Corresponding plots after Savitsky–Golay smoothing and baselining. (C) Plot of FCNA – Ct cycle difference versus Ct value for the 28 positive responses in the same PCR run.
CONCLUSION
The maxRatio method for analysis of real-time PCR reactions provides a measure of concentration (FCN or FCNA) together with a relative measure of reaction efficiency (MR) that are not present in other commonly used data analysis algorithms. These measures are consistently determined even in the presence of systematic and nonsystematic errors in amplification signals that can cause errors in interpretation for other methods. The relative reaction efficiency measurement by MR values provides an effective and reliable method for reactive/nonreactive determinations as well as discrimination of normal versus inhibited responses. Quantitative evaluation using maxRatio generated cycle numbers is comparable in linearity and precision to analysis based on Ct values. Although examples in this article utilize probes for signal generation, the method has been successfully applied to SYBR green assays as well and should work for any amplification signal that exhibits a roughly sigmoidal shape.
While maxRatio analysis can be used by itself to analyze PCR reactions, it may also be used to complement traditional Ct analysis. The maxRatio analysis technique can be used to determine assay reactivity so that Ct analysis is only applied to reactive signals. In addition, the Ct value can be compared to the maxRatio FCN or FCNA value to determine cycle number validity.
In the clinical laboratory setting, the data analysis method needs to be robust to common sources of variance which include multiple lots of assay reagents, the variability of a large instrument population and differences in operator skill and training. The robustness of the maxRatio method, along with the validity metrics it generates, provides the objective analysis necessary for an automated data analysis method for a clinical real-time PCR system.
ACKNOWLEDGEMENTS
Funding to pay the Open Access publication charges for this article was provided by Abbott Molecular, Inc., Des Plaines, IL.
Conflict of interest statement. None declared.
REFERENCES
- 1.Heid C, Stevens J, Livak K, Williams P. Real time quantitative PCR. Genome Res. 1996;6:986–994. doi: 10.1101/gr.6.10.986. [DOI] [PubMed] [Google Scholar]
- 2.Livak K, Schmittgen T. Analysis of relative gene expression data using real-time quantitative PCR and the 2−ΔΔCT method. Methods. 2001;25:402–408. doi: 10.1006/meth.2001.1262. [DOI] [PubMed] [Google Scholar]
- 3.Rasmussen R. Rapid Cycle Real-Time PCR: Methods and Applications. Springer Press, Heidelberg, 2001. Quantification on the LightCycler instrument. In Meuer S., Wittwer,C. and Nakagawara,K. pp. 21–34. [Google Scholar]
- 4.Tichopad A, Dilger M, Schwarz G, Pfaffl M. Standardized determination of real-time PCR efficiency from a single reaction set-up. Nucleic Acids Res. 2003;31:e122. doi: 10.1093/nar/gng122. [DOI] [PMC free article] [PubMed] [Google Scholar]
- 5.Swillens S, Goffard J, Marechal Y, de Kerchove d’Exaerde A, El Housni H. Instant evaluation of the absolute initial number of cDNA copies from a single real-time PCR curve. Nucleic Acids Res. 2004;32:e56. doi: 10.1093/nar/gnh053. [DOI] [PMC free article] [PubMed] [Google Scholar]
- 6.Ramakers C, Ruijter JM, Lekanne Deprez RH, Moorman A. Assumption-free analysis of quantitative real-time polymerase chain reaction (PCR) data. Neurosci. Lett. 2003;339:62–66. doi: 10.1016/s0304-3940(02)01423-4. [DOI] [PubMed] [Google Scholar]
- 7.Peirson SN, Butler JN, Foster RG. Experimental validation of novel and conventional approaches to quantitative real-time PCR data analysis. Nucleic Acids Res. 2003;31:e73. doi: 10.1093/nar/gng073. [DOI] [PMC free article] [PubMed] [Google Scholar]
- 8.Tang N, Huang S, Salituro J, Mak W, Cloherty G, Johanson J, Yu HL, Schneider G, Robinson J, Hackett J, Jr, et al. A real time HIV-1 viral load assay for automated quantitation of HIV-1 RNA in genetically diverse group M subtypes A-H, group 0 and group N samples. J. Virol. Methods. 2007 doi: 10.1016/j.jviromet.2007.07.003. [Epub ahead of print, doi:10.1016/j.jviromet.2007.07.003] [DOI] [PubMed] [Google Scholar]
- 9.Bar T, Stahlberg A, Muszta A, Kubista M. Kinetic outlier detection (KOD) in real-time PCR. Nucleic Acids Res. 2003;31:e105. doi: 10.1093/nar/gng106. [DOI] [PMC free article] [PubMed] [Google Scholar]
- 10.Marras S, Kramer F, Tyagi S. Efficiencies of fluorescence resonance energy transfer and contact-mediated quenching in oligonucleotide probes. Nucleic Acids Res. 2002;30:e122. doi: 10.1093/nar/gnf121. [DOI] [PMC free article] [PubMed] [Google Scholar]
- 11.Michelin B, Muller Z, Stelzl E, Marth E, Kessler H. Evaluation of the Abbott real time HCV assay for quantitative detection of hepatitis C virus RNA. J. Clin. Virol. 2007;38:96–100. doi: 10.1016/j.jcv.2006.11.007. [DOI] [PubMed] [Google Scholar]


