Abstract
Insight into the dependence of benthic communities on biological and physical processes in nearshore pelagic environments, long considered a “black box,” has eluded ecologists. In rocky intertidal communities at Oregon coastal sites 80 km apart, differences in abundance of sessile invertebrates, herbivores, carnivores, and macrophytes in the low zone were not readily explained by local scale differences in hydrodynamic or physical conditions (wave forces, surge flow, or air temperature during low tide). Field experiments employing predator and herbivore manipulations and prey transplants suggested top-down (predation, grazing) processes varied positively with bottom-up processes (growth of filter-feeders, prey recruitment), but the basis for these differences was unknown. Shore-based sampling revealed that between-site differences were associated with nearshore oceanographic conditions, including phytoplankton concentration and productivity, particulates, and water temperature during upwelling. Further, samples taken at 19 sites along 380 km of coastline suggested that the differences documented between two sites reflect broader scale gradients of phytoplankton concentration. Among several alternative explanations, a coastal hydrodynamics hypothesis, reflecting mesoscale (tens to hundreds of kilometers) variation in the interaction between offshore currents and winds and continental shelf bathymetry, was inferred to be the primary underlying cause. Satellite imagery and offshore chlorophyll-a samples are consistent with the postulated mechanism. Our results suggest that benthic community dynamics can be coupled to pelagic ecosystems by both trophic and transport linkages.
Keywords: productivity, currents, scale, community structure, upwelling
A recurring challenge to ecologists is to understand, and ultimately predict, the factors that determine structure in both natural and managed communities. At present, our understanding of the impact of ecological processes on community structure is based largely on research at small spatial scales. The influence of biotic and physical factors can vary across scales, however, and interpretations based on small-scale studies often need modification when larger scales are considered (1). Hence, further elucidation of the determinants of community structure will depend on the study of links between small-scale and large-scale processes.
In marine environments, nearshore pelagic and benthic ecosystems vary at different spatial and temporal scales, and until recently, interpretations of community dynamics in these adjacent habitats emphasized alternative viewpoints. Biological oceanographers, working offshore in a three-dimensional environment, usually stressed the roles of productivity, nutrients, and both horizontal and vertical transport, so-called “bottom-up” processes (2, 3), as determinants of community pattern. Oceanographers faced serious methodological and technical constraints in shallow water, however, and thus mostly avoided nearshore environments. Marine rocky intertidal ecologists, in contrast, working in a largely two-dimensional, space-limited environment, historically regarded bottom-up factors as less important sources of community differences than “top-down” factors such as predation or grazing. Nearshore pelagic environments were perceived as an open “bath” (4), and variation in oceanographic processes was assumed to obscure relationships at scales ranging from meters to even hundreds of kilometers. Thus, potential dynamical linkages between pelagic and benthic systems were rarely considered, and until recently nearshore ecosystems were an ecological black box. The major consequence is that research on rocky shores has succeeded in explaining community patterns (distribution, abundance) at local scales (tens to hundreds of meters), whereas understanding the basis of onshore patterns at mesoscales (thousands to tens of thousands of meters) has proven elusive.
Recent studies suggest links between nearshore nutrients and productivity, and benthic ecosystems can influence community structure. Duggins et al. (5) indicated that subtidal kelps in the Aleutian Islands, by generating organic detritus, may accelerate growth of filter-feeding, intertidal mussels and barnacles. Bustamante and coworkers (6, 7), working at both geographic (hundreds of kilometers) and local (up to hundreds of meters) spatial scales on the coast of South Africa, found that nutrients, microalgal productivity, and invertebrate grazer abundance were positively correlated. Their work suggests that detritus subsidies from kelp beds adjacent to intertidal areas controlled limpet density and biomass. In contrast, Wootton et al. (8), using small-scale (tens of centimeters) nutrient additions and herbivore exclosure experiments on Tatoosh Island, found weak nutrient effects on micrograzer abundance and no nutrient effect on algal biomass.
Here, we address the hypothesis that mesoscale oceanographic variability underlies differences in community structure at sites along the central Oregon coast on a scale of tens of kilometers. Our data are consistent with the idea that nearshore oceanographic processes may have important effects on benthic community structure.
BACKGROUND
Community ecologists have progressed dramatically in understanding the basis for patterns of distribution, abundance, and diversity in marine rocky shore systems (9–12). By the mid 1970s (10), early emphasis on physical explanations (e.g., wave force, temperature, desiccation) (13) were largely supplanted by biotic explanations (e.g., predation, competition), though both are now understood to be relevant. Despite increased understanding of the causes of community structure, however, some between-community differences, such as divergent patterns of zonation among sites (13), were unexplained. The idea that different processes were important at different scales grew from multisite investigations along environmental gradients, which stimulated the merger of biotic and abiotic alternatives. This synthesis proposed that among-community differences could be attributed in part to modification of local-scale biotic processes by larger-scale but shore-associated physical processes (e.g., wave forces, temperature, humidity) (9, 12, 14).
This “scaling up” gained momentum in the 1980s with a re-emphasis (15) of the potential importance of recruitment, for many species a larger-scale, current-dependent process (14, 16). The dependence of among-site community variation on nearshore pelagic productivity received little attention (but see refs. 17–20), probably due to perceptions that (i) coastal production varied little at scales less than hundreds of kilometers (21), (ii) space was the only limiting resource in intertidal habitats, and (iii) food levels for suspension feeders were usually not limiting (22, 23).
Contrasts Between Two Coastal Communities.
In pelagic environments, oceanographers have observed spatial and temporal variation in primary productivity and recognized its potential significance with respect to mesoscale patterns of community structure (24). For example, along the Oregon coast, large-scale (hundreds of kilometers) along-shore variability in levels of chlorophyll-a (Chl-a) was evident in oceanographic sampling (25, 26).
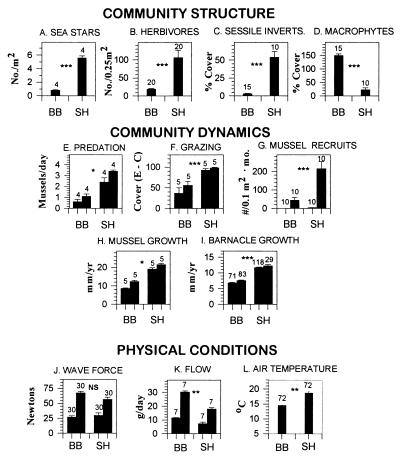
On the Oregon coast, contrasting patterns of community structure at two sites (Fig. 1 A–D) suggested that pelagic processes might effect benthic patterns (21). In the low intertidal zone at Boiler Bay (BB) (44° 50′ N, 124° 03′ W) (see refs. 27–29 for methods), abundance of macrophytes was high (e.g., Hedophyllum sessile, Phyllospadix scouleri, turf-forming red algae), and abundance of invertebrate filter-feeders, macroherbivores, and predators was low. At Strawberry Hill (SH) (44° 15′ N, 124° 07′ W), 83 km to the south (21), abundance of macrophytes was low, and abundance of filter-feeders (e.g., barnacles Chthamalus dalli, Balanus glandula, Pollicipes polymerus; mussels Mytilus trossulus), macro-herbivores (e.g., limpets Lottia spp.; the chiton Katharina tunicata), and predators (e.g., sea stars Pisaster ochraceus; whelks Nucella canaliculata, N. emarginata) were high. These patterns have persisted since at least 1981–1982 (30).
Figure 1.
Summaries (means ± 1 SEM) of community structure patterns, community dynamics, and physical conditions at wave-exposed sites at BB and SH. Sample numbers (numbers above error bars) were as follows: for community structure, quadrats; for predation and grazing, replicated experiments; for mussel recruitment, collectors/month; for mussel growth, transplant clumps (50 mussels/clump); for barnacle growth, individuals in each of two transplants/site; for wave force, daily measurements; for flow, 3 to 4-day measurements; and for air temperature, days of measurement. With the exception of grazing (F; see text) and temperature measurement (L), methods are in refs. 21, 27, and 31. Low tide air temperatures were obtained using battery-powered waterproof dataloggers (Alpha Omega model 9102). Analyses for differences between sites depended on the comparison. In all cases visual inspection indicated that residuals were normal and error terms were independent. All data were log- or arcsin-transformed before analysis. Probabilities: ∗∗∗, P < 0.0001; ∗∗, P < 0.001; ∗, P < 0.01; NS, not significantly different. Specific tests: for macrophytes and sessile invertebrates, MANOVA; for herbivore abundance, sea star abundance, sea star predation rate, herbivore grazing, mussel growth, and barnacle growth, ANOVA; for mussel recruitment, wave forces, and flow and temperature, repeated measures ANOVA. In MANOVA, probabilities were Bonferroni-adjusted by the number of tests (i.e., P = 0.05/2, or 0.025). Pairs of bars in E–H, J, and K indicate minimum and maximum values observed when studies were repeated in space (E, F, and H) or time (E, G, H, J, and K). In F, ordinate label is the difference in percent cover of microalgae in −grazer plots (E for exclosures) and +grazer plots (C for control).
Between-site differences in top-down and bottom-up processes were also documented. To quantify top-down (predation, grazing) interactions, we estimated rates of sea star predation on mussels and molluscan herbivore (limpets and chitons) grazing on microalgae. Sea star predation rate was estimated as the difference in mortality rates of transplanted mussels in replicate areas with sea stars present (+sea star) and absent (−sea star) (described in refs. 27 and 31). Molluscan grazing rates were determined in exclosure experiments in 1994 and 1995 by estimating the cover of algae (diatoms, algal sporelings, ulvoids, and filamentous greens) in the presence (+grazer) and absence (−grazer; exclusions using barriers of antifouling paint) (32) of grazers. Experimental plots were 20 × 30-cm areas of rock surface arranged in a randomized block design. These experiments indicated that both sea star predation and limpet/chiton grazing were higher at SH (Fig. 1 E and F).
Bottom-up effects, defined as recruitment of mussels and growth of invertebrate prey (mussels and barnacles; estimated with uncrowded individuals to avoid density effects), were also greater at SH. Mussel recruitment (i.e., the number of juveniles per month in plastic mesh collectors) has been consistently higher at SH since 1989 (ref. 27; Fig. 1G). Growth of both transplanted mussels and of barnacles growing on settlement plates was also higher at SH (Fig. 1 H and I). Interestingly, growth rates of macrophytes (Hedophyllum sessile, Phyllospadix scouleri) did not differ consistently between sites (B. Menge, unpublished data).
Differences in structure or dynamics were not associated with differences in hydrodynamic conditions. Wave forces were estimated using maximum wave force dynamometers, and water flow was indexed by rates of dissolution of dental chalk cylinders. All devices were deployed at comparable tide levels and wave exposures (31, 33). Maximum wave forces did not differ between sites (ref. 31; Fig. 1J). Water flow rates differed between sites but in the opposite direction to that expected. Higher flow rates occurred at the site (BB) with lower, not higher growth and recruitment rates (ref. 31; Fig. 1K). Air temperatures, quantified using waterproof sensors, were greater at SH during low tide (Fig. 1L), perhaps reflecting the lower frequency of cloud cover and fog observed at this site during the past decade. Air temperature differences were also opposite to the expected direction. High temperatures, which could inhibit recruitment and prey growth by killing recruits and damaging cellular growth machinery, occurred at the site (SH) with higher, not lower recruitment and growth rates. Finally, sand burial, unimportant at BB, can cause mortality of sessile invertebrates at wave-protected areas of SH (27) but has never been observed at wave-exposed areas. Preliminary studies suggest that sand scour effects are not important at SH exposed shores, but we cannot exclude this possibility. Other alternatives, such as shore geomorphological effects, could also influence community structure but have not yet been studied.
Nearshore Phytoplankton Concentrations.
Between-site ecological differences could depend directly or indirectly on planktonic primary productivity [a “bottom-up” factor (34)]. Phytoplankton concentration differences could directly determine growth rates of suspension feeders, for example. Further, by underlying different rates of prey production, phytoplankton variation could induce contrasting predation intensities and thus lead to community differences. Divergent community patterns were therefore postulated to depend in part on persistent differences in nearshore oceanic conditions (21).
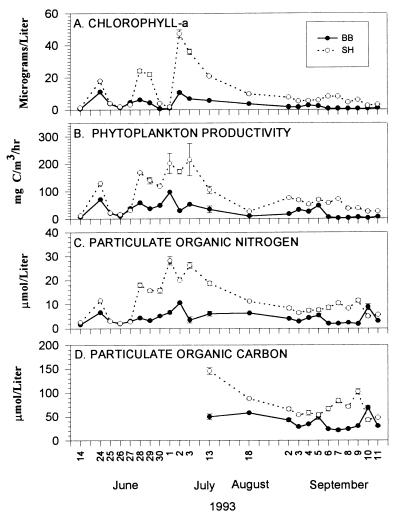
Low-tide, shore-based sampling revealed two potentially significant oceanographic patterns. First, particulate food differed dramatically between sites. In summer 1993, for instance, Chl-a, phytoplankton productivity, and particulates (most likely derived from phytoplankton) were always higher at SH (Fig. 2). Longer-term sampling indicated these differences were persistent. In 26 of 28 months (February 1993 to August 1995), concentrations were higher at SH (ref. 30; B.A.M. et al., unpublished data). Second, summer peaks of phytoplankton (Chl-a, productivity) and particulate abundance in 1993 (Fig. 2), 1994 (Fig. 3D), and 1995 (Fig. 4A) were always much greater at SH.
Figure 2.
Changes in phytoplankton and particulate organic material at BB and SH in summer 1993. Daily samples were taken during two relaxations (June 24 to July 3 and September 2–11); other values were monthly samples (note the time gaps on the abscissa). All measures were determined from replicated samples collected from shore at low tide in opaque HDPE plastic bottles (250 ml for Chl-a and particulates, 1000 ml for productivity). In 1993, a nested sampling design evaluated variation in Chl-a at different spatial scales: 1–2 m, tens of meters, hundreds of meters, and tens of kilometers (i.e., site). Differences between site accounted for most of the variance (usually 80–90%; ref. 30), so only site-level data are reported. (A) Chl-a was determined using a Turner Designs 10 fluorometer after extraction in 90% HPLC acetone for 12 hr in the dark at −20°C. (B) Phytoplankton primary production was estimated using light-dark bottle methodology with [14C]bicarbonate as a tracer (43). Six-hour incubations were done under simulated in situ conditions. Phytoplankton was collected on glass fiber filters, and radioactivity was determined using liquid scintillation counting. Productivity was calculated based on appropriate seasonal daylight periods as described in ref. 43. (C and D) Particulate material was collected on glass fiber filters and analyzed using a Carlo Erba CHN analyzer. Dissolved organic carbon was estimated from frozen filtered water samples using a Shimadzu gas chromatograph. SH estimates were significantly greater than those for BB in most samples (repeated measures ANOVA; sites differed at the P < 0.00001 level or more).
Figure 3.
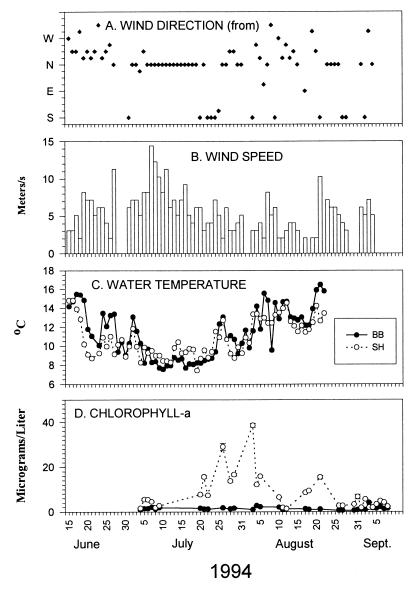
Offshore wind (direction, speed), onshore water temperature, and Chl-a levels at BB and SH in summer 1994. Wind data (A, B; readings taken at 11 a.m. or 2 p.m.) are from NOAA buoy NDBC 50, about 10 kilometers offshore from Newport, Oregon (44° 38′ N, 124° 02′ W). (C) Daily (higher high tide) water temperatures. Temperatures during the 18-day period from July 5 to July 23 were lower at BB (mean, 8.31°C vs. 9.12°C at SH; t = −4.0, 34 df, P = 0.0003). Temperatures during the 29-day period following this upwelling did not differ between sites (BB, 12.8°C; SH, 12.1°C; t = 1.59, 56 df, P = 0.12; assumptions of normal means and equal variances were met in both tests). (D) Chl-a (see ref. 30).
Figure 4.
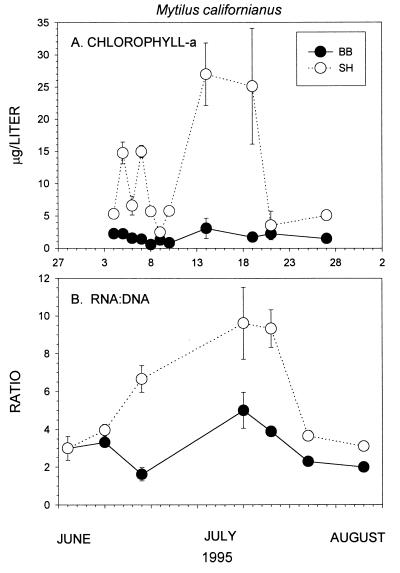
RNA:DNA ratios (A) and Chl-a levels (B) in summer 1995. Methods of measurement of RNA:DNA levels are given in ref. 36; levels of Chl-a are given in ref. 30. Error bars are standard errors.
Physiological Evidence.
The above results suggested that higher phytoplankton concentrations might explain the higher growth rates observed at SH. To determine if short-term differences in mussel growth were consistent with previously documented longer-term differences (27), we quantified RNA:DNA ratios in California mussels, Mytilus californianus. Because RNA concentrations in somatic tissue (adductor muscle) vary with growth as DNA concentrations remain relatively constant, the ratio between them provides a short-term physiological index of mussel growth (e.g., refs. 35 and 36).
RNA:DNA ratios differed between sites and varied with Chl-a concentration, as expected if higher phytoplankton led to higher growth. For example, during July 1995, RNA:DNA ratios of mussels were significantly greater at SH than at BB (Fig. 4B). Further, increased RNA:DNA ratios coincided with increased Chl-a concentrations (Fig. 4A). Similar changes were observed in summer 1994, both in mussels native to each site and in mussels transplanted between sites (36). Within weeks, ratios in transplanted mussels converged with those of local native mussels and diverged from those at the sites of origin. Thus, as in longer-term field measurements, physiological evidence suggests mussels grew faster with higher phytoplankton concentrations.
Coastal Patterns of Phytoplankton Concentration.
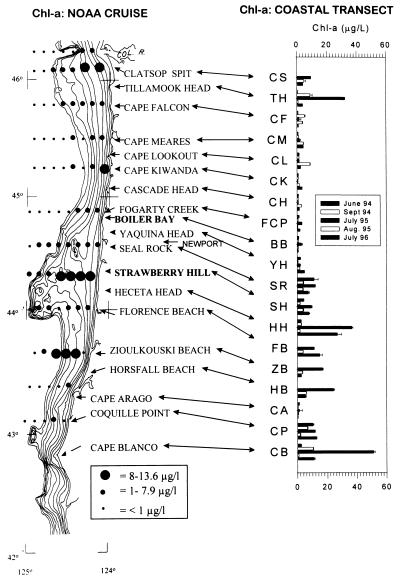
Are the mesoscale phytoplankton differences between these sites unusual or representative of larger-scale variation? To begin addressing this question, in 1994–1996 phytoplankton concentrations were sampled at 16–19 sites ranging from Clatsop Spit to Cape Blanco, a distance of 380 km. Moreover, we determined the correspondence between onshore patterns and those further offshore by comparing our data with offshore estimates (≥8 km) obtained on a summer 1994 cruise (ref. 37; Fig. 5).
Figure 5.
Continental shelf bathymetry (isobaths indicate 20-m depth intervals; contour furthest offshore is 200 m), Chl-a concentration of overlying waters (solid dots), and Chl-a concentrations at 16–19 sites along the Oregon coast from the Columbia River to Cape Blanco. Offshore Chl-a data from R. Emmett of NOAA (ref. 37).
The multisite data suggested that Chl-a concentrations at BB and SH are representative of a large-scale pattern of phytoplankton abundance, roughly increasing from north to south. Phytoplankton concentration was sometimes relatively high at the two most northern sites (Clatsop Spit, Tillamook Head), was consistently low from about Cape Falcon to Yaquina Head, and, except for Cape Arago, was often high from Seal Rock to Cape Blanco (Fig. 5).
In offshore waters, phytoplankton concentrations varied with the width of the continental shelf and tended to be high where onshore estimates were high. Offshore, most intermediate (1–7.9 μg/liter; medium-sized dot in Fig. 5) and high (8–13.6 μg/liter; large dot) concentrations were recorded over the shelf, and most low (<1 μg/liter; small dot) concentrations were recorded beyond the shelf. 37 (of 45) over-shelf samples had intermediate-to-high concentrations (29 intermediate, 8 high), whereas only 7 (of 38) beyond-shelf samples had intermediate-to-high concentrations (6 intermediate, 1 high) (Yates-corrected χ2 = 34.5, 1 df, P ≪ 0.0001). Further, 8 of the 9 highest offshore concentration estimates occurred seaward of high Chl-a sites (Fig. 5; the exception was a sample off Cape Kiwanda, a low Chl-a site).
DISCUSSION
A Trophic Benthic–Pelagic Link?
The oceanographic patterns documented above are consistent with the hypothesis that differences between BB and SH in rocky intertidal community structure and dynamics depend, in part, on bottom-up effects of phytoplankton. Specifically, differences in filter-feeder growth rates and abundance, trophic interactions, and perhaps prey recruitment rates (through increased survival of larvae or recruits with high food) may depend on consistently different phytoplankton concentrations. More phytoplankton means more food for filter feeders and thus faster growth. High phytoplankton concentration could increase recruitment by increasing survival of larvae or recruits and by producing better fed, larger recruits that are more resistant to physical stresses. This effect has recently been documented for larvae and recruits of the barnacle Balanus glandula (R. Emlet, personal communication). Higher secondary production could help support the denser predator populations (Fig. 1A) and thus underlie the higher predation rates at SH.
Because benthic algal growth rates did not differ between sites (B.A.M. et al., unpublished data), higher grazing at SH may depend on differences in grazer recruitment rates, perhaps enhanced by high phytoplankton. Whereas chitons have non-feeding larvae, most limpets have feeding larvae (38). Thus, larval limpet survival or growth may also increase with high phytoplankton, leading to higher recruitment, higher limpet abundance, and more intense grazing.
Although other factors (e.g., recruitment rates per se, independent of phytoplankton productivity) may also be affected by the nearshore current patterns, our results, with those of Bustamante et al. and others (5–7), suggest that bottom-up factors may underlie variation among nearshore benthic communities, particularly at larger spatial and temporal scales.
Potential Oceanographic Mechanisms.
What are the causes of the among-site differences in Chl-a? Alternative, but not necessarily mutually exclusive, hypotheses include differential effects of nutrients, coastal hydrodynamics, zooplankton grazing, phytoplankton species composition, and river effects. At present, we lack offshore data at the level of resolution that is needed to rigorously test these alternatives. Moreover, evidence consistent with nutrient, zooplankton, and phytoplankton species composition postulates would simply move the question a link along the causal chain and not identify the ultimate causal mechanism. If phytoplankton were correlated with nutrients, for example, we would then need to learn why nutrients varied among sites. Nonetheless, current information suggests that the coastal hydrodynamics hypothesis is the most likely underlying mechanism and that nutrient differences are unlikely to explain phytoplankton variation.
Nutrient Hypothesis.
Nutrient concentrations could vary clinally along shore and, with greater concentrations at SH, support higher levels of phytoplankton.
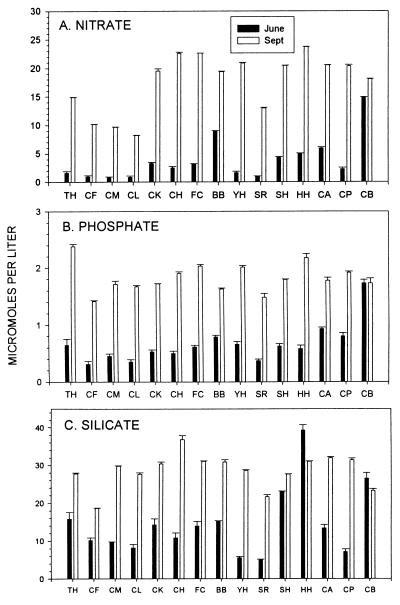
At BB and SH, nutrient (nitrate, nitrite, phosphate, silicate, ammonium) concentrations did not vary consistently with Chl-a concentrations (30). This surprising result was observed at all spatial and temporal scales. Samples taken on temporal scales from daily (during summer upwelling relaxations) to monthly [for three consecutive years (1993–1995)] periods occasionally revealed differences between sites, but no consistent between-site trends were observed (ref. 30; B.A.M. et al., unpublished data). The 15-site samples detected among-site differences in nutrient (nitrate, silicate, phosphate) concentrations, but no among-site, large spatial scale trends comparable with that for Chl-a were evident (Fig. 6). Available evidence is thus inconsistent with a “nutrient” hypothesis as an explanation of differences in Chl-a.
Figure 6.
Nutrients (nitrate, phosphate, silicate) at 15 sites (see Fig. 5 legend) on June 15 and September 1, 1994. Northern sites are at the left. Methods are described in refs. 30 and 43. Among-site differences are highly significant (MANOVA; P ≪ 0.0001 with 84,301 df), but trends are not correlated to those of Chl-a (r ≤ 0.5, P > 0.05 in all cases; see Fig. 5).
Coastal Hydrodynamics Hypothesis.
Chl-a may reflect nearshore variation in coastal upwelling and water circulation. Such differences could favor phytoplankton retention and growth at SH and other high Chl-a sites, increasing total primary production and phytoplankton concentrations.
Several lines of evidence suggest that among-site differences in Chl-a ultimately depend on nearshore physical oceanographic processes. First, physical events seem to trigger blooms. For example, in 1994 strong southerly coastal winds (Fig. 3 A and B) coincided with sharp decreases in intertidal seawater temperature (Fig. 3C), presumably reflecting the arrival at the surface of upwelled waters (e.g., refs. 39–41). Temperatures remained low during nearly 3 weeks of upwelling and increased sharply on July 25, heralding the onset of a relaxation (refs. 40–42, Fig. 3; another briefer upwelling-relaxation cycle occurred in mid-August). Chl-a subsequently increased with the temperature increase at SH but, unexpectedly, not at BB.
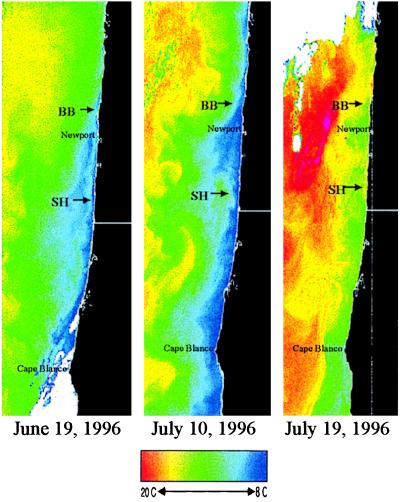
Firm understanding of consistent between-site differences in Chl-a concentrations will depend ultimately on simultaneously quantifying temporal variation in the three-dimensional nearshore distributions of nutrients and phytoplankton and the circulation patterns. No such knowledge currently exists, but the basis of between-site differences in Chl-a can be inferred from the lower temperatures at BB during upwelling (Fig. 3C) and from current patterns reflected in satellite imagery of sea surface temperature (SST; Fig. 7). Past measurements show that a current “jet” flows along the upwelling SST “front” (the boundary between the warmer offshore water and the colder, upwelled water) and that regions of higher productivity are often found inshore of this jet (42). The region of cold water (blue band nearshore) is very narrow at and north of BB (Fig. 7, left and center panels), expanding in width south of BB. This indicates that the upwelling-front jet flows south close to the coast at BB, then turns offshore, following the shelf break, shown as the most seaward depth contour in Fig. 5. The tendency for the jet to follow the shelf break creates an onshore meander around Florence Beach, south of SH. SST patterns during upwelling-favorable winds (left and center panels of Fig. 7) indicate that the flow breaks into eddies, depicted by tongues of warmer water (yellow and green) that penetrate the colder water near SH.
Figure 7.
Sea surface temperature (AVHRR) images off Oregon in summer 1996. Colder temperatures are blue, warmer are yellow and red. White areas are clouds. The left and center images were taken on upwelling days, and the right image was taken on a relaxation day. BB, SH, the town of Newport, and Cape Blanco are indicated.
The hydrodynamic mechanism we propose to explain the spatial differences in phytoplankton concentrations is fairly simple. The upwelling-front jet lies close to the coast at BB, quickly transporting newly upwelled water to the south and southwest. This maintains the lower temperatures at BB by constantly bringing upwelled water to the surface to replace the water removed by the jet. This also maintains the lower phytoplankton concentrations, as the upwelled water is low in phytoplankton but high in nutrients. As the jet moves offshore, slower velocities are found next to the coast in the region around SH. At the same time, phytoplankton in the region of enriched water on the inshore side of the jet grow, increasing their concentrations. Thus, the slower flow and the eddies offshore of SH contain higher phytoplankton concentrations. During relaxation of upwelling winds, the nearshore flow becomes northward and onshore near SH, carrying the increased phytoplankton concentrations next to the coast (and coincidentally creating favorable conditions for larval recruitment). At BB, even during these relaxations, the upwelling front and jet seem to remain close to the coast, whereas the SST patterns near SH indicate a complex, eddying pattern (Fig. 7, right panel).
The fundamental mechanism underlying variation in along-shore phytoplankton concentrations seems to be variability in nearshore physical oceanographic conditions, specifically in along-shore and offshore currents. The fact that Chl-a concentrations and SST were higher at SH and that high concentrations occupied a broader zone than at BB (Figs. 2, 3, 4, 5) is consistent with this interpretation. The detailed kinematics and dynamics responsible for the different flow patterns have not been studied in these regions, so the proposed link between the currents and the phytoplankton, SST, and nutrient fields has not been verified. However, it is a simple hypothesis that could be tested by modern oceanographic survey methods.
The other three alternatives seem unlikely as fundamental causes of differences in phytoplankton. Whereas zooplankton grazing is often associated with low phytoplankton concentration and thus could be postulated to be more effective at controlling phytoplankton populations at BB than at SH, available evidence suggests that zooplankton are likely to be more, not less abundant at SH. Higher recruitment densities of mussels (Fig. 1G) and some barnacles at SH relative to BB suggest their planktotrophic larvae may also be more abundant at SH. If so, however, the pattern would be opposite to expectation, as higher zooplankton grazing should maintain lower, not higher phytoplankton concentration at SH.
Phytoplankton species composition may differ between sites (M. Wood, personal communication), and hence, those off SH could have higher growth potential than those off BB. Although this possibility is unstudied, if true, this difference would need explanation. The last potential mechanism, rivers, could affect phytoplankton populations by delivering nutrients or low-salinity water. Among-site differences could result if some sites were close to rivers whereas others were not. However, both high Chl-a sites (e.g., Clatsop Spit, Tillamook Head, and Seal Rock) and low Chl-a sites (e.g., Cape Arago) have large rivers to northward (i.e., upcurrent), whereas other high and low Chl-a sites do not have nearby large rivers upcurrent. Although the effects of rivers on nearshore communities merits investigation, intertidal phytoplankton concentration seems unrelated to river proximity.
We thus conclude that between-site variation in community structure and dynamics may depend in part on consistent differences in phytoplankton concentration and that variation in phytoplankton is most simply explained by mesoscale variability in nearshore hydrography. If future study supports this interpretive hypothesis, the trophically based benthic-pelagic mechanism envisioned here has important implications for responses of coastal ecosystems to meso- and large-scale perturbations, such as severe El Niños and global climate change. Our results may also further encourage the development of predictive models of the dynamics of nearshore ecosystems.
Acknowledgments
Comments by G. Allison, J. Barth, E. Berlow, A. Blaustein, J. Burnaford, P. Halpin, M. Hixon, J. Lubchenco, K. Nielsen, R. Paine, R. Smith, C. Trowbridge, and two reviewers greatly improved the manuscript. Several of these and C. Blanchette, B. Buckley, G. Hudson, A. Krueger, T. Mulch, J. Nichols, S. Navarrete, L. Ryan, and M. Willis assisted with field work. We thank the National Science Foundation, the Andrew W. Mellon Foundation, and a John Simon Guggenheim Fellowship (B.A.M.) for support.
ABBREVIATIONS
- Chl-a
chlorophyll-a
- BB
Boiler Bay
- SH
Strawberry Hill
- SST
sea surface temperature
References
- 1.Levin S A. Ecology. 1992;73:1943–1967. [Google Scholar]
- 2.Persson L, Bengtsson J, Menge B A, Power M E. In: Food Webs: Integration of Patterns & Dynamics. Polis G A, Winemiller K O, editors. New York: Chapman and Hall; 1995. pp. 396–434. [Google Scholar]
- 3.Carpenter S R, editor. Complex Interactions in Lake Communities. New York: Springer; 1988. [Google Scholar]
- 4.Paine R T, Levin S A. Ecol Monogr. 1981;51:145–178. [Google Scholar]
- 5.Duggins D O, Simenstad C A, Estes J A. Science. 1989;245:170–173. doi: 10.1126/science.245.4914.170. [DOI] [PubMed] [Google Scholar]
- 6.Bustamante R H, Branch G M, Eekhout S. Ecology. 1995;76:2314–2329. [Google Scholar]
- 7.Bustamante R H, Branch G M, Eekhout S, Robertson B, Zoutendyk P, Schleyer M, Dye A, Hanekom N, Keats D, Jurd M, McQuaid C. Oecologia. 1995;102:189–201. doi: 10.1007/BF00333251. [DOI] [PubMed] [Google Scholar]
- 8.Wootton J T, Power M E, Paine R T, Pfister C A. Proc Natl Acad Sci USA. 1996;93:13855–13858. doi: 10.1073/pnas.93.24.13855. [DOI] [PMC free article] [PubMed] [Google Scholar]
- 9.Connell J H. In: Ecology and Evolution of Communities. Cody M L, Diamond J, editors. Harvard University Press, Cambridge, MA: Belknap; 1975. pp. 460–490. [Google Scholar]
- 10.Paine R T. Marine Rocky Shores and Community Ecology: An Experimentalist’s Perspective. Oldendorf/Luhe, Germany: Ecology Institute; 1994. [Google Scholar]
- 11.Moore P G, Seed R, editors. The Ecology of Rocky Coasts. New York: Columbia Univ. Press; 1986. [Google Scholar]
- 12.Menge B A, Farrell T M. Adv Ecol Res. 1989;19:189–262. [Google Scholar]
- 13.Lewis J R. The Ecology of Rocky Shores. London: English Universities Press; 1964. [Google Scholar]
- 14.Menge B A, Sutherland J P. Am Nat. 1987;130:730–757. [Google Scholar]
- 15.Grosberg R K, Levitan D R. Trends Ecol Evol. 1992;7:130–133. doi: 10.1016/0169-5347(92)90148-5. [DOI] [PubMed] [Google Scholar]
- 16.Roughgarden J, Gaines S D, Possingham H. Science. 1988;241:1460–1466. doi: 10.1126/science.11538249. [DOI] [PubMed] [Google Scholar]
- 17.Bosman A L, DuToit J T, Hockey P A R, Branch G M. Estuarine Coastal Shelf Sci. 1986;23:283–294. [Google Scholar]
- 18.Bosman A L, Hockey P A R. Mar Ecol Prog Ser. 1986;32:247–257. [Google Scholar]
- 19.Bosman A L, Hockey P A R, Siegfried W R. Oecologia (Berlin) 1987;72:226–232. doi: 10.1007/BF00379273. [DOI] [PubMed] [Google Scholar]
- 20.Leigh E G, Jr, Paine R T, Quinn J F, Suchanek T H. Proc Natl Acad Sci USA. 1987;84:1314–1318. doi: 10.1073/pnas.84.5.1314. [DOI] [PMC free article] [PubMed] [Google Scholar]
- 21.Menge B A. Ecology. 1992;73:755–765. [Google Scholar]
- 22.Levinton J. Am Nat. 1972;106:472–486. [Google Scholar]
- 23.Buss L W, Jackson J B C. J Exp Mar Biol Ecol. 1981;49:151–161. [Google Scholar]
- 24.Raymont J E G. Plankton and Productivity in the Oceans: Phytoplankton. 2nd Ed. Vol. 1. Oxford: Pergamon; 1980. [Google Scholar]
- 25.Small L F, Menzies D W. Deep Sea Res. 1981;28A:123–149. [Google Scholar]
- 26.Strub P T, James C, Thomas A C, Abbott M R. J Geophys Res. 1990;95:11501–11530. [Google Scholar]
- 27.Menge B A, Berlow E L, Blanchette C A, Navarrete S A, Yamada S B. Ecol Monogr. 1994;64:249–286. [Google Scholar]
- 28.Menge B A. Ecol Monogr. 1976;46:355–393. [Google Scholar]
- 29.Lubchenco J, Menge B A, Garrity S D, Lubchenco P J, Ashkenas L R, Gaines S D, Emlet R, Lucas J, Strauss S. J Exp Mar Biol Ecol. 1984;78:23–73. [Google Scholar]
- 30.Menge B A, Daley B A, Wheeler P A, Strub P T. Limnol Oceanogr. 1997;42:57–66. [Google Scholar]
- 31.Menge B A, Daley B A, Wheeler P A. In: Food Webs: Integration of Pattern and Dynamics. Polis G A, Winemiller K O, editors. New York: Chapman and Hall; 1995. pp. 258–274. [Google Scholar]
- 32.Cubit J. Ecology. 1984;65:1904–1917. [Google Scholar]
- 33.Bell E C, Denny M W. J Exp Mar Biol Ecol. 1994;181:9–29. [Google Scholar]
- 34.McQueen D J, Johannes M R S, Post J R, Stewart T J, Lean D R S. Ecol Monogr. 1989;59:289–309. [Google Scholar]
- 35.Frantzis A, Gremare A, Vetion G. J Exp Mar Biol Ecol. 1992;156:125–138. [Google Scholar]
- 36.Dahlhoff E P, Menge B A. Mar Ecol Prog Ser. 1997;177:97–107. [Google Scholar]
- 37.Bentley P J, Emmett R L, Lo N C H, Moser H G. CalCOFI Rep. 1996;37:193–200. [Google Scholar]
- 38.Strathmann M F. Reproduction and Development of Marine Invertebrates of the Northern Pacific Coast. Seattle: University of Washington Press; 1987. [Google Scholar]
- 39.Huyer A, Pillsbury R D, Smith R L. Limnol Oceanogr. 1975;20:90–95. [Google Scholar]
- 40.Smith R L. J Geophys Res. 1974;79:435–443. [Google Scholar]
- 41.Smith R L. In: Upwelling in the Ocean: Modern Processes and Ancient Records. Summerhayes C P, et al., editors. New York: Wiley; 1995. pp. 39–64. [Google Scholar]
- 42.Huyer A E. Progr Oceanogr. 1983;12:259–284. [Google Scholar]
- 43.Parsons T R, Maita Y, Lalli C M. A Manual of Chemical and Biological Methods for Seawater Analysis. New York: Pergamon; 1984. [Google Scholar]


