

Abstract
Proteolytic activation of the protective antigen (PA) component of anthrax toxin allows it to self-associate into a ring-shaped homoheptamer, [PA63]7, which can bind the enzymatic components, lethal factor (LF) and edema factor (EF). [PA63]7 is a pore-precursor (prepore), and under the low pH conditions of the endosome, it forms a transmembrane pore that allows LF and EF to enter the cytosol. We labeled PA with donor and acceptor fluorescent dyes and used Förster resonance energy transfer to measure the assembly and disassembly kinetics of the prepore complex in solution. The dissociation rate constant for [PA63]7 was 1 × 10⁻⁶ s-1 (t1/2 ∼7 days). In contrast, a ternary complex containing the PA-binding domain of LF (LFN) bound to a PA63 dimer composed of two non-oligomerizing mutants, dissociated rapidly (t1/2 ∼1 minute). Thus, the substantial decrease in the rate of disassembly of [PA63]7 relative to the ternary complex is due to the cooperative interactions among neighboring subunits in the heptameric ring. Low concentrations of LFN promoted assembly of the prepore from proteolytically activated PA, whereas high concentrations inhibited assembly of both the prepore and the ternary complex. A self-assembly scheme of anthrax toxin complexes is proposed.
Anthrax toxin, a major virulence factor of Bacillus anthracis, consists of three nontoxic proteins that interact at the mammalian cell surface or in solution to form toxic noncovalent complexes (1, 2). The three proteins are edema factor (EF), a calmodulin-dependent adenylate cyclase; lethal factor (LF), a Zn2+-metalloprotease; and protective antigen (PA83, 83 kDa), a non-enzymatic protein that, after proteolytic activation, can bind EF and LF and deliver them to the cytosol of mammalian cells. Once within the cytosol, EF and LF catalyze reactions that cause deleterious effects on the host (3-5).
The following model of anthrax toxin assembly and action at the cellular level has emerged in recent years. PA83 binds to either of two known cell surface receptor proteins (6, 7). A cellular protease of the furin family then cleaves PA83 into a “nicked” form (nPA83) containing 2 fragments: PA20 (20 kDa), corresponding to the N-terminus, and PA63 (63 kD), corresponding to the C-terminus (8, 9). PA20 dissociates into the medium and plays no further known role in toxin action. Its removal eliminates a steric barrier to self-association of PA63, allowing this fragment to oligomerize and form a heptameric ring-shaped structure, [PA63]7, termed the prepore (10). The PA63 prepore is able to bind up to three molecules of LF and/or EF competitively and with nanomolar affinity (11, 12). The resulting complexes are localized to detergent-resistant lipid microdomains, where they undergo receptor-mediated endocytosis (13). Acidification of the toxin-containing compartment causes a structural rearrangement of the prepore that enables it to insert into the membrane and form a pore (14, 15). Pore formation is linked to translocation of the bound enzymatic cargo (LF or EF) to the cytosol by an acid-induced unfolding mechanism (16-18). LF cleaves members of the mitogen-activated protein kinase kinase family (4, 5), leading by a still poorly defined sequence of events to host cell death. Elevation of the cAMP concentration by EF protects the bacteria from phagocytic destruction (19).
The assembly of toxic complexes from PA, EF, and LF can be replicated in solution when trypsin or a serum protease is used to activate PA (14). In the absence of EF or LF, the PA20 and PA63 fragments tend to remain associated via noncovalent interactions (equilibrium dissociation constant ≈ 190 nM; (20)). When PA63 is separated from PA20 by anion-exchange chromatography of nPA83, it spontaneously oligomerizes to the prepore state (14). Alternatively, oligomerization of PA63 can be stimulated by adding LF, EF, or their PA63-binding N-terminal domains (LFN and EFN, respectively) to nPA83 in solution (21, 22). As no quantitative study of PA63 oligomerization or dissociation has been reported, we describe here measurements of the kinetics of PA63 oligomer formation and dissociation in solution.
Materials and Methods
Protein expression and purification
PA83 (K563C, D512K K563C, K199E R468A R470D K563C) and LFN (residues 1-263 of LF) were produced recombinantly in E. coli BL-21 DE3 Star using the pET 22b expression system for PA83 and pET 15b expression system for LFN as described previously (22). Briefly, the proteins were expressed in cultures grown in a 5-liter fermentor using ECPM1 media supplemented with 50 mg/l carbenicillin until reaching an OD600 of 3-10 (22, 23). The cultures were induced with IPTG (0.8-1 mM) for 3-4 h at 27-30°C for PA83 and 37°C for LFN until reaching a final OD600 of 6-20. Periplasmic lysates were buffered with 20 mM Tris-Cl (pH 8.5) and supplemented with 2 mM dithiothreitol to prevent oxidation of the Cys residues. PA83 was purified by anion exchange chromatography (Q Sepharose) with a 0Π250 mM NaCl gradient using Buffers A (20 mM Tris-Cl, 1 mM CaCl2, pH 8.5) and B (A + 1 M NaCl). Hexahistadine tagged LFN was purified from cell pellets lysed by French press and sonication using Ni2+-affinity chromatography.(24) Pure fractions, as determined by SDS-PAGE, were concentrated and stored at -80°C. Protein concentrations were determined by absorbance spectrophotometry (ε280 (PA83) 75,670 M-1cm-1 and (LFN) 18,040 M-1cm-1).
Preparation of nPA83 and [PA63]7
Nicked PA83 (nPA83) was prepared using TPCK-treated trypsin (Sigma) by incubating PA83 (1-2 mg/ml) in Buffer C (A+ 150 mM NaCl) for 35 min at room temperature at a 1:1000 w/w ratio trypsin:PA83 followed by addition of 1:100 w/w ratio of soybean trypsin inhibitor (Sigma) to prevent further proteolysis. This procedure yielded a >90% nicking efficiency. [PA63]7 was prepared at >95% purity using anion exchange chromatography. Briefly, nPA83 was loaded onto the column (Q sepharose) followed by elution using a 0Π500 mM NaCl gradient with Buffers A and B. Separation of PA20 from PA63 was followed by spontaneous oligomerization of PA63 on column. Pure fractions, as determined by SDS-PAGE were concentrated and stored at -80°C. [PA63]7 concentrations were determined by absorbance spectrophotometry (ε280 347,480 M-1cm-1).
Fluorescent labeling of proteins
Proteins with single Cys mutations were labeled with Alexa fluor 488 C5 maleimide, Alexa fluor 546 C5 maleimide, or Alexa fluor 594 C5 maleimide (Invitrogen) using manufacturer’s procedures. Protein solutions were exchanged back into Buffer C by gel filtration. The protein conjugates’ dye-to-protein ratios were 0.9-1.2 as determined by absorbance spectrophotometry. Dye-labeled proteins were stored at -80°C.
Measurements of kd for [PA63]7
[PA63]7 was purified from a 1:1 mixture of nPA83 K563C labeled with Alexa fluor 488 (nPA83 K563C*488) and nPA83 K563C labeled with Alexa fluor 546 or Alexa fluor 594 (nPA83 K563C*564, nPA83 K563C*594). The purified [PA63]7 contained both donor and acceptor labels ([PA63]7*FRET). For rapid dilution experiments, [PA63]7*FRET was diluted from 10 μM to 10 nM in Buffer D (50 mM Tris-Cl pH 8.5, 150 mM NaCl, 0.5 mg/ml BSA, and 0.02% NaN3). In competition experiments, 10 nM labeled [PA63]7*FRET and 250 nM unlabeled [PA63]7 were combined in Buffer D. In both experiments, fluorescence emission ratio (570 / 525 ± 10 nm emission, 488 ± 4 nm excitation from Xe arc lamp) was monitored using a spectrofluorometer over 16 days. Solution temperatures were ∼20°C throughout the entire experiment. Data were fit to a single exponential decay model using non-linear least squares to recover the observed dissociation constant, kd.
Additional experiments contained the protein denaturant Guanidine HCl (GdmHCl). Varying amounts of GdmHCl (0 to 0.6 M, as determined by refractive index) were added to 10 nM heptamer solutions in Buffer D. Fluorescence emission ratio (615 / 525 ± 16 nm emission, 488 nm excitation from Ar+ laser) was monitored using a spectrofluorometer over 10 days. All solutions were maintained at 20°C throughout the entire experiment. Data were fit to a single exponential decay model using non-linear least squares to recover the observed dissociation constant, kd.
Since measurements of kd required long incubation periods at room temperature, all solutions were sterile filtered and supplemented with 0.02% NaN3 to inhibit microbial growth that could lead to degradation of the non-covalent protein complexes. SDS-PAGE was used to monitor PA63 proteolysis over a 16 day period. Briefly, a 20 nM solution of [(PA63)7]*488 in Buffer D was incubated at either ∼20°C or at -20°C for 16 days. At the conclusion of this period, the room temperature incubated sample was again frozen at -20°C until electrophoresis. These solutions were loaded onto a 4-20% polyacrylamide gel. The gel was washed in ddH2O and observed on a UV transilluminator to excite the Alexa dye without fixing or staining which quenches the fluorescence.
Measurements of kd for [(PA63)2·LFN] ternary complex
[(PA63)2·LFN] was prepared by incubating a 1:1:1 mixture of nPA83 D512K K563C labeled with Alexa fluor 488 (nPA83 D512K K563C*488), nPA83 K199E R468A R470D K563C labeled with Alexa 546 (nPA83 K199E R468A R470D K563C*546), and LFN at 5 μM (total nPA83 was 10 μM). All [(PA63)2·LFN] contained both donor and acceptor labels ([(PA63)2·LFN]*FRET). [(PA63)2·LFN]*FRET was diluted from 5 μM to 10 nM in Buffer D and the fluorescence emission ratio measured over time (570 / 525 ± 16 nm emission, 488 nm Ar+ laser line excitation). The kinetic transients were fit to a single exponential decay model (Eqn 1) using non-linear least squares analysis to recover the observed rate constant, kd. where the amplitude at time 0, A, decays with respect to time, t. The offset, C, is the final value reached when the system achieves equilibrium.
| Eqn 1 |
Measurement of ka for [(PA63)7·(LFN)3] and [(PA63)2·LFN]
Association rates of [(PA63)7·(LFN)3] were determined by mixing 1:1 ratios of nPA83 K563C*488 and nPA83 K563C*594 at concentrations between 1.2 and 120 nM, followed by addition of variable concentrations of LFN (1 × 10⁻⁹ to 1 × 10⁻⁵ M) to prompt oligomerization in solution. Oligomerization was monitored by measuring sensitized emission (FRET) via a fluorescence emission ratio of intensity (615 nm / 525 nm). Similarly, association rates were determined for [(PA63)2·LFN] by mixing 1:1 ratios of nPA83 D512K K563C*488 and nPA83 K199E R468A R470D K563C*546 at concentrations between 1.2 and 120 nM, followed by addition of variable concentrations of LFN (1 × 10⁻⁹ to 1 × 10⁻⁵ M) to prompt complex formation in solution. [(PA63)2·LFN] formation was monitored by measuring the sensitized emission (FRET) via a fluorescence emission ratio (570 nm / 525 nm ± 16 nm). All data were fit using non-linear least squares analysis to a second order exponential decay model (Eqn 2), where the amplitude at time 0, A, decays with respect to time, t.(22) The offset, C, is the final value reached when the system achieves equilibrium.
| Eqn 2 |
Results
Dissociation kinetics of [PA63]7
Equal parts of two differently labeled PA83 mutants, PA83 K563C*488 and PA83 K563C*546 (or PA83 K563C*594), were combined, proteolytically activated with trypsin, and loaded onto an anion exchange column. FRET-labeled [PA63]7 ([PA63]7*FRET) was isolated by gradient elution and found to show significant FRET (Figure 1, dashed line) compared to the control of an unnicked equimolar mixture of donor and acceptor labeled PA83 (Figure 1, solid line). The dissociation rate constant (kd) of [PA63]7*FRET was measured after dilution of the complex from 10 μM to 10 nM. The decline in FRET as a function of time was monitored over 16 days, with the fluorescence emission ratio (570 nm / 525 nm, 488 nm excitation) serving as the metric. We fit the observed kinetic transients (Figure 2A) to a single exponential decay function (Eqn. 1) and calculated the kd to be 1 ± 1 × 10⁻⁶ s-1, corresponding to a t1/2 of 7 days. When a 25-fold excess (250 nM) of unlabeled [PA63]7 was present, the results were indistinguishable from those obtained in the absence of the unlabeled protein (Figure 2B).
Figure 1.
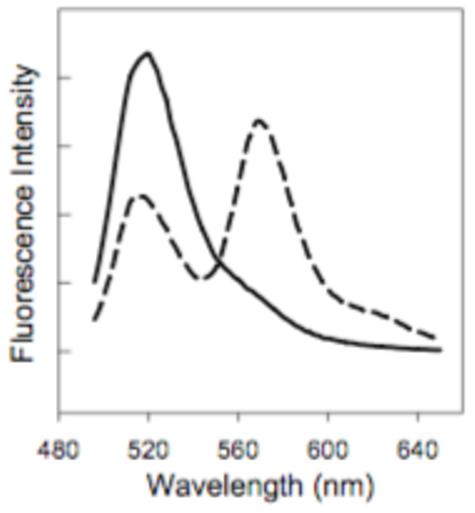
Fluorescence emission spectra of [PA63]7*FRET and PA83 control. Fluorescence emission spectrum of [PA63]7*FRET (100 nM; dashed line) prepared by mixing equal parts nPA83 K563C*488 + nPA83 K563C*546 and allowing it to oligomerize on an anion exchange column followed by purification from PA83 and PA20. Fluorescence emission spectrum of PA83 prepared by mixing equal parts PA83 K563C*488 and PA83 K563C*546 (100 nM total PA83; solid line). Excitation using 488 nm line of Ar+ laser. Emission bandpass was 8 nm for both spectra.
Figure 2.
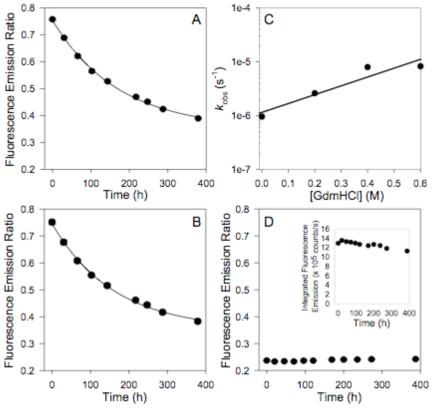
Dissociation of [PA63]7*FRET. A) Rapid dilution of [PA63]7*FRET from 10 μM to a final concentration of 10 nM. Dissociation (decrease in FRET) was monitored over time by measuring the fluorescence emission ratio (570 nm/520 nm; 488 nm excitation). Error bars represent 95% c.l. B) Competition of 10 nM [PA63]7*FRET with 200 nM unlabeled [PA63]7. Dissociation (decrease in FRET) was monitored over time by measuring the fluorescence emission ratio (570 nm / 520 nm; 488 nm excitation). Error bars represent 95% c.l. C) Plot of recovered kd vs. [GdmHCl] for the rapid dilution of [PA63]7*FRET with low concentrations of GdmHCl (0 - 0.6 M) added to accelerate the observed dissociation rate. D) Controls: The fluorescence emission ratio of an equimolar mixture of PA83 K563C*488 and PA83 K563C*546 (unnicked) was monitored over time. The inset shows the integrated intensity over the course of an experiment. Error bars for both controls represent the 95% c.l. All experimental kinetic transients were fitted to a single-exponential decay model to recover kd. All experiments were conducted at 20°C.
We also performed dilution experiments in the presence of low concentrations of GdmHCl to check the accuracy of the measured value of kd. [PA63]7*FRET was diluted from 10 μM to 10 nM in solutions of 0.2 to 0.6 mM GdmHCl, and the loss of FRET due to complex dissociation was monitored, as before. The low concentrations of GdmHCl employed accelerated the rate of dissociation (the majority of signal change occurred during the first 2-4 days), while avoiding protein unfolding. The observed kinetic transients were fitted to a single exponential decay function to recover kd and the rate constants were plotted vs. GdmHCl concentration (Figure 2C). Extrapolating kinetics data to 0 M GdmHCl yielded a value of kd for [PA63]7 identical to that determined in the absence of GdmHCl. This agreement suggested that proteolysis was not likely to contribute significantly to the observed kinetics. Additional support for this came from SDS-PAGE (Figure 3) of [(PA63)7]*488 that had been incubated at room temperature for 16 days and a control which was stored at -20°C during the experiment. Figure 3 shows showed that there was little change of intact PA63 following the long incubation. To minimize proteolysis, all solutions had been sterile filtered and supplemented with 0.02% NaN3 to inhibit microbial growth.
Figure 3.
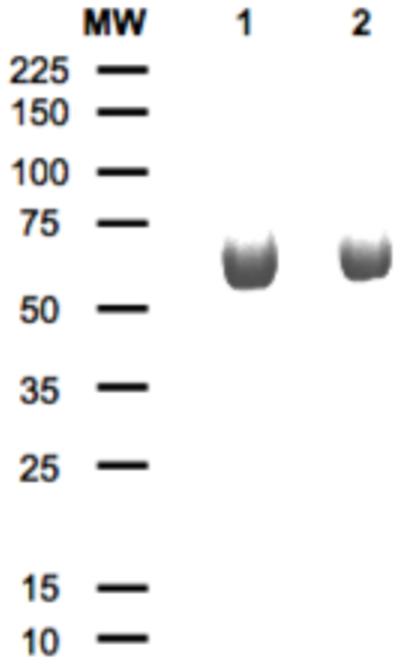
SDS-PAGE of [(PA63)7]*488 incubated in Buffer D for 16 days with MW markers indicated in kDa at left: room temperature incubation (lane 1); -20°C storage (lane 2).
To obtain a baseline for the observed changes in FRET, we mixed equal parts of unnicked PA83 K563C*488 and PA83 K563C*546 and monitored the fluorescence emission ratio over time. Consistent with the inability of PA83 to self-associate, the fluorescence emission ratio was in the limit of no detectable [PA63]7 in solution and was stable over the time course of the experiment. Also, changes in fluorescence emission intensity were minimal (< 10%) over 400 hours, indicating that losses to adsorption to cuvette walls were negligible (Figure 2D inset). Small changes in total emission intensity over time did not affect kinetics values, as they were calculated from the ratio of fluorescence emission intensities.
Association kinetics of [PA63]7·LFN
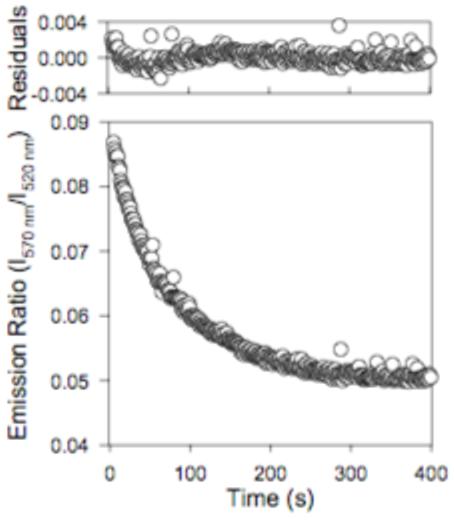
Because the equilibrium of PA63 oligomerization is so strongly in favor of [PA63]7, neither monomeric PA63 nor sub-heptameric oligomers of the wild-type fragment have ever been isolated. Hence it has not been possible to study the kinetics of PA63 association in a homogeneous system (20). Nonetheless, LF or EF, or their N-terminal PA63-binding domains promote oligomerization of PA63, starting with nPA83, presumably by displacing PA20 and bridging associated PA63 subunits. Therefore we chose to examine the oligomerization process in the presence of LFN. Various concentrations of LFN (10 nM to 10 μM) were added to a mixture of equal parts of nPA83 K563C*488 and nPA83 K563C*594 (12-150 nM), and increases in FRET were monitored over time by the 615 nm / 525 nm fluorescence emission ratio. Recorded kinetic transients were fitted to Eqn 2 (second-order kinetics) to recover ka (Figure 4A), and the observed rates were plotted vs. the concentration of LFN (Figure 4C). Since LFN has been shown to promote PA63 oligomerization in solution, we expected that raising the LFN concentration would increase the observed association rate, and indeed this was observed at relatively low concentrations of LFN. However, as the LFN concentration was raised above 50 nM, the observed oligomerization rate declined. In contrast, significant differences in observed rates were not observed for a ten-fold difference in nPA83 concentration, suggesting that the rate determining step in association does not directly involve PA63 (Figure 4C).
Figure 4.
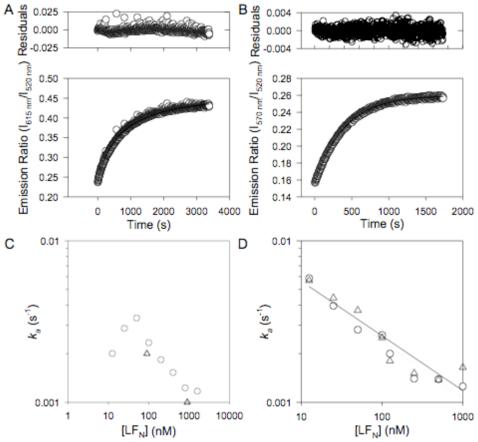
Determination of the association rates for [PA63]7*FRET and [(PA63)2·LFN]*FRET. A) Representative data for oligomerization of PA63 in the presence of LFN. An equimolar mixture of nPA83 K563C*488 and nPA83 K563C*594 (12 nM total nPA83) where LFN (100 nM) was added at t = 0. The increase in FRET due to PA63 association was monitored by fluorescence emission ratio. Data fit to a second-order model (Eqn 2). Residuals are shown in the upper plot. B) Representative data for the dimerization of non-oligomerizing PA83 mutants in the presence of LFN. An equimolar mixture of nPA83 D512K K563C*488 and nPA83 K199E R468A R470D K563C*546 (12 nM nPA83 total) where LFN (100 nM) was added at t = 0. The increase in FRET due to the association of PA63 was monitored by fluorescence emission ratio. Data fit to a second-order model. Residuals are shown in the upper plot. C) Graph of observed rate constant (ka) for PA63 association vs. concentration of LFN. Circles represent data for 12 nM nPA83; triangles represent data for 150 nM nPA83. D) Graph of observed rate constant (ka) for PA63 dimerization of non-oligomerizing PA83 mutants. Circles represent data for 12 nM nPA83; triangles represent data for 120 nM nPA83. Data are fit by linear regression (solid line, 12 nM nPA83; dotted line, 120 nM nPA83).
Association kinetics of [PA63]2·LFN
To investigate the basis of this phenomenon, we studied the assembly of a ternary complex containing an equimolar ratio of LFN and each of two non-oligomerizing, mutant forms of PA63. Mogridge et al. described D512K as a point mutation on one face of PA63 that blocked self-association of the protein; and a set of three mutations (K199E, R468A, and R470D) on the complementary oligomerization surface of the protein had the same effect (21). Neither the single mutant nor the triple mutant alone bound LFN, but when the two were combined in the presence of LFN, a ternary complex containing one equivalent of each of the three proteins was formed (21). In this complex, [PA63]2·LFN, the single and triple mutant forms of PA63 presumably associate via their complementary, wild-type faces, with LFN bound to them in the same way it binds to pairs of adjacent subunits within the prepore (21).
To create a FRET-based assay of PA63 self-association, we introduced the K563C mutation into both of the oligomerization-deficient mutants and labeled the single (now double) mutant with Alexa 488 and the triple (now quadruple) mutant with Alexa 546. Each preparation was nicked with trypsin, and equal parts of nPA83 D512K*488 and nPA83 K199E D468A R470D K563C*546 were mixed at concentrations between 12 and 120 nM. LFN was then added at various concentrations to initiate dimerization of the PA63 mutants. The fluorescence emission ratio was recorded as a function of time, and the data were fit to Eqn 2 to recover ka. As shown in Figure 4D, the association rate declined as the LFN concentration was raised, as seen in higher LFN concentration ranges with wild-type nPA83.
Dissociation kinetics of double-labeled [(PA63)2·LFN]
[(PA63)2·LFN]*FRET was diluted from 5 μM to 10 nM, and the fluorescence emission ratio (570 nm/520 nm emission, 488 nm excitation) was monitored. The kinetics transients were fit using a single exponential decay model to recover kd (Figure 5). The measured kd for the [(PA63)2·LFN]*FRET was 1.3 ± 0.01 × 10⁻² s-1 (t½ = 53 s), showing that dissociation was 10,000-fold faster than with the [PA63]7*FRET.
Figure 5.
Dissociation of [(PA63)2·LFN]. [(PA63)2 LFN]*FRET was rapidly diluted from 5 μM to a final concentration of 10 nM. A decrease in FRET was monitored over time by measuring the fluorescence emission ratio (lower plot; 570 nm / 520 nm; 488 nm excitation). All data were fitted to a single-exponential decay model to recover kd. Residuals were plotted (upper plot). Kinetic transients were acquired at 20°C.
Discussion
We have measured the kinetics of [PA63]7 dissociation and association in the presence of LFN using FRET between donor and acceptor fluorophores introduced into PA83. Since PA83 contains no Cys residues, we used mixtures of Cys mutants (K563C) labeled with either Alexa fluor 488 (donor), Alexa fluor 546 (acceptor), or Alexa fluor 594 (acceptor) in our experiments. The K563C mutation has been shown not to affect activity of PA83 (25). From the [PA63]7 crystallographic structure, the distance between adjacent K563 residues is approximately 59 Å. Since the Förster distance for these two dyes was estimated to be 55 Å, FRET is an effective reporter of PA63 oligomerization (22). We also made kinetic measurements of PA63·PA63 dissociation and association using the [(PA63)2·LFN] construct (PA83 D512K and PA83 K199E R468A R470D) in the presence of LFN. We expect that the distance between the adjacent K563 residues in the [(PA63)2·LFN] complex is similar to that in the [PA63]7 complex, such that FRET effectively monitors its association state. Since the FRET labels were on PA63 and not LFN, we only monitored the PA63 dissociation.
Disassembly of [PA63]7 was very slow, with a kd of ∼10-6 s-1. A 10,000-fold faster dissociation rate, ∼10-2 s-1, was observed for the PA63 dimer bridged by LFN. The markedly slower dissociation rate of the heptamer presumably results from cooperative interactions of each subumit with neighboring subunits in the homoheptameric ring. We surmise that the slower dissociation rate of the PA63 heptamer translates into a substantially increased thermodynamic stability of the heptamer relative to individual PA63 dimer interactions.
The substantial stability of [PA63]7 is of more than theoretical interest, as it impinges on the ability of dominant-negative mutant forms of PA to serve as potent antitoxins, and hence as potential therapeutics for treating anthrax infections. Certain point mutations in the pore forming domain (domain 2) of PA block the ability of the [PA63]7 prepore to undergo the conformational transition to the pore (e.g., D425A), or else block the translocation activity of the pore, once it is formed (e.g., F427A) (26, 27). A subset of the mutant forms of PA were found to be dominant-negatives (DN), such that co-oligomerization of low stoichiometric ratios of mutant to wild-type PA yielded inactive prepores or pores. This DN phenotype depends not only on the co-oligomerization of mutant PA63 with wild-type being stochastic, but also on the stability of the prepore, which precludes subunit-subunit exchange that might allow wild-type PA63 subunits to recombine to form uniformly wild-type heptamers.
Determination of association rates for PA63 is complicated by the intrinsic affinity of PA20 and its ability, when bound, to block self-association of PA63. In cells, when membrane-bound nPA83 molecules dissociate to PA20 and PA63, the PA63 is constrained to the two-dimensional membrane surface, while the PA20 is free to dissociate into extracellular solution. As a result, the concentration of PA63 in the membrane is effectively elevated relative to PA20, and this may facilitate PA63 oligomerization. The picture is somewhat different in solution, where, except at sub-micromolar concentrations, PA20 and PA63 remain associated via non-covalent interactions. In this case, oligomeric PA63 does not exist at any measurable concentrations without the addition of at least one of the ancillary proteins: LF, LFN (N-terminal binding domain of LF), or EF (20). Our working hypothesis is that in solution, LF (or LFN) prompts oligomerization by binding to PA63 and preventing it from associating with PA20.
We made association rate measurements of [(PA63)7·(LFN)3] and [(PA63)2·LFN] using donor and acceptor labeled mixtures of nPA83 with variable LFN concentrations. Unlike the measured kd’s, only small differences (factor of 2) were observed between the ka’s for [(PA63)7·(LFN)3] and [(PA63)2·LFN]. Notably, the observed association rate constants decreased with increasing concentrations of LFN. This apparently indicates that LFN inhibits PA63 oligomerization at higher concentrations. The measured heptamer ka initially increased with LFN as expected, but then decreased at higher LFN concentrations. The dimer ka consistently decreased with increasing LFN concentration. Initially we hypothesized that high LFN concentrations selectively populated PA63 dimers bridged by LFN, thereby reducing free PA63 concentration. Because an unliganded PA63 subunit is necessary to complete the [PA63]7 ring, this could effectively inhibit assembly of toxic complexes. However, subsequent measurements of [(PA63)2·LFN] ka also demonstrated a negative dependence on LFN concentration, indicating the existence of another or competing source of the observed rate decreases.
Consistent with these data, we propose the following mechanism (Scheme 1), to account for the observed rate behavior. In this case, oligomerization would proceed through formation of PA63 dimers bridged by LFN (similar to the [(PA63)2·LFN] complex), and PA63·LFN complex formation would be a competing pathway that inhibits heptamer formation. At high LFN concentrations, closing the heptamer ring structure could not proceed without dissociation of LFN from PA63 and is not favored. In addition, since the observed ka is independent of nPA83 concentration, binding of PA63 to LFN must occur only after a rate determining unimolecular rearrangement of LFN.
Scheme 1.

Oligomerization of PA63 in the presence of LFN.
Since our proposed mechanism predicts the existence of a [PA63·LFN] species, we attempted to detect this species using FRET. We titrated nPA83 D512K K563C*488 with LFN E126C labeled with Alexa fluor 594 (LFN E126C*594) and also measured dissociation of the putative [LFN E126C*594·PA63 D512K K563C*488] by rapid dilution of the complex while measuring the fluorescence emission ratio (data not shown). Although significant populations of FRET complex were not detected, these data do not rule out the existence of a [PA63·LFN] complex. Supposing the [PA63·LFN] species had a Kd of 10 μM-1 mM, accurate measurement of Kd would require such high concentrations of protein to make FRET observation unlikely. In addition, a low affinity complex may have a very short individual lifetime and relatively fast off-rates, and would not be detectable using a slow kinetic approach. The complex could also be oriented such that the donor-acceptor distance approaches or exceeds twice the Förster distance, making complex association or dissociation invisible to FRET measurement. Hence, while we are currently unable to observe this interaction, we assert that the most likely mechanism for LFN-mediated oligomerization of PA63 is one in which both the [PA63·LFN] and [(PA63)2·LFN] intermediates may precede or compete with [PA63]7. A LFN·LFN interaction could contribute to the observed negative rate dependence, but no precedent exists for such an interaction. Thus we propose that the overpopulation of putative [(PA63)2·LFN] and [PA63·LFN] intermediates may be the source of the observed LFN-dependent slowing of PA63 oligomerization.
Acknowledgments
K.A.C. thanks P.C. Ackroyd for help preparing and evaluating this manuscript. We also thank R.-A.L. Pimental for her help with protein production and purification. One of us (RJC) holds equity in PharmAthene, Inc.
Abbreviations
- PA
Protective Antigen
- [PA63]7
Protective Antigen homoheptamer
- LF
Lethal Factor
- EF
Edema Factor
- LFN
Lethal Factor N-terminal domain
- PA83
83 kD full length Protective Antigen
- nPA83
nicked Protective Antigen (83 kD)
- PA20
20 kD N-terminal fragment of Protective Antigen
- PA63
63 kD C-terminal fragment of Protective Antigen
- EFN
Edema Factor N-terminal domain
- FRET
Förster resonance energy transfer
- cAMP
cyclic adenosine monophosphate
- TPCK
l-1-Tosylamide-2-phenylethylchloromethyl ketone
- IPTG
Isopropyl β-d-thiogalactoside
- DTT
Dithiothreitol
- nPA83 K563C*488
nicked Protective Antigen, residue 563 labeled with Alexa fluor 488 C5 maleimide
- nPA83 K563C*546
nicked Protective Antigen, residue 563 labeled with Alexa fluor 546 C5 maleimide
- nPA83 K563C*594
nicked Protective Antigen, residue 563 labeled with Alexa fluor 594 C5 maleimide
- [PA63]7*FRET
Protective Antigen homoheptamer containing a 1:1 ratio of Protective Antigen where residue 563 is labeled with Alexa fluor 488 plus either Alexa fluor 546 or 594
- GdmHCl
Guanidine HCl
- [PA63]2·LFN
Ternary complex of 1:1 ratio of Protective Antigen non-oligomerizing mutants (D512K and K199E R468A R470D) plus the N-terminal domain of Lethal Factor
- nPA83 D512K K563C*488
non-oligomerizing Protective Antigen mutant, residue 563 labeled with Alexa fluor 488
- nPA83 K199E R468A R470D K563C*546
non-oligomerizing Protective Antigen mutant, residue 563 labeled with Alexa fluor 546
- [PA63]2·LFN*FRET
Protective Antigen ternary complex with the Lethal Factor N-terminal domain labeled at Protective Antigen residue 563 with Alexa fluor 488 and 546
- [PA63]7·(LFN)3
Protective Antigen homoheptamer saturated with N-terminal domain of Lethal Factor ligands
- LFN E126C*594
N-terminal domain of Lethal Factor, residue 126 labeled with Alexa fluor 594 C5 maleimide
- PA63·LFN
putative 1:1 complex with Protective Antigen and LFN
- kd
dissociation rate constant
- ka
association rate constant
- DN
Protective Antigen mutant that displays dominant negative phenotype
- Kd
equilibrium dissociation constant
- Cys
cysteine
Footnotes
This work was supported by NIH grant R37-A1022021 (R.J.C.).
References
- (1).Smith H. Discovery of the anthrax toxin: the beginning of in vivo studies on pathogenic bacteria. Trends Microbiol. 2000;8:199–200. doi: 10.1016/s0966-842x(00)01755-8. [DOI] [PubMed] [Google Scholar]
- (2).Smith H, Stoner HB. Anthrax toxic complex. Fed. Proc. 1967;26:1554–1557. [PubMed] [Google Scholar]
- (3).Duesbery NS, Resau J, Webb CP, Koochekpour S, Koo HM, Leppla SH, Vande Woude GF. Suppression of ras-mediated transformation and inhibition of tumor growth and angiogenesis by anthrax lethal factor, a proteolytic inhibitor of multiple MEK pathways. Proc. Natl. Acad. Sci. U. S. A. 2001;98:4089–94. doi: 10.1073/pnas.061031898. [DOI] [PMC free article] [PubMed] [Google Scholar]
- (4).Pellizzari R, Guidi-Rontani C, Vitale G, Mock M, Montecucco C. Lethal factor of Bacillus anthracis cleaves the N-terminus of MAPKKs: analysis of the intracellular consequences in macrophages. Int. J. Med. Microbiol. 2000;290:421–7. doi: 10.1016/S1438-4221(00)80056-9. [DOI] [PubMed] [Google Scholar]
- (5).Vitale G, Pellizzari R, Recchi C, Napolitani G, Mock M, Montecucco C. Anthrax lethal factor cleaves the N-terminus of MAPKKs and induces tyrosine/threonine phosphorylation of MAPKs in cultured macrophages. Biochem. Biophys. Res. Commun. 1998;248:706–11. doi: 10.1006/bbrc.1998.9040. [DOI] [PubMed] [Google Scholar]
- (6).Bradley KA, Mogridge J, Mourez M, Collier RJ, Young JA. Identification of the cellular receptor for anthrax toxin. Nature. 2001;414:225–9. doi: 10.1038/n35101999. [DOI] [PubMed] [Google Scholar]
- (7).Scobie HM, Rainey GJ, Bradley KA, Young JA. Human capillary morphogenesis protein 2 functions as an anthrax toxin receptor. Proc. Natl. Acad. Sci. U. S. A. 2003;100:5170–4. doi: 10.1073/pnas.0431098100. [DOI] [PMC free article] [PubMed] [Google Scholar]
- (8).Klimpel KR, Molloy SS, Thomas G, Leppla SH. Anthrax toxin protective antigen is activated by a cell surface protease with the sequence specificity and catalytic properties of furin. Proc. Natl. Acad. Sci. U. S. A. 1992;89:10277–81. doi: 10.1073/pnas.89.21.10277. [DOI] [PMC free article] [PubMed] [Google Scholar]
- (9).Molloy SS, Bresnahan PA, Leppla SH, Klimpel KR, Thomas G. Human furin is a calcium-dependent serine endoprotease that recognizes the sequence Arg-X-X-Arg and efficiently cleaves anthrax toxin protective antigen. J. Biol. Chem. 1992;267:16396–402. [PubMed] [Google Scholar]
- (10).Petosa C, Collier RJ, Klimpel KR, Leppla SH, Liddington RC. Crystal structure of the anthrax toxin protective antigen. Nature. 1997;385:833–8. doi: 10.1038/385833a0. [DOI] [PubMed] [Google Scholar]
- (11).Elliott JL, Mogridge J, Collier RJ. A quantitative study of the interactions of Bacillus anthracis edema factor and lethal factor with activated protective antigen. Biochemistry. 2000;39:6706–13. doi: 10.1021/bi000310u. [DOI] [PubMed] [Google Scholar]
- (12).Mogridge J, Cunningham K, Collier RJ. Stoichiometry of anthrax toxin complexes. Biochemistry. 2002;41:1079–82. doi: 10.1021/bi015860m. [DOI] [PubMed] [Google Scholar]
- (13).Abrami L, Liu S, Cosson P, Leppla SH, van der Goot FG. Anthrax toxin triggers endocytosis of its receptor via a lipid raft-mediated clathrin-dependent process. J. Cell Biol. 2003;160:321–8. doi: 10.1083/jcb.200211018. [DOI] [PMC free article] [PubMed] [Google Scholar]
- (14).Blaustein RO, Koehler TM, Collier RJ, Finkelstein A. Anthrax toxin: channel-forming activity of protective antigen in planar phospholipid bilayers. Proc. Natl. Acad. Sci. U. S. A. 1989;86:2209–13. doi: 10.1073/pnas.86.7.2209. [DOI] [PMC free article] [PubMed] [Google Scholar]
- (15).Milne JC, Collier RJ. pH-dependent permeabilization of the plasma membrane of mammalian cells by anthrax protective antigen. Mol. Microbiol. 1993;10:647–53. doi: 10.1111/j.1365-2958.1993.tb00936.x. [DOI] [PubMed] [Google Scholar]
- (16).Krantz BA, Trivedi AD, Cunningham K, Christensen KA, Collier RJ. Acid-induced Unfolding of the Amino-terminal Domains of the Lethal and Edema Factors of Anthrax Toxin. 2004;344:739. doi: 10.1016/j.jmb.2004.09.067. [DOI] [PubMed] [Google Scholar]
- (17).Zhang S, Finkelstein A, Collier RJ. Evidence that translocation of anthrax toxin’s lethal factor is initiated by entry of its N terminus into the protective antigen channel. PNAS. 2004;101:16756–16761. doi: 10.1073/pnas.0405754101. [DOI] [PMC free article] [PubMed] [Google Scholar]
- (18).Zhang S, Udho E, Wu Z, Collier RJ, Finkelstein A. Protein Translocation through Anthrax Toxin Channels Formed in Planar Lipid Bilayers. Biophys. J. 2004;87:3842–3849. doi: 10.1529/biophysj.104.050864. [DOI] [PMC free article] [PubMed] [Google Scholar]
- (19).O’Brien J, Friedlander A, Dreier T, Ezzell J, Leppla S. Effects of anthrax toxin components on human neutrophils. Infect. Immun. 1985;47:306–10. doi: 10.1128/iai.47.1.306-310.1985. [DOI] [PMC free article] [PubMed] [Google Scholar]
- (20).Christensen KA, Krantz BA, Melnyk RA, Collier RJ. Interaction of the 20 kD and 63 kD fragments of the anthrax toxin protective antigen: kinetics and thermodynamics. Biochemistry. 2005;44:1047–1053. doi: 10.1021/bi047791s. [DOI] [PubMed] [Google Scholar]
- (21).Mogridge J, Cunningham K, Lacy DB, Mourez M, Collier RJ. The lethal and edema factors of anthrax toxin bind only to oligomeric forms of the protective antigen. PNAS. 2002;99:7045–7048. doi: 10.1073/pnas.052160199. [DOI] [PMC free article] [PubMed] [Google Scholar]
- (22).Wigelsworth DJ, Krantz BA, Christensen KA, Lacy DB, Juris SJ, Collier RJ. Binding Stoichiometry and Kinetics of the Interaction of a Human Anthrax Toxin Receptor, CMG2, with Protective Antigen. J. Biol. Chem. 2004;279:23349–23356. doi: 10.1074/jbc.M401292200. [DOI] [PubMed] [Google Scholar]
- (23).Bernard A, Payton M. Production of recombinant proteins. John Wiley & Sons, Inc.; New York: 2004. [Google Scholar]
- (24).Wesche J, Elliott JL, Falnes PO, Olsnes S, Collier RJ. Characterization of membrane translocation by anthrax protective antigen. Biochemistry. 1998;37:15737–15746. doi: 10.1021/bi981436i. [DOI] [PubMed] [Google Scholar]
- (25).Mourez M, Yan M, Lacy DB, Dillon L, Bentsen L, Marpoe A, Maurin C, Hotze E, Wigelsworth D, Pimental RA, Ballard JD, Collier RJ, Tweten RK. Mapping dominant-negative mutations of anthrax protective antigen by scanning mutagenesis. Proc. Natl. Acad. Sci. U. S. A. 2003;100:13803–8. doi: 10.1073/pnas.2436299100. [DOI] [PMC free article] [PubMed] [Google Scholar]
- (26).Krantz BA, Melnyk RA, Zhang S, Juris SJ, Lacy DB, Wu Z, Finkelstein A, Collier RJ. A Phenylalanine Clamp Catalyzes Protein Translocation Through the Anthrax Toxin Pore. Science. 2005;309:777–781. doi: 10.1126/science.1113380. [DOI] [PMC free article] [PubMed] [Google Scholar]
- (27).Sellman BR, Mourez M, Collier RJ. Dominant-negative mutants of a toxin subunit: An approach to therapy of anthrax. Science. 2001;292:695–697. doi: 10.1126/science.109563. [DOI] [PubMed] [Google Scholar]