Abstract
Background
Raised C-reactive protein (CRP) is a risk factor for type 2 diabetes. According to the Mendelian randomization method, the association is likely to be causal if genetic variants that affect CRP level are associated with markers of diabetes development and diabetes. Our objective was to examine the nature of the association between CRP phenotype and diabetes development using CRP haplotypes as instrumental variables.
Methods and Findings
We genotyped three tagging SNPs (CRP + 2302G > A; CRP + 1444T > C; CRP + 4899T > G) in the CRP gene and measured serum CRP in 5,274 men and women at mean ages 49 and 61 y (Whitehall II Study). Homeostasis model assessment-insulin resistance (HOMA-IR) and hemoglobin A1c (HbA1c) were measured at age 61 y. Diabetes was ascertained by glucose tolerance test and self-report. Common major haplotypes were strongly associated with serum CRP levels, but unrelated to obesity, blood pressure, and socioeconomic position, which may confound the association between CRP and diabetes risk. Serum CRP was associated with these potential confounding factors. After adjustment for age and sex, baseline serum CRP was associated with incident diabetes (hazard ratio = 1.39 [95% confidence interval 1.29–1.51], HOMA-IR, and HbA1c, but the associations were considerably attenuated on adjustment for potential confounding factors. In contrast, CRP haplotypes were not associated with HOMA-IR or HbA1c (p = 0.52–0.92). The associations of CRP with HOMA-IR and HbA1c were all null when examined using instrumental variables analysis, with genetic variants as the instrument for serum CRP. Instrumental variables estimates differed from the directly observed associations (p = 0.007–0.11). Pooled analysis of CRP haplotypes and diabetes in Whitehall II and Northwick Park Heart Study II produced null findings (p = 0.25–0.88). Analyses based on the Wellcome Trust Case Control Consortium (1,923 diabetes cases, 2,932 controls) using three SNPs in tight linkage disequilibrium with our tagging SNPs also demonstrated null associations.
Conclusions
Observed associations between serum CRP and insulin resistance, glycemia, and diabetes are likely to be noncausal. Inflammation may play a causal role via upstream effectors rather than the downstream marker CRP.
Using a Mendelian randomization approach, Eric Brunner and colleagues show that the associations between serum C-reactive protein and insulin resistance, glycemia, and diabetes are likely to be noncausal.
Editors' Summary
Background.
Diabetes—a common, long-term (chronic) disease that causes heart, kidney, nerve, and eye problems and shortens life expectancy—is characterized by high levels of sugar (glucose) in the blood. In people without diabetes, blood sugar levels are controlled by the hormone insulin. Insulin is released by the pancreas after eating and “instructs” insulin-responsive muscle and fat cells to take up the glucose from the bloodstream that is produced by the digestion of food. In the early stages of type 2 diabetes (the commonest type of diabetes), the muscle and fat cells become nonresponsive to insulin (a condition called insulin resistance), and blood sugar levels increase. The pancreas responds by making more insulin—people with insulin resistance have high blood levels of both insulin and glucose. Eventually, however, the insulin-producing cells in the pancreas start to malfunction, insulin secretion decreases, and frank diabetes develops.
Why Was This Study Done?
Globally, about 200 million people have diabetes, but experts believe this number will double by 2030. Ways to prevent or delay the onset of diabetes are, therefore, urgently needed. One major risk factor for insulin resistance and diabetes is being overweight. According to one theory, increased body fat causes mild, chronic tissue inflammation, which leads to insulin resistance. Consistent with this idea, people with higher than normal amounts of the inflammatory protein C-reactive protein (CRP) in their blood have a high risk of developing diabetes. If inflammation does cause diabetes, then drugs that inhibit CRP might prevent diabetes. However, simply measuring CRP and determining whether the people with high levels develop diabetes cannot prove that CRP causes diabetes. Those people with high blood levels of CRP might have other unknown factors in common (confounding factors) that are the real causes of diabetes. In this study, the researchers use “Mendelian randomization” to examine whether increased blood CRP causes diabetes. Some variants of CRP (the gene that encodes CRP) increase the amount of CRP in the blood. Because these variants are inherited randomly, there is no likelihood of confounding factors, and an association between these variants and the development of insulin resistance and diabetes indicates, therefore, that increased CRP levels cause diabetes.
What Did the Researchers Do and Find?
The researchers measured blood CRP levels in more than 5,000 people enrolled in the Whitehall II study, which is investigating factors that affect disease development. They also used the “homeostasis model assessment-insulin resistance” (HOMA-IR) method to estimate insulin sensitivity from blood glucose and insulin measurements, and measured levels of hemoglobin A1c (HbA1c, hemoglobin with sugar attached—a measure of long-term blood sugar control) in these people. Finally, they looked at three “single polynucleotide polymorphisms” (SNPs, single nucleotide changes in a gene's DNA sequence; combinations of SNPs that are inherited as a block are called haplotypes) in CRP in each study participant. Common haplotypes of CRP were related to blood serum CRP levels and, as previously reported, increased blood CRP levels were associated with diabetes and with HOMA-IR and HbA1c values indicative of insulin resistance and poor blood sugar control, respectively. By contrast, CRP haplotypes were not related to HOMA-IR or HbA1c values. Similarly, pooled analysis of CRP haplotypes and diabetes in Whitehall II and another large study on health determinants (the Northwick Park Heart Study II) showed no association between CRP variants and diabetes risk. Finally, data from the Wellcome Trust Case Control Consortium also showed no association between CRP haplotypes and diabetes risk.
What Do These Findings Mean?
Together, these findings suggest that increased blood CRP levels are not responsible for the development of insulin resistance or diabetes, at least in European populations. It may be that there is a causal relationship between CRP levels and diabetes risk in other ethnic populations—further Mendelian randomization studies are needed to discover whether this is the case. For now, though, these findings suggest that drugs targeted against CRP are unlikely to prevent or delay the onset of diabetes. However, they do not discount the possibility that proteins involved earlier in the inflammatory process might cause diabetes and might thus represent good drug targets for diabetes prevention.
Additional Information.
Please access these Web sites via the online version of this summary at http://dx.doi.org/10.1371/journal.pmed.0050155.
This study is further discussed in a PLoS Medicine Perspective by Bernard Keavney
The MedlinePlus encyclopedia provides information about diabetes and about C-reactive protein (in English and Spanish)
US National Institute of Diabetes and Digestive and Kidney Diseases provides patient information on all aspects of diabetes, including information on insulin resistance (in English and Spanish)
The International Diabetes Federation provides information about diabetes, including information on the global diabetes epidemic
The US Centers for Disease Control and Prevention provides information for the public and professionals on all aspects of diabetes (in English and Spanish)
Wikipedia has a page on Mendelian randomization (note: Wikipedia is a free online encyclopedia that anyone can edit; available in several languages)
Introduction
C-reactive protein (CRP) is a nonspecific marker of systemic inflammation that predicts incident type 2 diabetes. Chronic low-grade inflammation may induce insulin resistance and is a candidate pathway leading from obesity to diabetes [1–3]. Several population-based observational studies suggest an independent role for CRP in the development of insulin resistance and diabetes, but it is unclear whether this association is a causal one or the consequence of imperfect adjustment for adiposity and other confounding factors [4–10]. Preventing or delaying onset of diabetes and its complications is an important therapeutic aim, and there is interest in inflammatory effectors including CRP as drug targets [11,12]. It is therefore highly desirable to establish which mediators in the inflammatory cascade are causal for diabetes.
Mendelian randomization involves comparison of phenotype and genotype effects in observational studies [13]. If the association between a modifiable risk factor and disease is causal, the genetic variant associated with this risk factor should be related to the disease outcome to the extent predicted by the magnitude of its association with the risk factor. The approach is based on two concepts. First, random allocation of parental alleles leads to lifetime exposure to differing levels of the risk factor, in the present case CRP haplotype and heritable CRP level [14,15]. Second, the genetically influenced component of variation in the risk factor will generally be unaffected by confounding and reverse causation, in contrast to the variation associated with environmental influences [13,16,17].
We are aware of one previous study of CRP and diabetes employing the Mendelian randomization technique in a European population [4]. It found that a rare haplotype was associated with a modest increase in risk of diabetes but did not employ instrumental variables analysis to show that the effect of circulating CRP on diabetes risk was unconfounded. Confounding was demonstrated in a study of CRP and metabolic syndrome variables [18]. The present study examines the causal nature of the relation between serum CRP and development of diabetes risk using Mendelian randomization. We measured homeostasis model assessment-insulin resistance (HOMA-IR) [19] and hemoglobin A1c (HbA1c) as an index of glycemic control, as well as determining diabetes caseness, in the Whitehall II Study. The continuous traits provide adequate statistical power for an instrumental analysis of the unconfounded and unbiased (by reverse causation and regression dilution bias) effects of CRP on HbA1c and HOMA-IR. Three tagging SNPs in the CRP gene allowed construction of haplotypes that were used as instrumental variables. We carried out a pooled analysis in relation to diabetes caseness as the same haplotypes were available in the prospective Northwick Park Heart Study II (NPHSII). Data from the Wellcome Trust Case Control Consortium (WTCCC) further allowed us to analyze three SNPs in tight long-range linkage disequilibrium (LD) with our tagging SNPs among 1,923 diabetes cases and 2,932 controls.
Methods
Index Study: Whitehall II Study
In 1985–1988, all nonindustrial civil servants aged between 35 and 55 y, in 20 departments in central London were invited to a medical examination at their workplace [20,21]. With 73% participation, the cohort included 10,308 participants at study entry. Of these individuals, 6,156 participated in screening in 2003–2004 (study phase 7) and were genotyped for variants in the CRP gene. Excluding non-Europeans, those with missing phase 7 CRP, neither HOMA-IR nor HbA1c concentration, missing CRP SNPs, or with unreliable haplotypes, the final sample included 5,274 (3,849 men, 1,425 women) participants aged 50 to 74 y (mean 61 y), all of whom signed an informed consent. CRP measurements at mean age 49 y were available for 4,674 (3,433 men, 1,241 women).
Measurements.
Age, sex, body mass index (BMI), waist circumference, blood pressure, smoking, physical activity, socioeconomic position, coronary heart disease, and diabetes status were measured at mean ages 49 and 61 y. Weight was measured in underwear to the nearest 0.1 kg on Soehnle electronic scales. Height was measured in bare feet to the nearest 1 mm using a stadiometer with the participant standing erect with head in the Frankfurt plane. Waist circumference, taken as the smallest circumference at or below the costal margin, was measured with participants unclothed in the standing position utilizing a fiberglass tape measure at 600 g tension. Venous blood was taken in the fasting state or at least 5 h after a light, fat-free breakfast, before undergoing a 2-h 75-g oral glucose tolerance test [22]. Serum triglycerides were measured by automated enyzmic colorimetric methods. HDL cholesterol was measured using phosphotungstate precipitation. Glucose was measured in fluoride plasma by an electrochemical glucose oxidase method. Insulin was measured by radioimmunoassay using polyclonal guinea pig antiserum at age 49 y and by double antibody ELISA at age 61 y.
C-reactive protein genotyping.
DNA was extracted from blood samples using magnetic bead technology (Geneservice). Using validated genotype data (minor allele frequency >5%) from participants of European descent from the National Heart Lung and Blood Institute (NHLBI) Programs for Genomic Applications (PGA) database (http://pga.mbt.washington.edu/), and HapMap (http://www.hapmap.org/), we examined the pattern of LD across the CRP gene. We used the haplotype LD r2 method to select a set of tagging (t) SNPs capable of capturing maximum haplotype diversity using TagIT (http://popgen.biol.ucl.ac.uk/software.html). We genotyped three SNPs in the CRP gene (+1444T > C [rs1130864]; +2302G > A [rs1205]; and +4899T > G [rs 3093077]) using the ABI Prism 7900HT Sequence Detection System for both PCR and allelic discrimination (Applied Biosystems) under standard conditions. CRP +2303 and +4899 were found to be in Hardy Weinberg Equilibrium (HWE) (chisq p > 0.05), however +1444 was not in HWE (p = 0.003). Blind re-genotyping of the +1444 SNP (n = 678) in a different laboratory produced a mismatch rate of 0.5% suggesting that genotyping errors were not responsible. A repeated blood sample from 553 participants showed the genotyping error rate was <1% for each SNP.
C-reactive protein.
CRP was measured in serum stored at −80 °C using a high-sensitivity immunonephelometric assay in a BN ProSpec nephelometer (Dade Behring). Values below the detection limit (0.154 mg/l) were assigned a value of 0.077 mg/l (333 [7.1%] at age 49 y, 104 [2.0%] at age 61 y). Samples from both study phases were analyzed at the same time. Intra- and interassay coefficients of variation were 4.7% and 8.3%. To measure short-term biological variation and laboratory error, a repeated sample was taken from a subset of 150 participants at mean age 49 y and 533 participants at mean age 61 y (average time between samples 32 and 24 d, respectively). Reliability between samples was assessed with intraclass correlation: r = 0.83 at mean age 49 y, and r = 0.57 at mean age 61 y.
Diabetes.
Diabetes status was determined at mean ages 49, 56, and 61 y on the basis of self-report of doctor diagnosis, use of diabetes medication or 75 g OGTT. Diabetes was defined by 2-h glucose ≥ 11.1 mmol/l or fasting glucose ≥ 7 mmol/l [23].
HbA1c and HOMA-IR.
HbA1c was measured in EDTA whole blood on a calibrated HPLC system with automated hemolysis prior to injection. HbA1 is resolved as a separate peak, which does not interfere with HbA1c quantitation. HOMA-IR was calculated as (fasting glucose [mmol/l] × fasting insulin [mU/l]/22.5) [19]. Nonfasting participants were assigned a missing value (n = 435, 9.1%).
Data Analysis
Standard regression analysis.
We used age- and sex-adjusted least square regression analysis to assess (1) the association of haplotypes (see below) with circulating CRP levels at baseline and follow-up, and with potential confounding factors; (2) the associations of potential confounding factors with circulating CRP levels and with HbA1c and HOMA-IR at follow-up; and (3) the association between circulating CRP levels with HbA1c and HOMA-IR in a multivariable model. The haplotype-confounder associations were computed to test our underlying hypothesis that genetic variants in CRP would not be associated with confounding factors that effect conventional epidemiological associations. We used Cox regression to assess associations between CRP levels at baseline and incident diabetes, and logistic regression analysis to assess associations between haplotype and prevalent diabetes with a binary indicator for study (Whitehall II or NPHSII) in the pooled analysis.
Haplotype construction.
We constructed haplotypes with the genetic data analysis program SIMHAP (see http://www.genepi.com/au/project/simhap, obtained May 2, 2007), using 1,000 iterations and a posterior probability ≥ 0.95. Four haplotypes of SNPs +1444, +2302, and +4899 (CAT, CGG, CGT, and TGT) remained in the analysis in which genetic variants were used to determine the association of CRP with diabetes, HbA1c, and HOMA-IR.
Instrumental variables analysis.
An instrumental variables analysis, in which CRP haplotypes were used as instrumental variables for the unconfounded and unbiased effect of CRP on HbA1c, was undertaken using two-stage least squares method. In these analyses we use a model for the haplotype-CRP association that assumes each of a participant's two haplotypes contributes additively to his/her value of CRP, as in a previous study [18]. We compared results from the instrumental variable estimates of the association of CRP with HbA1c to those from ordinary linear regression using the Durbin form of the Durbin-Wu-Hausman statistic. We used the F-statistics from the first-stage regressions to evaluate the strength of the instruments (F > 10 indicates sufficient strength to ensure the validity of instrumental variable methods) [24].
General analytic procedures.
There was no statistical evidence that the associations we examined differed by sex, although previous studies have been inconsistent in this respect [25–27]. Because of skewness, we logarithmically transformed CRP in the analyses, using log base 2 so that we could present associations per doubling of CRP [17,18,28], and transformed HbA1c and HOMA-IR to the natural logarithm. We excluded observations with serum CRP > 10 mg/l, indicating an acute phase reaction, in analyses with serum CRP (n = 80 at age 49 y, n = 182 at age 61 y). Analyses were performed with Stata 8.2 or 9.2 (Stata Institute).
Replication Studies
We replicated our analysis in two independent samples: NPHSII and WTCCC [29,30]. The three tagging SNPs utilized here were typed in NPHSII (2,173 men, mean age 56 y), and cases of diabetes (n = 174) were identified to the end of 2005 by searching medical records for physician diagnosis and treatment [29]. Within the WTCCC sample, none of the SNPs that we have used here were available [31]. However, three alternative SNPs, identified using Ensembl (http://www.ensembl.org/index.html), were included on the Affymetrix 500K array and are in long-range LD with our tagging SNPs, as follows: rs12760041 with rs1130864 (r2 = 0.84), rs2592889 with rs1205 (r2 = 0.75), and rs11265260 with rs3093077 (r2 = 1.00). An analysis based on 1,923 cases of diabetes and 2,932 controls was used to examine genotype-diabetes associations. Each genotype was found to be in Hardy Weinberg Equilibrium with the exception of rs2592889 among cases (p = 0.003).
Results
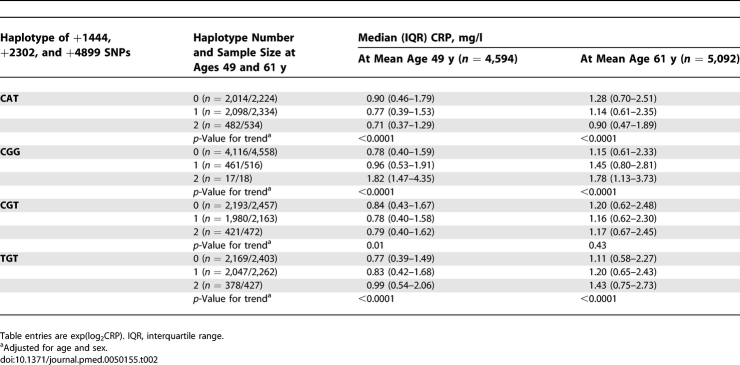
Participants were on average 60.9 y of age, the majority was men and from executive officer and senior administrative employment grades (Table 1). There were 354 (6.7%) cases of diabetes at follow-up. As expected, haplotypes were associated with circulating CRP levels (Table 2) but not with risk factors at baseline or follow-up (all p ≥ 0.07) except in one case at baseline: CGG-occupational status (p = 0.038). In contrast, all risk factors were associated with serum CRP, HbA1c, and HOMA-IR except physical activity level (CRP only) (Table 3).
Table 1.
Participant Characteristics
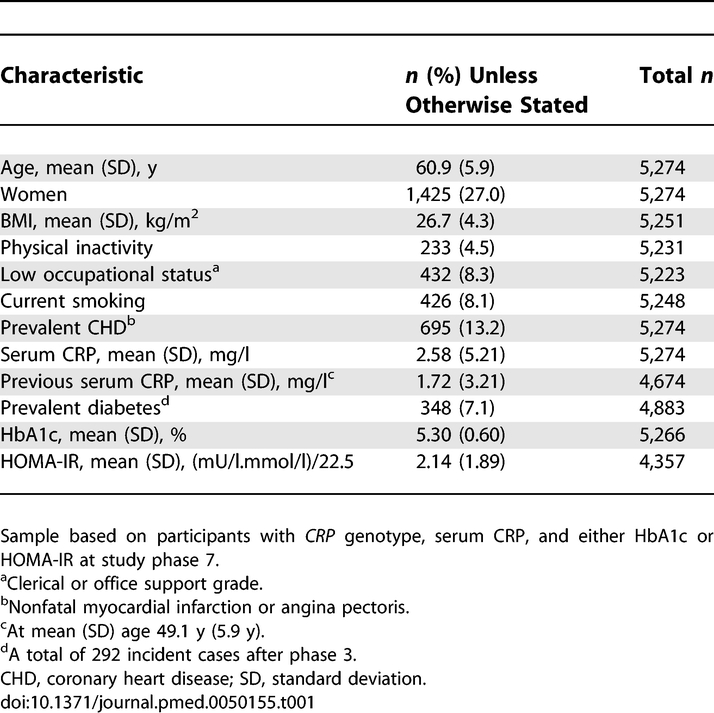
Table 2.
Association between CRP Haplotypes and Serum CRP Concentration
Table 3.
Contemporaneous Associations of Risk Factors for Diabetes with Serum CRP Concentration, HbA1c, and HOMA-IR at Mean Age 61 y (Adjusted for Age and Sex)
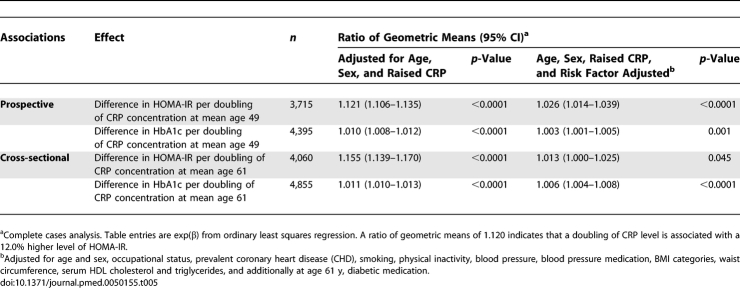
Baseline serum CRP was a strong predictor of incident diabetes after adjustment for age and sex (hazard ratio [HR] for doubling of CRP 1.39 (95% confidence interval [CI] 1.29–1.51) (Table 4). Controlling for general and central obesity attenuated the CRP effect considerably, and after extensive adjustment the HR was reduced by 51%. After adjustment for age and sex, higher contemporaneous and previous serum CRP concentrations were associated with increased HOMA-IR and HbA1c (Table 5). Further adjustment for risk factors greatly attenuated these associations.
Table 4.
Relation between Serum CRP at Mean Age 49 y and Incident Type 2 Diabetes among Participants of European Origin during 13.1 y Follow-up
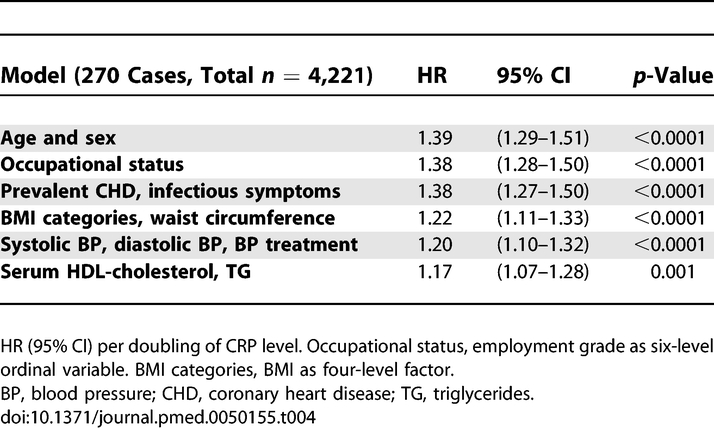
Table 5.
Prospective and Cross-Sectional Associations of Serum CRP with HbA1c and HOMA-IR
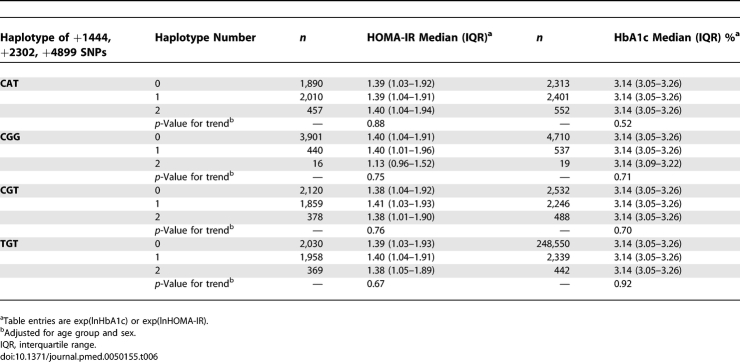
Median levels of HbA1c and HOMA-IR did not vary by CRP haplotypes, suggesting that these haplotypes have no effect on diabetes risk (Table 6), although they are consistently associated with serum CRP concentrations.
Table 6.
Relation between CRP Haplotypes, HOMA-IR, and HbA1c at Mean Age 61 y among Participants of European Origin
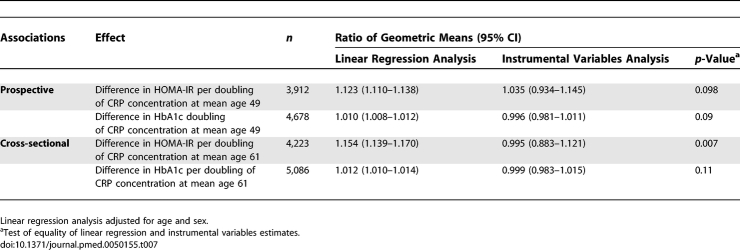
F-statistics from the first-stage regressions in the instrumental variable models were greater than 10 (HbA1c, 18.3 for contemporaneous and 17.0 for previous serum CRP; HOMA-IR, 15.3 and 15.8, respectively) indicating sufficient strength to ensure validity of instrumental variable methods in these data. Table 7 compares the magnitudes of association of CRP with HbA1c and HOMA-IR obtained from the age- and sex-adjusted ordinary least squares regression analysis and the unadjusted instrumental variables analysis. While the ordinary least squares regression analysis indicated positive associations of CRP levels with HbA1c and HOMA-IR (p < 0.0001), the instrumental variables analysis consistently suggested no such association (p > 0.60), though this was imprecisely estimated. The Durbin-Wu-Hausman test for difference between the linear regression and instrumental variables estimates approached significance in three of four comparisons and highly significant for contemporaneous serum CRP with HOMA-IR as outcome. Coefficients from the confounder-adjusted linear regressions were similar to those from the instrumental variables analyses, suggesting no causal CRP effect.
Table 7.
Comparison of Cross-Sectional and Prospective Associations between CRP and HbA1c Concentration Estimated by Linear Regression and with Instrumental Variables (with CRP Haplotypes as Instruments)
NPHSII
Haplotype-serum CRP associations were similar to those observed in Whitehall II (Table S1). None of the four haplotypes was associated with potential confounding variables age, BMI, systolic BP, serum triglycerides, and cholesterol (Table S2). Serum CRP was a risk factor for incident diabetes (age adjusted HR for doubling of CRP 1.27 [95% CI 1.11–1.44]). The effect was attenuated after controlling for the risk factors above (HR = 1.08 [0.93–1.24]).
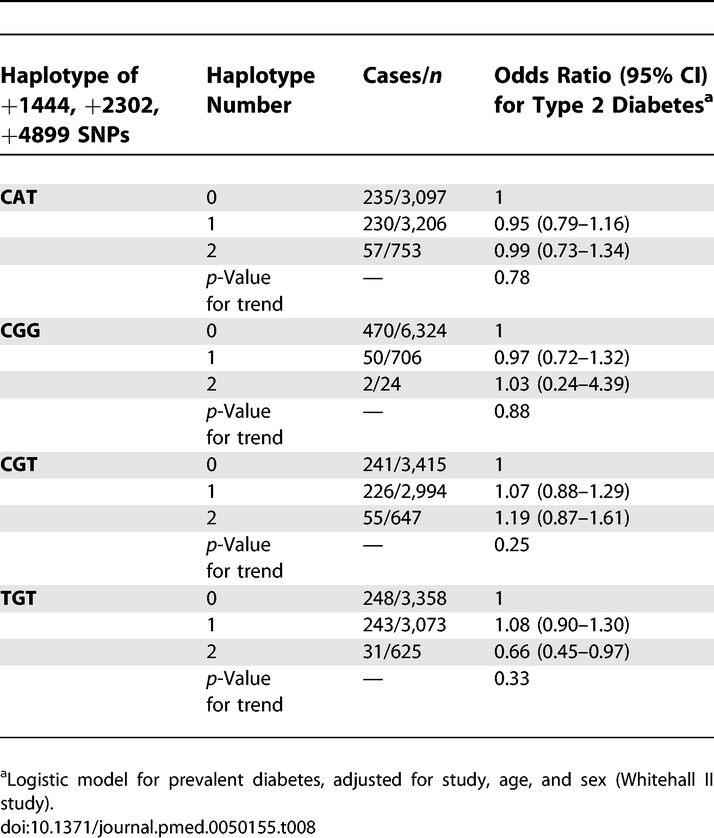
Pooled analysis of CRP haplotypes and prevalent cases of diabetes (n = 522) in Whitehall II and NPHSII produced null findings (Table 8). Among TGT homozygotes the reduced risk of diabetes is counterfactual given the direct association between TGT haplotype number and serum CRP (Table 2).
Table 8.
Pooled Analysis of Association between CRP Haplotypes and Type 2 Diabetes in Whitehall II and NPHSII
WTCCC Sample
Case-control analysis of diabetes and the three SNPs in long-range LD with the SNPs of interest produced no evidence of association. Odds ratios (95% CI) were 0.98 (0.92–1.04) for rs12760041, 1.04 (0.98–1.12) for rs2592889, and 0.91 (0.81–1.03) for rs11265260.
Discussion
This large study provides evidence that systemic CRP levels are not responsible for development of insulin resistance, hyperglycemia, or diabetes. The finding does not preclude the possibility that inflammatory signals contribute to causal processes leading to diabetes. We obtained a clear signal, using Mendelian randomization, that the association between systemic CRP and diabetes risk is not causal. However, the nature of the prospective relation between serum CRP and diabetes risk points to the potential effects of more proximal mediators in the inflammatory cascade.
Our underlying assumption was confirmed that genetic variants in CRP would not be associated with socioeconomic, lifestyle, and biological confounding factors, enabling us to estimate the unconfounded effect of CRP on HbA1c and HOMA-IR by means of the variation in systemic CRP due to four CRP haplotypes. No such effect was detected.
In addition to the analysis of Whitehall II data, further support for our conclusion concerning CRP and diabetes is provided by NPHSII and WTCCC. NPHSII haplotype and disease caseness data allowed a pooled haplotype-diabetes analysis with Whitehall II, which confirmed our null findings. Among almost 2,000 cases of diabetes and 3,000 controls in the WTCCC sample, we were able to identify three SNPs distant from the CRP locus but in tight LD with the SNPs we typed. None of these was associated with diabetes caseness.
Several issues may compromise the value of Mendelian randomization approach in assessing causality [13]. First, common genetic variants determining significant proportions of variance in the exposure of interest are needed. For the CRP haplotypes in question, this is the case here and in other independent studies [15,18,32–38]. Second, the association of the genotype (instrumental variable) with phenotype has to be strong enough for the instrumental variables analysis to be consistent. The F-statistic was clearly above the threshold of 10 used to identify the problem of a weak instrument [24], although a larger study would yield greater precision in the estimates from instrumental variables analysis. Third, the Mendelian randomization approach may be open to confounding if the genetic variants used as instruments have multiple effects on phenotype (pleiotropy) or if the variant is in LD with another genetic variant that differently influences the pathway of interest. With respect to the null associations observed in our study we think pleiotropy is unlikely. The variants that we used to generate the CRP haplotypes used here as instrumental variables are in very close LD with variation within a transcription factor binding site located 5′ of the CRP gene, which is associated with circulating concentrations of CRP and thought to be functional [39,40]. It is unlikely that the variation in circulating CRP associated with this marker (or those, like our haplotypes, in LD with it) is substantially involved in other phenotypes affecting inflammatory processes because of their role as a transcription factor binding site. Fourth, developmental compensation, or canalization, during fetal development may provide resistance to the influence of a genetic variant through permanent changes in cellular function that counterbalance the genetic effect. Such mechanisms are a potential source of bias in all Mendelian randomization studies. Despite this potential bias, the method has confirmed established associations such as that of LDL cholesterol with cardiovascular disease risk [41].
Our findings are consistent with a previous study that examined HOMA-IR as an outcome [18]. To our knowledge two previous studies have examined the association of variation in the CRP gene in relation to the binary outcome of type 2 diabetes [4,42]. We find that the rare CGG haplotype is associated with serum CRP level, but we do not replicate the modest link with diabetes observed in the Rotterdam study [4]. Among Pima Indians (a population with very high levels of risk for type 2 diabetes) the rs133552 SNP, in the promoter region of CRP, was associated with diabetes risk [42]. The CRP haplotypes used in the present study index the rare allele of rs133552, thus it is unlikely that our null finding is due to unmeasured genetic variation. The consistent lack of association in our primary study, our two replication samples including the large WTCCC, and a large case-control study of Finnish participants [43], provides compelling evidence that CRP is not related to diabetes in European populations. Further replication of the genetic association in the Pima Indian population would shed light on this putative ethnic difference.
If glucose intolerance and insulin resistance have inflammatory causes, mediators should be sought among cytokines more proximal than CRP to the start of the inflammatory cascade. Gene expression of CRP occurs mainly in hepatocytes, regulated by interleukin (IL)-6 originating from adipocytes and immune tissue. This cytokine and tumor necrosis factor (TNF)-α are candidate mediators for the proposed inflammatory link between increased body fat and induction of insulin resistance locally in adipocytes and in distant tissues [1,44,45]. Other inflammatory mechanisms, such as complement pathways, may also be important [46].
Rodent models of obesity provide evidence that adipose expression of TNF-α is associated, reversibly, with insulin resistance and reduced glucose uptake and fatty acid oxidation [3,47].
In humans, SNPs in TNF have been linked with diabetes, obesity, and obesity phenotypes [43,48]. However, a short-term trial of the anti-TNF-α drug etanercept in individuals with the metabolic syndrome, did not increase insulin sensitivity despite a decrease in CRP levels [49]. With respect to IL6, there is evidence for associations of gene variants with diabetes [43,50], insulin sensitivity [51], and metabolic syndrome [52]. Whether obesity leads to insulin resistance primarily as a result of chronic low grade inflammation or metabolic alterations remains an important question.
Supporting Information
(40 KB DOC)
(54 KB DOC).
Acknowledgments
Whitehall II study: We thank all participating civil service departments and their welfare, personnel, and establishment officers; the Occupational Health and Safety Agency; the Council of Civil Service Unions; all participating civil servants in the Whitehall II study; and all members of the Whitehall II study team.
WTCCC: A full list of investigators who contributed to the generation of the data is available at http://www.wtccc.org.uk.
Abbreviations
- BMI
body mass index
- CI
confidence interval
- CRP
C-reactive protein
- HbA1c
hemoglobin A1c
- HOMA-IR
homeostasis model assessment-insulin resistance
- HR
hazard ratio
- LD
linkage disequilibrium
- NPHSII
Northwick Park Heart Study II
- TNF
tumor necrosis factor
- WTCCC
Wellcome Trust Case Control Consortium
Footnotes
Author contributions. EJB, M. Kivimäki, DAL, MM, SEH, ADH, and M. Kumari designed the study. EJB, JAC, and MM analyzed the data. MM, GDOL, AR, TS, MGM, and M. Kumari collected data or did experiments for the study. EJB and M Kivimäki wrote the first draft of the paper. EJB, M. Kivimäki, DRW, DAL, GDS, JAC, MM, GDOL, AR, JPC, ADH, MGM, NJT, and M. Kumari contributed to writing the paper. M. Kivimäki helped in conducting the data analysis and interpretation. DRW contributed to the analysis of the data. MM supervised (scientific and administrative roles) the DNA extraction program and genotyping and was responsible for checking genotype results and in particular for verifying concordance of blind duplicates, establishing error rates, etc. GDOL supervised laboratory assays. TS selected CRP tag SNPs and conducted genotyping of these SNPs. NJT helped with analysis.
Funding: The Whitehall II study has been supported by grants from UK Medical Research Council (MRC), British Heart Foundation, Health and Safety Executive, Department of Health, National Heart Lung and Blood Institute (HL36310), National Institute on Aging (AG13196), Agency for Health Care Policy Research (HS06516), and MacArthur Foundation Research Network on Socio-economic Status and Health. MGM is supported by an MRC Research Professorship. MGM and EJB are supported by the British Heart Foundation (BHF). Northwick Park Heart Study II (NPHSII) was supported by the UK Medical Research Council, the US National Institute of Health (grant NHLBI 33014), and Du Pont Pharma. TS was funded by a BHF PhD Studentship, and ADH by a BHF Senior Fellowship (FS/05/125). ADH acknowledges the generous support from the Rosetrees Trust. JAC and SEH are supported by the BHF (PG2005/014). Funding for the Wellcome Trust Case Control Consortium (WTCCC) project was provided by the Wellcome Trust under award 076113. No funding source had influence over the study design, data collection and analysis, decision to publish, or preparation of the manuscript.
Competing Interests: The authors have declared that no competing interests exist.
References
- Shoelson SE, Herrero L, Naaz A. Obesity, inflammation, and insulin resistance. Gastroenter. 2007;132:2169–2180. doi: 10.1053/j.gastro.2007.03.059. [DOI] [PubMed] [Google Scholar]
- Kim F, Pham M, Luttrell I, Bannerman DD, Tupper J, et al. Toll-like receptor-4 mediates vascular inflammation and insulin resistance in diet-induced obesity. Circ Res. 2007;100:1589–1596. doi: 10.1161/CIRCRESAHA.106.142851. [DOI] [PubMed] [Google Scholar]
- Hotamisligil GS. Inflammation and metabolic disorders. Nature. 2006;444:860–867. doi: 10.1038/nature05485. [DOI] [PubMed] [Google Scholar]
- Dehghan A, Kardys I, de Maat MP, Uitterlinden AG, Sijbrands EJ, et al. Genetic variation, C-reactive protein levels, and incidence of diabetes. Diabetes. 2007;56:872–878. doi: 10.2337/db06-0922. [DOI] [PubMed] [Google Scholar]
- Barzilay JI, Abraham L, Heckbert SR, Cushman M, Kuller LH, et al. The relation of markers of inflammation to the development of glucose disorders in the elderly. Diabetes. 2001;50:2384–2389. doi: 10.2337/diabetes.50.10.2384. [DOI] [PubMed] [Google Scholar]
- Freeman DJ, Norrie J, Caslake MJ, Gaw A, Ford I, et al. C-reactive protein is an independent predictor of risk for the development of diabetes in the West of Scotland Coronary Prevention Study. Diabetes. 2002;51:1596–1600. doi: 10.2337/diabetes.51.5.1596. [DOI] [PubMed] [Google Scholar]
- Pradhan AD, Cook NR, Buring JE, Manson JE, Ridker PM. C-reactive protein is independently associated with fasting insulin in nondiabetic women. Arterioscler Thromb Vasc Biol. 2003;23:650–655. doi: 10.1161/01.ATV.0000065636.15310.9C. [DOI] [PubMed] [Google Scholar]
- Hu FB, Meigs JB, Li TY, Rifai N, Manson JE. Inflammatory markers and risk of developing type 2 diabetes in women. Diabetes. 2004;53:693–700. doi: 10.2337/diabetes.53.3.693. [DOI] [PubMed] [Google Scholar]
- Thorand B, Lowel H, Schneider A, Kolb H, Meisinger C, et al. C-reactive protein as a predictor for incident diabetes mellitus among middle-aged men: results from the MONICA Augsburg cohort study, 1984–1998. Arch Intern Med. 2003;163:93–99. doi: 10.1001/archinte.163.1.93. [DOI] [PubMed] [Google Scholar]
- Laaksonen DE, Niskanen L, Nyyssonen K, Punnonen K, Tuomainen TP, et al. C-reactive protein and the development of the metabolic syndrome and diabetes in middle-aged men. Diabetologia. 2004;47:1403–1410. doi: 10.1007/s00125-004-1472-x. [DOI] [PubMed] [Google Scholar]
- Pepys MB, Hirschfield GM, Tennent GA, Gallimore JR, Kahan MC, et al. Targeting C-reactive protein for the treatment of cardiovascular disease. Nature. 2006;440:1217–1221. doi: 10.1038/nature04672. [DOI] [PubMed] [Google Scholar]
- Samaha FF, Szapary PO, Iqbal N, Williams MM, Bloedon LT, et al. Effects of rosiglitazone on lipids, adipokines, and inflammatory markers in nondiabetic patients with low high-density lipoprotein cholesterol and metabolic syndrome. Arterioscler Thromb Vasc Biol. 2006;26:624–630. doi: 10.1161/01.ATV.0000200136.56716.30. [DOI] [PubMed] [Google Scholar]
- Davey Smith G, Ebrahim S. What can mendelian randomisation tell us about modifiable behavioural and environmental exposures. Br Med J. 2005;330:1076–1079. doi: 10.1136/bmj.330.7499.1076. [DOI] [PMC free article] [PubMed] [Google Scholar]
- Pankow JS, Folsom AR, Cushman M, Borecki IB, Hopkins PN, et al. Familial and genetic determinants of systemic markers of inflammation: the NHLBI family heart study. Atherosclerosis. 2001;154:681–689. doi: 10.1016/s0021-9150(00)00586-4. [DOI] [PubMed] [Google Scholar]
- Carlson CS, Aldred SF, Lee PK, Tracy RP, Schwartz SM, et al. Polymorphisms within the C-reactive protein (CRP) promoter region are associated with plasma CRP levels. Am J Hum Genet. 2005;77:64–77. doi: 10.1086/431366. [DOI] [PMC free article] [PubMed] [Google Scholar]
- Hingorani AD, Shah T, Casas JP. Linking observational and genetic approaches to determine the role of C-reactive protein in heart disease risk. Eur Heart J. 2006;27:1261–1263. doi: 10.1093/eurheartj/ehi852. [DOI] [PubMed] [Google Scholar]
- Casas JP, Shah T, Cooper J, Hawe E, McMahon AD, et al. Insight into the nature of the CRP-coronary event association using Mendelian randomization. Int J Epidemiol. 2006;35:922–931. doi: 10.1093/ije/dyl041. [DOI] [PubMed] [Google Scholar]
- Timpson NJ, Lawlor DA, Harbord RM, Gaunt TR, Day IN, et al. C-reactive protein and its role in metabolic syndrome: mendelian randomisation study. Lancet. 2005;366:1954–1959. doi: 10.1016/S0140-6736(05)67786-0. [DOI] [PubMed] [Google Scholar]
- Matthews DR, Hosker JP, Rudenski AS, Naylor BA, Treacher DF, et al. Homeostasis model assessment: insulin resistance and B-cell function from fasting plasma glucose and insulin concentrations in man. Diabetologia. 1985;28:412–419. doi: 10.1007/BF00280883. [DOI] [PubMed] [Google Scholar]
- Marmot MG, Davey Smith G, Stansfeld SA, Patel C, North F, et al. Health inequalities among British Civil Servants: the Whitehall II study. Lancet. 1991;337:1387–1393. doi: 10.1016/0140-6736(91)93068-k. [DOI] [PubMed] [Google Scholar]
- Marmot MG, Brunner EJ. Cohort profile: the Whitehall II study. Int J Epidemiol. 2005;34:251–256. doi: 10.1093/ije/dyh372. [DOI] [PubMed] [Google Scholar]
- Brunner EJ, Marmot MG, Nanchahal K, Shipley MJ, Stansfeld SA, et al. Social inequality in coronary risk: central obesity and the metabolic syndrome. Evidence from the Whitehall II study. Diabetologia. 1997;40:1341–1349. doi: 10.1007/s001250050830. [DOI] [PubMed] [Google Scholar]
- World Health Organiztion (WHO) Definition, diagnosis and classification of diabetes mellitus and its complications. Geneva: WHO; 1999. [Google Scholar]
- Staiger D, Stock JH. Instrumental variables regression with weak instruments. Econometrica. 1997;65:557–586. [Google Scholar]
- Han TS, Sattar N, Williams K, Gonzalez-Villalpando C, Lean ME, et al. Prospective study of C-reactive protein in relation to the development of diabetes and metabolic syndrome in the Mexico City Diabetes Study. Diabetes Care. 2002;25:2016–2021. doi: 10.2337/diacare.25.11.2016. [DOI] [PubMed] [Google Scholar]
- Snijder MB, Dekker JM, Visser M, Stehouwer CD, Yudkin JS, et al. Prospective relation of C-reactive protein with type 2 diabetes: response to Han et al. Diabetes Care. 2003;26:1656–1657. doi: 10.2337/diacare.26.5.1656. [DOI] [PubMed] [Google Scholar]
- Thorand B, Baumert J, Kolb H, Meisinger C, Chambless L, et al. Sex differences in the prediction of type 2 diabetes by inflammatory markers: results from the MONICA/KORA Augsburg case-cohort study, 1984–2002. Diabetes Care. 2007;30:854–860. doi: 10.2337/dc06-1693. [DOI] [PubMed] [Google Scholar]
- Kivimaki M, Lawlor DA, Eklund C, Smith GD, Hurme M, et al. Mendelian randomization suggests no causal association between C-reactive protein and carotid intima-media thickness in the young Finns study. Arterioscler Thromb Vasc Biol. 2007;27:978–979. doi: 10.1161/01.ATV.0000258869.48076.14. [DOI] [PubMed] [Google Scholar]
- Gable DR, Stephens JW, Cooper JA, Miller GJ, Humphries SE. Variation in the UCP2-UCP3 gene cluster predicts the development of type 2 diabetes in healthy middle-aged men. Diabetes. 2006;55:1504–1511. doi: 10.2337/db05-1645. [DOI] [PubMed] [Google Scholar]
- Wellcome Trust Case Control Consortium. Genome-wide association study of 14,000 cases of seven common diseases and 3,000 shared controls. Nature. 2007;447:661–678. doi: 10.1038/nature05911. [DOI] [PMC free article] [PubMed] [Google Scholar]
- Zeggini E, Weedon MN, Lindgren CM, Frayling TM, Elliott KS, et al. Replication of genome-wide association signals in UK samples reveals risk loci for type 2 diabetes. Science. 2007;316:1336–1341. doi: 10.1126/science.1142364. [DOI] [PMC free article] [PubMed] [Google Scholar]
- Kivimaki M, Lawlor DA, Davey Smith G, Eklund C, Hurme M, et al. Variants in the CRP gene as a measure of life-long differences in average C-reactive protein levels: the Cardiovascular Risk in Young Finns Study. Am J Epidemiol. 2007;166:760–764. doi: 10.1093/aje/kwm151. [DOI] [PubMed] [Google Scholar]
- Zee RY, Ridker PM. Polymorphism in the human C-reactive protein (CRP) gene, plasma concentrations of CRP, and the risk of future arterial thrombosis. Atherosclerosis. 2002;162:217–219. doi: 10.1016/s0021-9150(01)00703-1. [DOI] [PubMed] [Google Scholar]
- Brull DJ, Serrano N, Zito F, Jones L, Montgomery HE, et al. Human CRP gene polymorphism influences CRP levels: implications for the prediction and pathogenesis of coronary heart disease. Arterioscler Thromb Vasc Biol. 2003;23:2063–2069. doi: 10.1161/01.ATV.0000084640.21712.9C. [DOI] [PubMed] [Google Scholar]
- Russell AI, Cunninghame Graham DS, Shepherd C, Roberton CA, Whittaker J, et al. Polymorphism at the C-reactive protein locus influences gene expression and predisposes to systemic lupus erythematosus. Hum Mol Genet. 2004;13:137–147. doi: 10.1093/hmg/ddh021. [DOI] [PMC free article] [PubMed] [Google Scholar]
- Kovacs A, Green F, Hansson LO, Lundman P, Samnegard A, et al. A novel common single nucleotide polymorphism in the promoter region of the C-reactive protein gene associated with the plasma concentration of C-reactive protein. Atherosclerosis. 2005;178:193–198. doi: 10.1016/j.atherosclerosis.2004.08.018. [DOI] [PubMed] [Google Scholar]
- Suk HJ, Ridker PM, Cook NR, Zee RY. Relation of polymorphism within the C-reactive protein gene and plasma CRP levels. Atherosclerosis. 2005;178:139–145. doi: 10.1016/j.atherosclerosis.2004.07.033. [DOI] [PubMed] [Google Scholar]
- Kathiresan S, Larson MG, Vasan RS, Guo CY, Gona P, et al. Contribution of clinical correlates and 13 C-reactive protein gene polymorphisms to interindividual variability in serum C-reactive protein level. Circulation. 2006;113:1415–1423. doi: 10.1161/CIRCULATIONAHA.105.591271. [DOI] [PubMed] [Google Scholar]
- Szalai AJ, Alarcon GS, Calvo-Alen J, Toloza SM, McCrory MA, et al. Systemic lupus erythematosus in a multiethnic US Cohort (LUMINA). XXX: association between C-reactive protein (CRP) gene polymorphisms and vascular events. Rheumatology (Oxford) 2005;44:864–868. doi: 10.1093/rheumatology/keh613. [DOI] [PubMed] [Google Scholar]
- Timpson NJ, Smith GD, Ebrahim S. Letter by Timpson et al regarding article, “Contribution of clinical correlates and 13 C-reactive protein gene polymorphisms to interindividual variability in serum C-reactive protein level”. Circulation. 2006;114:e256. doi: 10.1161/CIRCULATIONAHA.106.638387. [DOI] [PubMed] [Google Scholar]
- Cohen JC, Boerwinkle E, Mosley TH, Jr., Hobbs HH. Sequence variations in PCSK9, low LDL, and protection against coronary heart disease. N Engl J Med. 2006;354:1264–1272. doi: 10.1056/NEJMoa054013. [DOI] [PubMed] [Google Scholar]
- Wolford JK, Gruber JD, Ossowski VM, Vozarova B, Tataranni PA, et al. A C-reactive protein promoter polymorphism is associated with type 2 diabetes mellitus in Pima Indians. Mol Genet Metab. 2003;78:136–144. doi: 10.1016/s1096-7192(02)00230-5. [DOI] [PubMed] [Google Scholar]
- Willer CJ, Bonnycastle LL, Conneely KN, Duren WL, Jackson AU, et al. Screening of 134 single nucleotide polymorphisms (SNPs) previously associated with type 2 diabetes replicates association with 12 SNPs in nine genes. Diabetes. 2007;56:256–264. doi: 10.2337/db06-0461. [DOI] [PubMed] [Google Scholar]
- Yudkin JS. Adipose tissue, insulin action and vascular disease: inflammatory signals. Int J Obes Relat Metab Disord. 2003;27(Suppl 3):S25–S28. doi: 10.1038/sj.ijo.0802496. [DOI] [PubMed] [Google Scholar]
- Kubaszek A, Pihlajamaki J, Komarovski V, Lindi V, Lindstrom J, et al. Promoter polymorphisms of the TNF-alpha (G-308A) and IL-6 (C-174G) genes predict the conversion from impaired glucose tolerance to type 2 diabetes: the Finnish Diabetes Prevention Study. Diabetes. 2003;52:1872–1876. doi: 10.2337/diabetes.52.7.1872. [DOI] [PubMed] [Google Scholar]
- Engstrom G, Hedblad B, Eriksson KF, Janzon L, Lindgarde F. Complement C3 is a risk factor for the development of diabetes: a population-based cohort study. Diabetes. 2005;54:570–575. doi: 10.2337/diabetes.54.2.570. [DOI] [PubMed] [Google Scholar]
- Steinberg GR, Michell BJ, van Denderen BJ, Watt MJ, Carey AL, et al. Tumor necrosis factor alpha-induced skeletal muscle insulin resistance involves suppression of AMP-kinase signaling. Cell Metab. 2006;4:465–474. doi: 10.1016/j.cmet.2006.11.005. [DOI] [PubMed] [Google Scholar]
- Sookoian SC, Gonzalez C, Pirola CJ. Meta-analysis on the G-308A tumor necrosis factor alpha gene variant and phenotypes associated with the metabolic syndrome. Obes Res. 2005;13:2122–2131. doi: 10.1038/oby.2005.263. [DOI] [PubMed] [Google Scholar]
- Bernstein LE, Berry J, Kim S, Canavan B, Grinspoon SK. Effects of etanercept in patients with the metabolic syndrome. Arch Intern Med. 2006;166:902–908. doi: 10.1001/archinte.166.8.902. [DOI] [PMC free article] [PubMed] [Google Scholar]
- Huth C, Heid IM, Vollmert C, Gieger C, Grallert H, et al. IL6 gene promoter polymorphisms and type 2 diabetes: joint analysis of individual participants' data from 21 studies. Diabetes. 2006;55:2915–2921. doi: 10.2337/db06-0600. [DOI] [PubMed] [Google Scholar]
- Fernandez-Real JM, Broch M, Vendrell J, Gutierrez C, Casamitjana R, et al. Interleukin-6 gene polymorphism and insulin sensitivity. Diabetes. 2000;49:517–520. doi: 10.2337/diabetes.49.3.517. [DOI] [PubMed] [Google Scholar]
- Hamid YH, Urhammer SA, Jensen DP, Glumer C, Borch-Johnsen K, et al. Variation in the interleukin-6 receptor gene associates with type 2 diabetes in Danish whites. Diabetes. 2004;53:3342–3345. doi: 10.2337/diabetes.53.12.3342. [DOI] [PubMed] [Google Scholar]
Associated Data
This section collects any data citations, data availability statements, or supplementary materials included in this article.
Supplementary Materials
(40 KB DOC)
(54 KB DOC).


