

Abstract
Bacteriorhodopsin and ε 15 bacteriophage were used as biological test specimens to evaluate the potential structural resolution with images captured from a 4k × 4k charge-coupled device (CCD) camera in a 300-kV electron cryomicroscope. The phase residuals computed from the bacteriorhodopsin CCD images taken at 84,000 × effective magnification averaged 15.7° out to 5.8-Å resolution relative to Henderson’s published values. Using a single-particle reconstruction technique, we obtained an 8.2-Å icosahedral structure of ε 15 bacteriophage with the CCD images collected at an effective magnification of 56,000 ×. These results demonstrate that it is feasible to retrieve biological structures to a resolution close to 2/3 of the Nyquist frequency from the CCD images recorded in a 300-kV electron cryomicroscope at a moderately high but practically acceptable microscope magnification.
Keywords: charge-coupled device, CCD, electron cryomicroscopy, cryo-EM, bacteriorhodopsin, ε 15 phage, 300 kV, resolution, photographic film
1. Introduction
Charge-coupled device (CCD) cameras have gradually replaced photographic film as the image-recording medium in modern transmission electron microscopy. Their advantages over film are numerous (see reviews: (Faruqi and Subramaniam, 2000; Mooney, 2007)): first, the CCD camera makes the recorded images available for instant processing and analysis to provide a rapid feedback for specimen and image quality; second, it has a larger dynamic range and higher linearity relative to film well suited for electron diffraction (Brink and Chiu, 1994); third, it can provide slightly higher signal to noise ratio (SNR) at low resolution than photographic film (Booth et al., 2006; Booth et al., 2004; Sander et al., 2005); and lastly, it can facilitate automatic and high-throughput data collection (Dierksen et al., 1995; Koster et al., 1992; Stagg et al., 2006; Zhang et al., 2003). Due to these advantages, CCD cameras have been widely used in structural studies from cells to macromolecules at a broad range of resolutions.
The retrieval of structural details based on a CCD camera depends partially on the quantum detection efficiency (DQE) and the modulation transfer function (MTF) of the CCD, which may vary according to the electron microscope accelerating voltages and the characteristics of the camera itself (Mooney, 2007). In theory, one could use a higher magnification to overcome the limited resolution of the CCD camera (Sherman et al., 1996). However, even given the same total specimen dose, the usefulness of this approach is diminished by the small number of specimen particles recorded per CCD frame and the relatively large number of frames needed to build up sufficient statistics for the three-dimensional (3D) reconstruction. Furthermore, the accuracy in the contrast transfer function (CTF) parameter determination may be affected due to the small number of particles per CCD frame if no continuous carbon support film is used. Nevertheless, there have been several successful macromolecular applications using 4k × 4k CCD cameras in which 3D reconstructions at subnanometer resolutions have been obtained in 120, 200 or 300-kV electron microscopes (e.g., (Booth et al., 2004; Chiu et al., 2006; Ludtke et al., 2005; Saban et al., 2006; Saban et al., 2005; Stagg et al., 2006; Yonekura et al., 2006; Yu et al., 2008))(see Table 1). However, the magnifications used in those studies were higher than those for photographic film at equivalent resolutions. The resolutions in those studies based on a Fourier Shell Correlation (FSC) (Harauz and van Heel, 1986) of 0.5 from two half data sets as a criterion ranged from 0.4 × Nyquist frequency or less at 200 kV (Booth et al., 2004; Ludtke et al., 2005) and 300 kV (Saban et al., 2006; Saban et al., 2005) to 0.58 × Nyquist frequency at 120 kV (Stagg et al., 2006).
Table 1.
Examples of cryo-EM maps of various specimens studied at different electron accelerating voltages achieved at subnanometer resolutions expressed in terms of a fraction of Nyquist frequency using the Gatan 4k × 4k CCD camera.
| Specimen | Voltage (kV) | Effective Magnification | Å/pixel | Map Resolution (Å) | Resolution as a fraction of Nyquist frequency |
|---|---|---|---|---|---|
| Adenovirus (Saban et al., 2005) | 300 | 253,654 × | 0.59 | 8.9 | 0.13 |
| Adenovirus (Saban et al., 2006) | 300 | ≥253,654 × | 0.59 | 6.9 | 0.17 |
| Cytoplasmic polyhedrosis virus (Booth et al., 2004) | 200 | ~83,100 × | 1.81 | 9.0 | 0.40 |
| Flagellar filament (Yonekura et al., 2006) | 300 | ~110,00 × | 1.35 | 8.0 | 0.34 |
| GroEL (Chiu et al., 2006) | 200 | ~110,800 × | 1.34 | 9.0 | 0.30 |
| GroEL (Stagg et al., 2006) | 120 | 66,400 × | 2.26 | 7.8 | 0.58 |
| Pyruvate dehydrogenase complex (Yu et al., 2008) | 200 | 69,220 × | 2.17 | 8.8 | 0.49 |
| Ryanodine receptor (Ludtke et al., 2005) | 200 | ~83,100 × | 1.81 | 9.6 | 0.38 |
Recent characterization of a Gatan Ultrascan 4k × 4k CCD (model US4000, 15 μm/pixel) with amorphous carbon film images suggested that this latest generation of the Gatan CCD camera has a SNR comparable to photographic film on a 300-kV electron microscope for data out to at least 0.5 × Nyquist frequency (Booth et al., 2006). Here we report the use of trehalose-embedded two-dimensional (2D) crystalline bacteriorhodopsin (bR) and ice-embedded ε 15 bacteriophage as biological test specimens to further evaluate the performance of the same Gatan Ultrascan 4k × 4k CCD in a 300-kV (JEM3000SFF) electron cryomicroscope. Structures for both of these specimens have already been determined by electron cryomicroscopy (cryo-EM) using film data (Henderson et al., 1986; Jiang et al., 2006), thus our results can be evaluated. This study shows the feasibility of retrieving biological structures from both specimens close to 0.67 of the Nyquist frequency with CCD images recorded at a moderately high but practically acceptable magnification.
2. Materials and Methods
2.1. Preparation of specimens
2.1.1. Preparation of bR grids
The bR was prepared from Halobacterium halobium. Large 2D crystals with 2D space group of p3 were then obtained through the fusion and annealing of the smaller native patches of bR by mixing bR solution with octyl glucoside (OG) and dodecyl trimethylammonium chloride (DTAC) according to the established procedure (Baldwin and Henderson, 1984). Locally-produced 400-mesh holey carbon grids with holes around 3 μm in diameter were prepared according to the established procedure (Fukami and Adachi, 1965). A thin carbon film deposited onto mica by evaporation (EMITECH K950 vacuum evaporator) was transferred to the holey grid by floating it onto a water bath to cover the holes. A 5 μl bR solution was placed on the grid followed by the application of a droplet (~5 μl) of 3% trehalose solution. The extra solution mixture was removed slowly by filter paper with a sharp tip.
2.1.2. Preparation of ε 15 bacteriophage grids
The procedure for the purification of ε 15 bacteriophage was described previously (Jiang et al., 2006). The frozen-hydrated grids of ε 15 bacteriophage were prepared according to the procedure described previously (Chen et al., 2007). Briefly, the R 1.2/1.3 400-mesh copper quantifoil grids (Quantifoil Micro Tools GmbH, Jena, Germany) were chemically cleaned with acetone and rinsed with water several times. The dry cleaned grids were flood-beam irradiated for more than 4 hours at 10k × magnification in a JEOL microscope operated at 100 kV (Miyazawa et al., 1999) and then were kept in a desiccator until sample freezing. The treated grids were first glow discharged for 10 seconds, then covered with a thin layer of fresh continuous carbon film floated on a water bath, and dried out naturally at room temperature. A droplet (~3 μl) of ε 15 bacteriophage solution was applied onto the carbon film side of the treated quantifoil grid, blotted, and quickly plunged into liquid ethane cooled by liquid nitrogen at 95-100% humidity and room temperature using a Vitrobot (FEI Company, http://fei.com/Vitrobot). The frozen grids were stored in liquid nitrogen for subsequent cryomicroscopy.
2.2. Cryo-EM and Data Processing
The crystalline bR was imaged on the Gatan Ultrascan 4k × 4k CCD at an effective magnification of 84,000 × (equivalent to 1.79 Å/pixel on the specimen) in the JEM3000SFF electron cryomicroscope operated at 300 kV with specimen at liquid helium temperature (~4 K) and with 25-36 e/Å2 specimen electron dose for each CCD frame. The exposure time was 1.4 or 2 seconds. The data were processed using the MRC 2D crystal processing package (Crowther et al., 1996). The Fourier Transforms of all the bR CCD images were indexed manually using Ximdisp program (Smith, 1999) from the MRC package, and the reciprocal lattice refinement was executed to calculate the unit cell parameters in Fourier space, which were used as the basis for further unbending of the 2D crystal image (Henderson et al., 1986). The defocus for each of the crystal images was determined using CTFFIND program in the MRC package.
The images of ε 15 bacteriophage were collected on the same CCD in the same JEM3000SFF microscope, but with ~36 e/Å2 specimen dose per image frame and an effective magnification of 56,000×, equivalent to 2.68 Å/pixel on the specimen. The exposure time for each CCD frame was 2.0 seconds. The virus particles from CCD frames were boxed out automatically using the program ethan (Kivioja et al., 2000), then screened manually by the EMAN (Ludtke et al., 1999) program boxer. The CTF fitting for all CCD images of ε 15 bacteriophage was done automatically using fitctf.py (Yang et al., 2008), and then was fine-tuned manually with the EMAN program ctfit. The alignment parameters of each particle were determined by a multi-path simulated annealing (multi-path SA) optimization algorithm (Liu et al., 2007). This Monte Carlo type of algorithm is able to search for both center and orientation parameters simultaneously. Each particle’s alignment parameters are checked by a consistency criterion. In each iteration of the refinement procedure, any particle that fails to pass the consistency criterion is not considered in the current 3D reconstruction, but it may be considered in the next iteration. The resolution of the finally converged density map was determined using a criterion of FSC=0.5 from two independent sets of half data. The segmentation for the ε 15 bacteriophage subunit was performed with Chimera (Goddard et al., 2005), which was also used for the surface representations of the cryo-EM density maps. The secondary structure element assignment from the segmented subunit was made using SSEhunter (Baker et al., 2007).
3. Results
3.1. bR as a test specimen
Good CCD images of bR with isotropic Fourier transforms were selected for further data processing. Figure 1 is a Fourier transform of a good CCD image frame taken at an effective magnification of 84,000× at 0.27 μm defocus. The raw image was not shown here, since its contrast is low because trehalose was used as embedding medium and the defocus value was relatively small. After the crystal image is unbent, the computed diffraction spot amplitudes can be expressed in terms of the intensity quality (IQ) (Henderson et al., 1986) of each spot graded from 1 to 8 (Figure 2). In this scale, the lower the IQ, the higher the SNR is, and IQ 7 is equivalent to the signal being equal to the noise. Some of the diffraction spots at ~9 Å resolution (dashed circle in Figure 1), which is close to the innermost dashed circle in Figure 2, can be identified visually in the computed Fourier transform (Figure 1).
Figure 1.
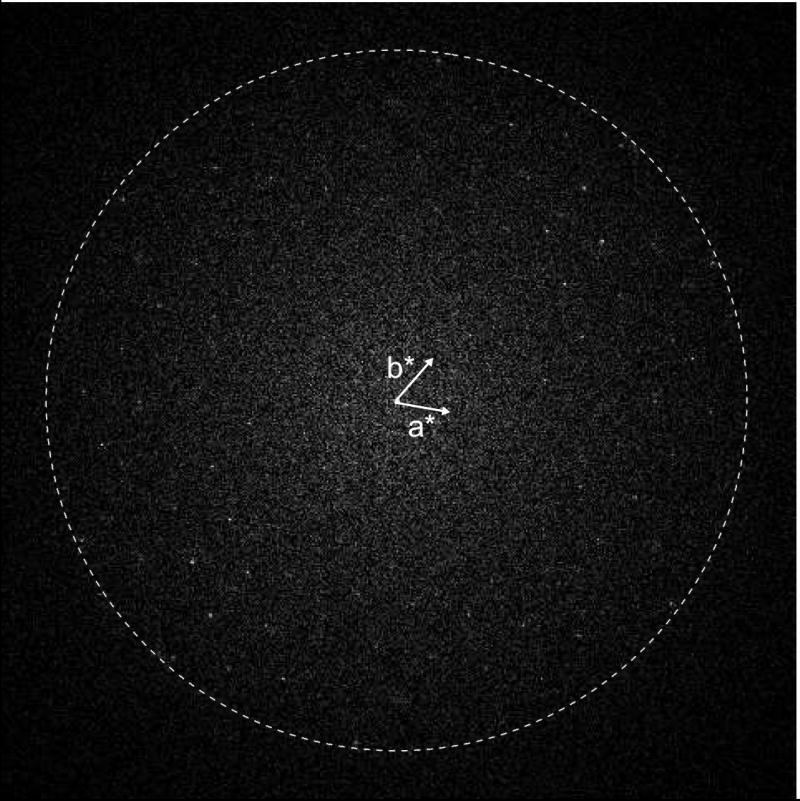
Fourier transform of a good CCD image of bR crystal, taken at an effective magnification of 84,000 × with ~0.27 μm defocus in a 300-kV electron cryomicroscope. The dashed circle indicates ~9 Å in resolution.
Figure 2.
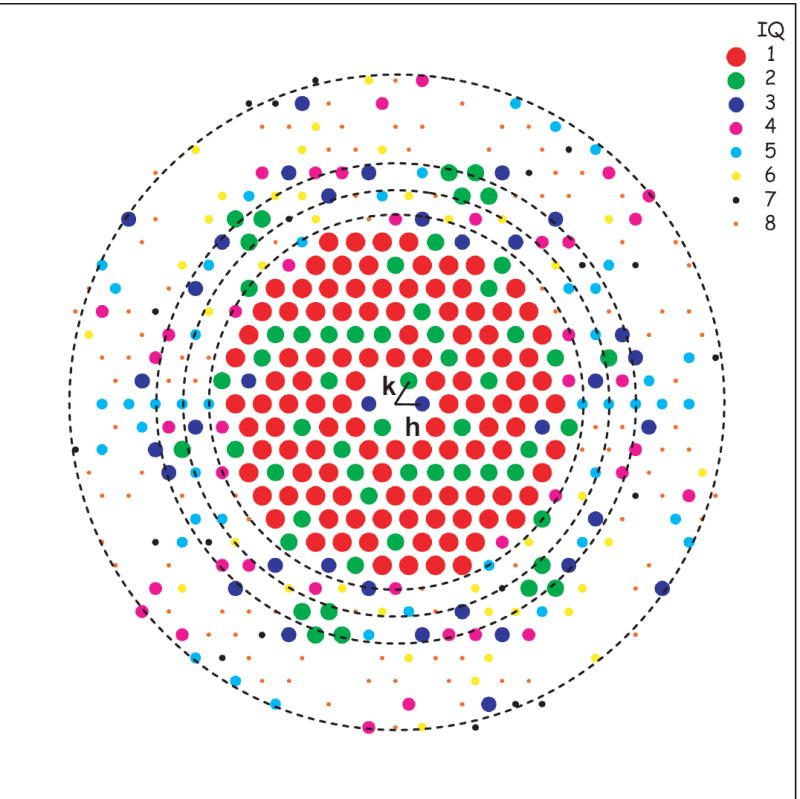
IQ distribution of the Fourier transform amplitudes after the crystal image’s unbending. The Fourier transform of the crystal image was shown in Figure 1. Different size of dots with different color, as shown at upper right, indicates IQ from 1 (large dot in red) to 8 (small dot in red). The missing spots on diffraction spots lattice are the ones with IQ=9, which are not included. The conventional IQ scale (Henderson et al., 1986) is used: SNR ≥ 7 when IQ = 1 (large red dots); SNR = 3.5 when IQ = 2 (green dots); SNR = 2.33 when IQ = 3 (blue dots); SNR = 1.75 when IQ = 4 (magenta dots); SNR = 1.4 when IQ = 5 (cyan dots); SNR = 1.17 when IQ = 6 (yellow dots); SNR = 1 when IQ = 7 (black dots); SNR < 1 when IQ = 8 (IQ = 8 in small red dots). The dashed circles from the innermost to the outermost represent 7.7, 6.8, 6.0 and 4.4 Å in resolution, respectively.
The phase residuals from this crystal image were then calculated in different resolution ranges and compared with the Henderson’s published phase values on bR (Henderson et al., 1986) by the origtiltk program from the MRC package. Table 2 shows the phase residual values versus resolution ranges using all diffraction spots of IQ ≤8 (shown in Figure 2) from the crystal data. The bottom row of the table shows the overall average phase residual of 15.7° out to 5.8-Å resolution, which corresponds to about 0.62 × Nyquist frequency at the effective magnification of 84,000 ×. When we extended the resolution further to ~4.3 Å, the phase residuals were 65.3°, 29.4°, 52.8°, 28.2° and 31.5° for the resolution ranges of 5.8 Å - 5.3 Å, 5.3 Å - 5.0 Å, 5.0 Å - 4.7 Å, 4.7 Å - 4.5 Å and 4.5 Å - 4.3 Å, respectively. However, the phase residuals from all the resolution ranges in 100 Å to 5.8 Å are less than 30° (Table 2). This suggests that the phases retrieved from the bR CCD image recorded at 84,000 × effective magnification are reliable to at least 5.8 Å, a resolution which is close to 2/3 × Nyquist frequency.
Table 2.
The phase residuals in different resolution ranges for the bR crystal (whose Fourier transform is shown in Figure 1) compared with Henderson’s published phase values (Henderson et al., 1986). All the data after unbending with IQ ≤8 were used for phase residual calculation. The crystal was imaged at 84,000 × effective magnification on the CCD in a 300-kV electron cryomicroscope. The bottom row of the table lists the overall phase residual and the total number of reflections.
| Resolution Range (Å) | Phase Residual | Number of Reflections |
|---|---|---|
| 100.0–14.1 | 8.6 ° | 26 |
| 14.0–10.0 | 8.4 ° | 27 |
| 10.0–8.2 | 9.0 ° | 27 |
| 8.1–7.1 | 24.2 ° | 13 |
| 7.0–6.3 | 29.1 ° | 19 |
| 6.3–5.8 | 25.7 ° | 20 |
| Overall | 15.7 ° | 132 |
In addition to the phases retrieved from the CCD images, the Fourier amplitudes of the bR CCD images were also evaluated in the form of the ln of the ratio between the computed Fourier amplitude from the image (image amplitude) and the electron diffraction amplitude as a function of the frequency squared (Figure 3). As shown previously, such ratio can be approximated as an exponential fall-off as follows:
Figure 3.
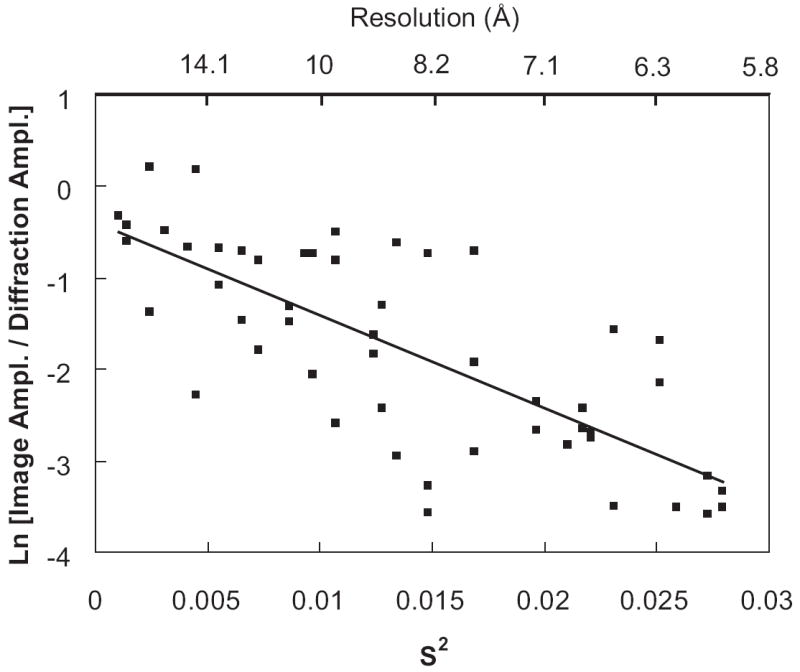
The plot of Ln [Image Amplitude / Diffraction Amplitude] versus frequency squared (S2) for the bR CCD image whose Fourier transform is shown in Figure 1. Only reflections with IQ≤ 7 in the image amplitudes are used in this plot. The referenced diffraction amplitudes were taken from Henderson’s values (Henderson et al., 1986; Henderson et al., 1990). A trendline was drawn based on the experimental data points.
where B was termed as crystallographic B-factor (Rosenthal and Henderson, 2003). In this comparison, the electron diffraction amplitudes were obtained from Henderson’s published values (Henderson et al., 1986; Henderson et al., 1990). A trendline in Figure 3 was drawn based on the experimental data points resulting in a crystallographic B-factor equivalent to ~ 432 Å2. The factors which degrade image contrast primarily include specimen movement and charging, radiation damage, inelastic electron scattering, partial beam coherence and the detector’s MTF (Henderson, 1992; Rosenthal and Henderson, 2003).
3.2. ε 15 bacteriophage as the second test specimen
Besides the 2D bR crystals, we used a single-particle sample, ε 15 bacteriophage, as a second test specimen to assess the performance of the same Gatan Ultrascan 4k × 4k CCD in the same microscope. Figure 4a is one selected area from a typical CCD image frame of ε 15 bacteriophage kept at liquid helium temperature (~4 K) and at an effective magnification of 56,000×. Figure 4b shows the Fourier transform intensity of 14 boxed-out particle images from the whole CCD frame, in which at least 4 CTF zeros could be observed, with the fourth zero corresponding to 8.8 Å. In order to assess the data quantitatively, one-dimensional (1D) power spectrum and SNR (Saad et al., 2001) were plotted as shown in Figure 5a and Figure 5b, respectively, where signal peaks between 8-10 Å can be easily detected. When the SNR curve (Figure 5b) is further quantitatively checked, SNR equals ~5% at 8.2 Å. This SNR level is usually sufficient to obtain a 3D reconstruction by cryo-EM at that resolution if the particle conformation is well preserved and there is no preferred particle orientation. The fall-off of SNR as a function of spatial frequency can also be approximated as a Gaussian function, whose width has been termed as the experimental B-factor (Saad et al., 2001). The average experimental B-factor value in the ε 15 bacteriophage data on CCD is ~100 Å2, which is consistent with the crystallographic B-factor determined in the bR data shown in Figure 3, because the experimental B-factor (Saad et al., 2001) is defined 4 times smaller numerically than the crystallographic B-factor.
Figure 4.
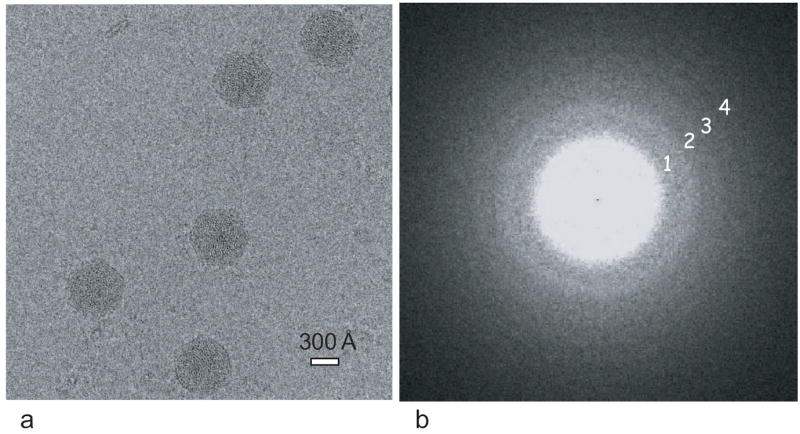
(a) One selected area (1560 pixel × 1560 pixel) from a typical cryo-image of ε 15 bacteriophage recorded on the CCD at an effective magnification of 56,000 × in a 300-kV electron cryomicroscope. The defocus for the image is ~1.55 μm. (b) The Fourier transform of 14 boxed-out particles from the whole CCD frame, portion of which is shown in (a). Four CTF zeros are marked with 1, 2, 3, 4, representing 17.8, 12.5, 10.1 and 8.8 Å, respectively.
Figure 5.
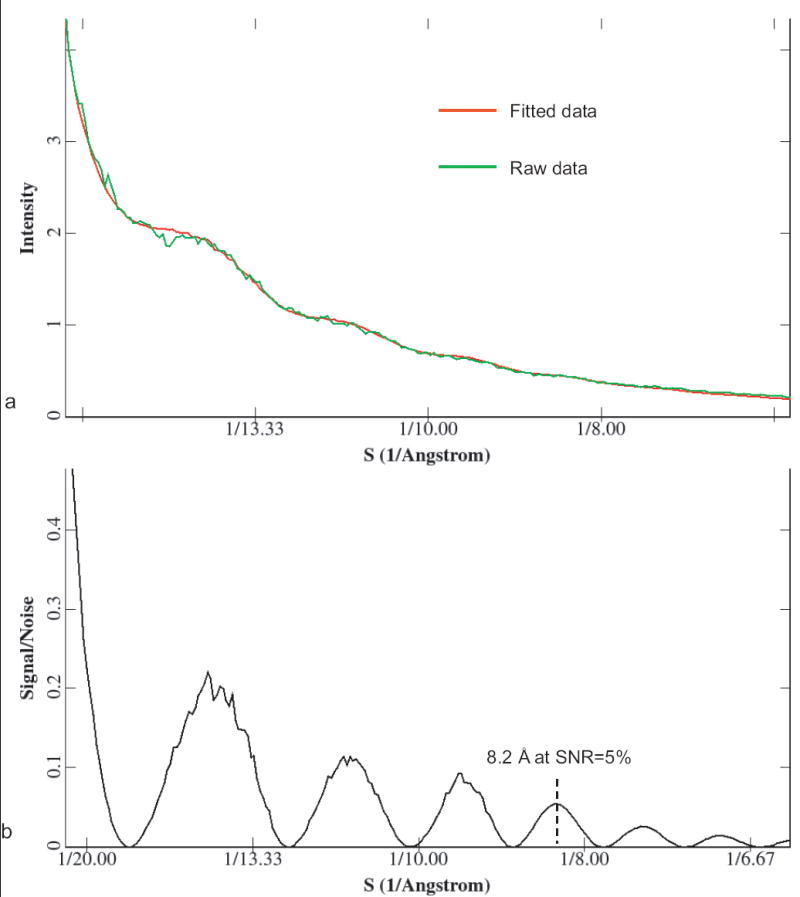
Quantitative assessment of the quality of the ε 15 bacteriophage data recorded on the CCD. (a) 1D power spectrum of Figure 4b. The curve in red is for the fitted data and the curve in green is for the raw experimental data. (b) SNR. Both the 1D power spectrum and the SNR curve show some signal peaks between 8-10 Å. SNR equals 5% at 8.2 Å.
In total, ~4,500 particles boxed out from the CCD images without apparent astigmatism or drift were utilized for further processing. A final 8.2-Å density map of ε 15 bacteriophage with icosahedral symmetry imposed was obtained (Figure 6a). The resolution was assessed to be 8.2 Å with the FSC=0.5 criterion (Figure 6b) from two independent half data sets. Cylindrical densities representing α helices could be observed directly from the 3D density map (Figure 6a), which confirms that the resolution is definitely in the subnanometer range. In this map, the segmented subunit (Figure 7a) shows not only seven α helices (in green) and two β sheets (in cyan) (Figure 7b) as quantified by SSEHunter (Baker et al., 2007), but also connectivity in the densities of the N-arm and the long E-loop regions (Figure 7a). All of the observed structural features in this map match well with a higher resolution (4.5Å) map of ε 15 with image data recorded on photographic film in the same electron cryomicroscope (Jiang et al., 2008)
Figure 6.
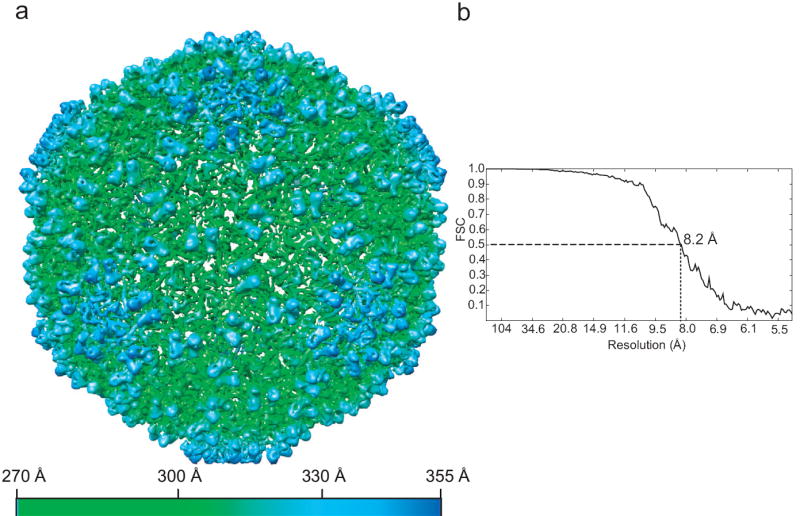
(a) The surface representation of the 3D density map of ε 15 bacteriophage reconstructed from the CCD data. The map is viewed along icosahedral 3-fold symmetry axis, and is radially colored from 270 Å to 355 Å according to the bottom color scheme. In order to display the α helices more clearly, a high isosurface threshold (6.2σ) was used. The inner DNA density was removed in this representation. (b) FSC curve of resolution measurement for the 3D density map. The resolution is 8.2 Å at FSC=0.5.
Figure 7.
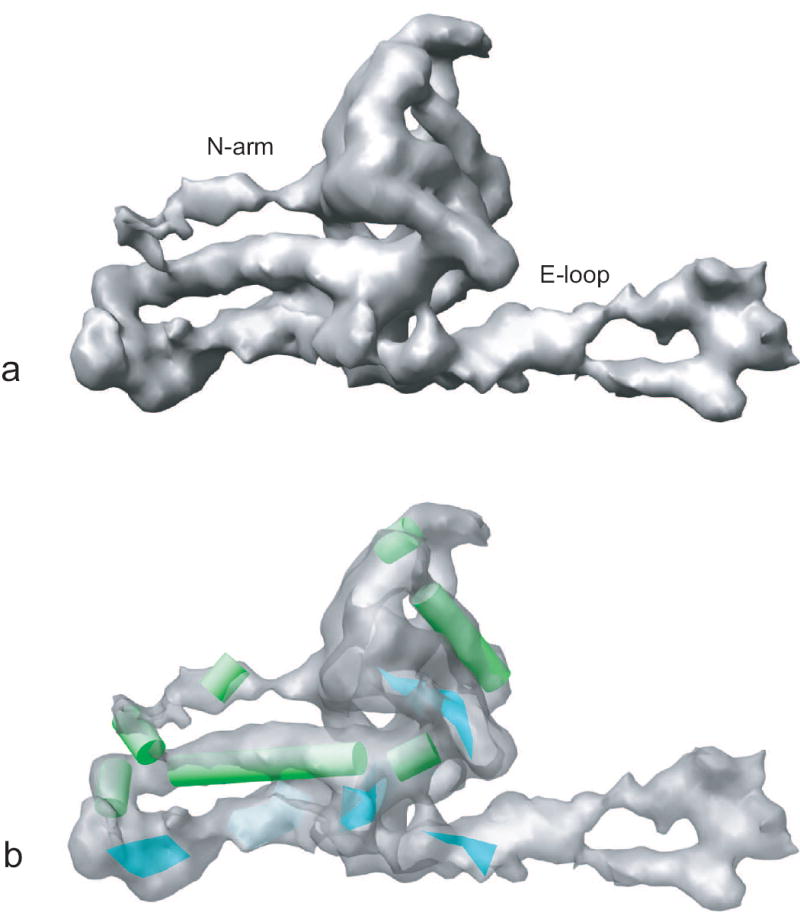
The secondary structure elements in the segmented subunit of ε 15 bacteriophage 3D density map. (a) The segmented subunit, in which labeled N-arm and E-loop region densities were well resolved at this resolution. (b) Seven α helices (in green) and two β sheets (in cyan) were identified by SSEHunter in the segmented subunit. The subunit density in (b) is displayed with some transparency.
4. Discussion
The camera used in this study is the same as that characterized previously with carbon film data (Booth et al., 2006). The MTF and the DQE are 0.07 and 0.03 at 0.67 × Nyquist frequency (P. Mooney, unpublished data), respectively, using methods described previously (Mooney, 2007). Our results from 2D crystalline bR clearly show that the phases retrieved from the images collected on the current generation of Gatan Ultrascan 4k × 4k CCD (15 μm/pixel) are reliable at least out to ~5.8 Å (~0.62 × Nyquist frequency) at an intermediate effective magnification of 84,000 × in a 300-kV electron cryomicroscope. In addition, by a single-particle 3D icosahedral reconstruction based on the multi-path SA optimization algorithm (Liu et al., 2007), the ε 15 bacteriophage structure has been successfully reconstructed from the images taken on the CCD at an effective magnification of 56,000 × to 8.2 Å resolution, which is close to 0.67 × Nyquist frequency, 8.04 Å (see Table 3).
Table 3.
Look-up table for the effective magnifications on the detector and the corresponding Nyquist frequency values in real space from images recorded with the Gatan 4k × 4k CCD camera (15μm/pixel). The practical achievable resolution corresponds to 2/3 of the Nyquist frequency.
| Detector Magnification | Å/pixel | Nyquist Frequency in Å | 1/2 Nyquist Frequency in Å | 2/3 Nyquist Frequency in Å |
|---|---|---|---|---|
| 42,000 × | 3.57 | 7.14 | 14.29 | 10.71 |
| 56,000 × | 2.68 | 5.36 | 10.71 | 8.04 |
| 70,000 × | 2.14 | 4.29 | 8.57 | 6.42 |
| 84,000 × | 1.79 | 3.57 | 7.14 | 5.37 |
| 112,000 × | 1.34 | 2.68 | 5.36 | 4.02 |
| 140,000 × | 1.07 | 2.14 | 4.28 | 3.21 |
| 168,000 × | 0.89 | 1.79 | 3.57 | 2.67 |
| 210,000 × | 0.71 | 1.43 | 2.86 | 2.13 |
We have achieved a resolution of about 2/3 × Nyquist frequency from CCD data of biological test macromolecules collected in a 300-kV electron cryomicroscope. In the case of ε 15 bacteriophage, the magnification used was acceptable to provide a sufficient number of particles of 700 Å in diameter per CCD frame for subsequent data processing and reconstruction at subnanometer resolution. Table 3 lists the Nyquist frequency values in real space and the proposed achievable resolutions at some effective magnifications. For example, in order to obtain the 3D structure at near atomic resolution (3.5 Å or better) from the CCD imaging in cryo-EM, the pixel size on the specimen would be required to be ~1.07 Å/pixel, and the effective magnification would be about 140,000 × if 15-μm-pixel-size CCD camera is used for data collection. In this sense, the performance of the CCD camera is comparable to the photographic film even at this high resolution.
A general question in using the CCD camera for high resolution data collection at a relatively higher magnification is what dosage to use. The choice of relatively low magnification used for recording images on photographic film has been primarily dictated by the signal to be above the fog level of the photographic film (Kuo and Glaeser, 1975). In the case of the CCD camera, there is no chemical fog but there is electronic noise. Given the same total specimen dose, the SNR of the CCD image, calculated as a function of spatial frequency, is not affected by the imaging magnification (Booth et al., 2006). Therefore, it is reasonable to use the same dose as constrained by the radiation damage to record the images at a higher magnification on the CCD as long as it is within the linear range of detector response. The higher SNR of the CCD image at low frequency (Booth et al., 2006) offers an additional advantage to display the low resolution image contrast of ice-embedded single particles even at some lower detector dose under which it is impractical to use photographic film for recording.
Although 200 or 300-kV intermediate-high-voltage electron microscopes are generally preferred for high-resolution structural studies (Zhou and Chiu, 1993), especially for macromolecules with large dimensions, the point spread function (PSF) of the CCD camera and the contrast of macromolecules become worse at higher electron accelerating voltage (Downing and Hendrickson, 1999; Faruqi and Subramaniam, 2000). It has been reported that the GroEL structure at 7.8 Å corresponding to 0.58 × Nyquist frequency under those experimental conditions could be retrieved from the CCD images (Stagg et al., 2006). However, the electron accelerating voltage for that study was 120-kV at which CCD camera is expected to have superior PSF relative to the higher energy electrons. Therefore, there is a great potential in the use of a decelerator which slows the higher-voltage electrons containing specimen structural information after the projector lens but before the detector to obtain a better PSF in the CCD images (Ken Downing, private communication).
In this study, the 300-kV electron microscope is equipped with a liquid helium temperature stage which is capable of recording images at resolutions beyond 4.5 Å including 2D (Murata et al., 2000) and 1D (Miyazawa et al., 2003) arrays and single particles (Jiang et al., 2008; Ludtke et al., 2008). Nevertheless, our observations should be valid for any well-functioning 300-kV instrument operated at any low temperature.
Regarding the size of the detector, the typically scanned photographic film still records ~7 times the number of pixels as a 4k × 4k CCD camera (15 μm/pixel). Thus, film can collect more particles per frame than the latter, which makes relatively easier to determine the CTF parameters for each cryo-EM image from the 1D rotationally averaged power spectrum. With further development and general utilization of larger format CCD cameras (e.g., 8k × 8k or larger), photographic film might be easily supplanted by CCD cameras in a majority of the biological applications even for reconstructions between 3-5 Å resolution.
Acknowledgments
This research has been supported by grants P01GM064692 and P41RR02250. We thank Drs John Spudich and Elena Spudich at UTHSC for the bR, Drs Jonathan King and Peter Weigele for the ε15 bacteriophage and Dr. Judith Short for providing the MRC package. We acknowledge the advice from Dr. Ken Downing at LBNL and Dr. Huilin Li at BNL on the 2D crystal data processing and Dr. Matthew Baker at NCMI on the use of the SSEHunter.
Footnotes
Publisher's Disclaimer: This is a PDF file of an unedited manuscript that has been accepted for publication. As a service to our customers we are providing this early version of the manuscript. The manuscript will undergo copyediting, typesetting, and review of the resulting proof before it is published in its final citable form. Please note that during the production process errors may be discovered which could affect the content, and all legal disclaimers that apply to the journal pertain.
References
- Baker ML, Ju T, Chiu W. Identification of secondary structure elements in intermediate-resolution density maps. Structure. 2007;15:7–19. doi: 10.1016/j.str.2006.11.008. [DOI] [PMC free article] [PubMed] [Google Scholar]
- Baldwin J, Henderson R. Measurement and evaluation of electron diffraction patterns from two-dimensional crystals. Ultramicroscopy. 1984;14:319–335. [Google Scholar]
- Booth CR, Jakana J, Chiu W. Assessing the capabilities of a 4kx4k CCD camera for electron cryo-microscopy at 300kV. J Struct Biol. 2006;156:556–563. doi: 10.1016/j.jsb.2006.08.019. [DOI] [PubMed] [Google Scholar]
- Booth CR, Jiang W, Baker ML, Hong Zhou Z, Ludtke SJ, Chiu W. A 9Å single particle reconstruction from CCD captured images on a 200kV electron cryomicroscope. J Struct Biol. 2004;147:116–27. doi: 10.1016/j.jsb.2004.02.004. [DOI] [PubMed] [Google Scholar]
- Brink J, Chiu W. Applications of a slow-scan CCD camera in protein electron crystallography. J Struct Biol. 1994;113:23–34. doi: 10.1006/jsbi.1994.1029. [DOI] [PubMed] [Google Scholar]
- Chen D-H, Jakana J, Chiu W. Single-particle cryo-EM data collected on a 300-kV liquid helium-cooled electron cryomicroscope. J Chinese Electron Microsc. 2007;26:473–79. [Google Scholar]
- Chiu W, Chen D-H, Jakana J, Chang J, Jiang W, Ludtke SL, Baker ML. Visualization of biological nano-machines at subnanometer resolutions. JEOL News. 2006;41:12–17. [Google Scholar]
- Crowther RA, Henderson R, Smith JM. MRC image processing programs. J Struct Biol. 1996;116:9–16. doi: 10.1006/jsbi.1996.0003. [DOI] [PubMed] [Google Scholar]
- Dierksen K, Typke D, Hegerl R, Walz J, Sackmann E, Baumeister W. Three-dimensional structure of lipid vesicles embedded in vitreous ice and investigated by automated electron tomography. Biophys J. 1995;68:1416–22. doi: 10.1016/S0006-3495(95)80314-0. [DOI] [PMC free article] [PubMed] [Google Scholar]
- Downing KH, Hendrickson FM. Performance of a 2k CCD camera designed for electron crystallography at 400 kV. Ultramicroscopy. 1999;75:215–234. doi: 10.1016/s0304-3991(98)00065-5. [DOI] [PubMed] [Google Scholar]
- Faruqi AR, Subramaniam S. CCD detectors in high-resolution biological electron microscopy. Quart Rev Biophys. 2000;33:1–27. doi: 10.1017/s0033583500003577. [DOI] [PubMed] [Google Scholar]
- Fukami A, Adachi K. A new method of preparation of a self-perforated micro plastic grid and its application. J Electron Microsc. 1965;14:112–8. [PubMed] [Google Scholar]
- Goddard TD, Huang CC, Ferrin TE. Software Extensions to UCSF Chimera for Interactive Visualization of Large Molecular Assemblies. Structure (Camb) 2005;13:473–82. doi: 10.1016/j.str.2005.01.006. [DOI] [PubMed] [Google Scholar]
- Harauz G, van Heel M. Exact filters for general geometry three dimensional reconstruction. Optik. 1986;73:146–156. [Google Scholar]
- Henderson R. Image contrast in high-resolution electron microscopy of biological macromolecules: TMV in ice. Ultramicroscopy. 1992;46:1–18. doi: 10.1016/0304-3991(92)90003-3. [DOI] [PubMed] [Google Scholar]
- Henderson R, Baldwin JM, Downing KH, Lepault J, Zemlin F. Structure of purple membrane from Halobacterium halobium: Recording, measurement and evaluation of electron micrographs at 3.5 Å resolution. Ultramicroscopy. 1986;19:147–178. [Google Scholar]
- Henderson R, Baldwin JM, Ceska TA, Zemlin F, Beckmann E, Downing KH. Model for the structure of bacteriorhodopsin based on high-resolution electron cryo-microscopy. J Mol Biol. 1990;213:899–929. doi: 10.1016/S0022-2836(05)80271-2. [DOI] [PubMed] [Google Scholar]
- Jiang W, Chang J, Jakana J, Weigele P, King J, Chiu W. Structure of epsilon15 bacteriophage reveals genome organization and DNA packaging/injection apparatus. Nature. 2006;439:612–6. doi: 10.1038/nature04487. [DOI] [PMC free article] [PubMed] [Google Scholar]
- Jiang W, Baker ML, Jakana J, Weigele PR, King J, Chiu W. Backbone structure of the infectious epsilon15 virus capsid revealed by electron cryomicroscopy. Nature. 2008;451:1130–4. doi: 10.1038/nature06665. [DOI] [PubMed] [Google Scholar]
- Kivioja T, Ravantti J, Verkhovsky A, Ukkonen E, Bamford D. Local average intensity-based method for identifying spherical particles in electron micrographs. J Struct Biol. 2000;131:126–34. doi: 10.1006/jsbi.2000.4279. [DOI] [PubMed] [Google Scholar]
- Koster AJ, Chen H, Sedat JW, Agard DA. Automated microscopy for electron tomography. Ultramicroscopy. 1992;46:207–27. doi: 10.1016/0304-3991(92)90016-d. [DOI] [PubMed] [Google Scholar]
- Kuo IA, Glaeser RM. Development of methodology for low exposure, high resolution electron microscopy of biological specimens. Ultramicroscopy. 1975;1:53–66. doi: 10.1016/s0304-3991(75)80007-6. [DOI] [PubMed] [Google Scholar]
- Liu X, Jiang W, Jakana J, Chiu W. Averaging tens to hundreds of icosahedral particle images to resolve protein secondary structure elements using a Multi-path Simulated Annealing optimization algorithm. J Struct Biol. 2007;160:11–27. doi: 10.1016/j.jsb.2007.06.009. [DOI] [PMC free article] [PubMed] [Google Scholar]
- Ludtke SJ, Baldwin PR, Chiu W. EMAN: Semi-automated software for high resolution single particle reconstructions. J Struct Biol. 1999;128:82–97. doi: 10.1006/jsbi.1999.4174. [DOI] [PubMed] [Google Scholar]
- Ludtke SJ, Serysheva, Hamilton SL, Chiu W. The pore structure of the closed RyR1 channel. Structure (Camb) 2005;13:1203–11. doi: 10.1016/j.str.2005.06.005. [DOI] [PMC free article] [PubMed] [Google Scholar]
- Ludtke SJ, Baker ML, Chen DH, Song JL, Chuang DT, Chiu W. De Novo Backbone Trace of GroEL from Single Particle Electron Cryomicroscopy. Structure. 2008;16:441–8. doi: 10.1016/j.str.2008.02.007. [DOI] [PubMed] [Google Scholar]
- Miyazawa A, Fujiyoshi Y, Unwin N. Structure and gating mechanism of the acetylcholine receptor pore. Nature. 2003;423:949–55. doi: 10.1038/nature01748. [DOI] [PubMed] [Google Scholar]
- Miyazawa A, Fujiyoshi Y, Stowell M, Unwin N. Nicotinic acetylcholine receptor at 4.6 Å resolution: transverse tunnels in the channel wall. J Mol Biol. 1999;288:765–86. doi: 10.1006/jmbi.1999.2721. [DOI] [PubMed] [Google Scholar]
- Mooney P. Optimization of image collection for cellular electron microscopy. Methods Cell Biol. 2007;79:661–719. doi: 10.1016/S0091-679X(06)79027-6. [DOI] [PubMed] [Google Scholar]
- Murata K, Mitsuoka K, Hirai T, Walz T, Agre P, Heymann JB, Engel A, Fujiyoshi Y. Structural determinants of water permeation through aquaporin-1. Nature. 2000;407:599–605. doi: 10.1038/35036519. [DOI] [PubMed] [Google Scholar]
- Rosenthal PB, Henderson R. Optimal determination of particle orientation, absolute hand, and contrast loss in single-particle electron cryomicroscopy. J Mol Biol. 2003;333:721–45. doi: 10.1016/j.jmb.2003.07.013. [DOI] [PubMed] [Google Scholar]
- Saad A, Ludtke SJ, Jakana J, Rixon FJ, Tsuruta H, Chiu W. Fourier amplitude decay of electron cryomicroscopic images of single particles and effects on structure determination. J Struct Biol. 2001;133:32–42. doi: 10.1006/jsbi.2001.4330. [DOI] [PubMed] [Google Scholar]
- Saban SD, Silvestry M, Nemerow GR, Stewart PL. Visualization of alpha-helices in a 6-angstrom resolution cryoelectron microscopy structure of adenovirus allows refinement of capsid protein assignments. J Virol. 2006;80:12049–59. doi: 10.1128/JVI.01652-06. [DOI] [PMC free article] [PubMed] [Google Scholar]
- Saban SD, Nepomuceno RR, Gritton LD, Nemerow GR, Stewart PL. CryoEM structure at 9A resolution of an adenovirus vector targeted to hematopoietic cells. J Mol Biol. 2005;349:526–37. doi: 10.1016/j.jmb.2005.04.034. [DOI] [PubMed] [Google Scholar]
- Sander B, Golas MM, Stark H. Advantages of CCD detectors for de novo three-dimensional structure determination in single-particle electron microscopy. J Struct Biol. 2005;151:92–105. doi: 10.1016/j.jsb.2005.04.004. [DOI] [PubMed] [Google Scholar]
- Sherman MB, Brink J, Chiu W. Performance of a slow-scan CCD camera for macromolecular imaging in a 400 kV electron cryomicroscope. Micron. 1996;27:129–39. doi: 10.1016/0968-4328(96)00018-2. [published erratum appears in Micron 1996 Oct; 27(5):I] [DOI] [PubMed] [Google Scholar]
- Smith JM. Ximdisp--A visualization tool to aid structure determination from electron microscope images. J Struct Biol. 1999;125:223–8. doi: 10.1006/jsbi.1998.4073. [DOI] [PubMed] [Google Scholar]
- Stagg SM, Lander GC, Pulokas J, Fellmann D, Cheng A, Quispe JD, Mallick SP, Avila RM, Carragher B, Potter CS. Automated cryoEM data acquisition and analysis of 284742 particles of GroEL. J Struct Biol. 2006;155:470–81. doi: 10.1016/j.jsb.2006.04.005. [DOI] [PubMed] [Google Scholar]
- Yang C, Jiang W, Chen D-H, Adiga U, Chiu W, Ng EG. Estimating contrast transfer function and associated parameters by constrained nonlinear optimization. 2008 doi: 10.1111/j.1365-2818.2009.03137.x. In preparation. [DOI] [PMC free article] [PubMed] [Google Scholar]
- Yonekura K, Braunfeld MB, Maki-Yonekura S, Agard DA. Electron energy filtering significantly improves amplitude contrast of frozen-hydrated protein at 300kV. J Struct Biol. 2006;156:524–36. doi: 10.1016/j.jsb.2006.07.016. [DOI] [PubMed] [Google Scholar]
- Yu XY, Hiromasa TH, Stoops JK, Roche TE, Zhou ZH. Structures of the human pyruvate dehydrogenase complex cores: a highly conserved catalytic center with flexible N-terminal domains. Structure (Camb) 2008;16:104–14. doi: 10.1016/j.str.2007.10.024. [DOI] [PMC free article] [PubMed] [Google Scholar]
- Zhang P, Borgnia MJ, Mooney P, Shi D, Pan M, O’Herron P, Mao A, Brogan D, Milne JL, Subramaniam S. Automated image acquisition and processing using a new generation of 4K×4K CCD cameras for cryo electron microscopic studies of macromolecular assemblies. J Struct Biol. 2003;143:135–44. doi: 10.1016/s1047-8477(03)00124-2. [DOI] [PubMed] [Google Scholar]
- Zhou ZH, Chiu W. Prospects for using an IVEM with a FEG for imaging macromolecules towards atomic resolution. Ultramicroscopy. 1993;49:407–16. doi: 10.1016/0304-3991(93)90246-t. [DOI] [PubMed] [Google Scholar]