

Abstract
Recent development of the phosphate chelator, Phos-tag™, together with Phos-tag™ pendant reagents, has provided new methods for detection of phosphorylated serine, threonine, tyrosine, and histidine residues in phosphoproteins. We have investigated the use of Phos-tag™ for detection and quantification of phospho-aspartate in response regulator proteins that function within two-component signaling systems. Alternative methods are especially important, as the labile nature of the acyl phosphate bond in response regulator proteins has restricted the application of many traditional methods of phosphoprotein analysis. We demonstrate that Phos-tag™ gel stain can be used to detect phospho-Asp in response regulators, and that Phos-tag™ acrylamide gel electrophoresis can be used to separate phosphorylated and unphosphorylated forms of response regulator proteins. The latter method, coupled to western blot analysis, enables detection of specific phosphorylated proteins in complex mixtures such as cell lysates. Standards of phosphorylated proteins can be used to correct for hydrolysis of the labile phospho-Asp bond that invariably occurs during analysis. We have employed Phos-tag™ methods to characterize the phosphorylation state of the Escherichia coli response regulator PhoB both in vitro, using purified protein, and in vivo, by analyzing lysates of cells grown under different conditions of induction of the PhoR/PhoB phosphate assimilation pathway.
Keywords: Acyl phosphate, PhoB, Phosphate stain, Phospho-Asp, Phosphoprotein, Two-component
Introduction
Two-component systems are prevalent signaling pathways in bacteria [1] and play important roles in signaling in archaea [2], plants [3], and lower eukaryotes [4, 5]. In these signal transduction systems, sensor histidine kinase (HK)1 proteins or domains autophosphorylate specific histidine residues via an intrinsic kinase activity and subsequently, by either an intermolecular or an intramolecular phosphotransfer reaction, the high energy phosphoryl group is shuttled to an aspartate residue in a response regulator (RR) protein or receiver domain [6]. Phosphorylation of the RR typically leads to its activation and a cellular response.
RR proteins are not amenable to many of the techniques often applied to the study of phosphorylated proteins as the phospho-Asp acylphosphate bond is easily hydrolyzed. Acylphosphates are both acid and base labile with half-lives of ~6 h under neutral conditions at ambient temperature [7]. No antibodies that recognize phospho-Asp are available. Current methods for in vitro analysis of RR phosphorylation either follow phosphorylation indirectly, via phosphorylation induced changes in intrinsic protein fluorescence [8, 9] or chromatographic migration [10], or directly monitor phosphorylation using radiolabeled phosphate [8, 11, 12]. The latter methods are difficult, either requiring enzymatic phosphotransfer from γ-radiolabeled ATP catalyzed by sensor histidine kinases that are often transmembrane proteins or the use of radiolabeled high-energy small molecule phosphodonors that are not commercially available.
Recent studies have described the use of a dinuclear metal complex that acts as a specific phosphate-binding agent, commercially known as Phos-tag™ [13–21]. This reagent, in the presence of two equivalents of Zn2+ or Mn2+, forms a specific noncovalent complex with the phosphomonoester dianion at neutral pH. Phos-tag™ has been shown to selectively interact with phosphorylated peptides or proteins containing phospho-Ser, phospho-Thr, phospho-Tyr, and phospho-His residues [15, 20]. Phos-tag™ pendant molecules have been successfully used in conjunction with fluorescence, chromatography, MALDI-TOF-MS1, surface plasmon resonance (SPR), gel electrophoresis, and immunoblotting methods to separate and characterize phosphorylated proteins under conditions of neutral pH, as well as near physiological temperature and ionic strength [13–20]. The ability of Phos-tag™ based technologies to perform their intended function under mild solution conditions, and their ability to bind essentially any phosphomonoester, makes Phos-tag™ a potentially useful method for analyzing the labile phospho-Asp residues of RR proteins.
To date, no studies have described methods for applying Phos-tag™ based technologies to the study of RR phosphorylation. We sought to use Phos-tag™ products for the characterization and analysis of RR proteins. To this end, the phosphorylation of the Escherichia coli RR PhoB was characterized using both the fluorescent Phos-tag™ gel stain as well as Phos-tag™ acrylamide. We also compared data obtained using Phos-tag™ based technologies with established methods for the characterization of PhoB phosphorylation, specifically, incorporation of radiolabeled phosphate, phosphorylation-induced tryptophan fluorescence quenching, and reverse phase HPLC. Due to the fact that Phos-tag™ acrylamide SDS-PAGE is amenable to western blotting, this technique can be useful for monitoring RR phosphorylation in vivo. We have used Phos-tag™ acrylamide SDS-PAGE of E. coli lysates coupled to western blotting with anti-PhoB polyclonal rabbit antibodies to detect the extent of phosphorylation of PhoB protein in cells grown under conditions that provide different levels of induction of the PhoR/PhoB phosphate assimilation two-component system.
The studies presented here indicate that both Phos-tag™ gel stain and Phos-tag™ acrylamide can be used to characterize RR phosphorylation and that these techniques yield results remarkably similar to results obtained by established protocols. Phos-tag™ based methods are likely to be nearly universally applicable to all RR proteins, due to the fact that these techniques require no specific protein primary, secondary or tertiary structure, as do many of the techniques currently employed for characterization of RR phosphorylation. Techniques such as those described here provide much needed additional methodologies for the characterization of two-component signaling systems.
Materials and methods
Reagents, proteins, and strains
Phos-tag™ 300/460 Phosphoprotein Gel Stain was obtained from Perkin Elmer, Inc. Phos-tag™ Acrylamide was purchased as a lyophilized powder from the Phos-tag™ Consortium (Tokyo, Japan). E. coli PhoB and Thermotoga maritima DrrD were expressed in E. coli and purified using methods similar to those previously described [9, 22].
To express the PhoB D53A mutant protein an expression vector was prepared from a plasmid containing wild-type phoB using the Stratagene Quikchange® site-directed mutagenesis kit with the primers 5′-CGGATTTAATTCTCCTCGCCTGGATGTTACCTGGCGG-3′ and 5′-CCGCCAGGTAACATCCAGGCGAGGAGAATTAAATCCG-3′, and inserted into a pET-21b based expression vector ahead of a thrombin cleavage site followed by a 6-His tag using NdeI and HindIII restriction sites. E. coli BL21(DE3) cells containing this vector were grown at 37 °C in Luria-Bertani media containing 100 μg/ml ampicillin to mid-log phase. Expression of PhoB D53A was induced by the addition of IPTG to a final concentration of 0.5 mM, and growth was continued for 3 h. The cells were harvested by centrifugation and lysed by sonication in 50 mM Tris, 100 mM NaCl, and 2 mM 2-mercaptoethanol at pH 7.5. The lysate was clarified by centrifugation (95,000 g) for 1 h and the supernatant was filtered with a 0.22-μm filter before loading onto a 5 ml Ni-HiTrap column. The proteins were eluted with a 100-ml gradient from 25 to 500 mM imidazole. Fractions containing PhoB D53A were pooled, concentrated, and loaded on a Superdex 75 26/60 (GE Healthcare) column preequilibrated with 50 mM Tris-HCl pH 7.5, 0.1 M NaCl, and 2 mM 2-mercaptoethanol. The purity of fractions containing PhoB D53A was assessed by Coomassie Blue staining subsequent to SDS-PAGE. Fractions of PhoB D53A >95% pure were pooled and 1 mM CaCl2 was added. Thrombin was then added to a final activity of 0.5 units/ml to remove the 6-His tag. Following an overnight incubation at room temperature the thrombin cleavage reaction was halted by addition of 1 mM phenylmethylsulphonyl fluoride and cleavage products were removed by filtration using 10,000 nominal molecular weight limit Millipore Amicon® Ultra centrifugal filter devices.
The concentrations of all proteins used in these experiments were calculated from their absorbance at 280 nm in 50 mM Tris pH 7.5, 100 mM NaCl using extinction coefficients calculated from the primary sequence of each protein. Unlabeled ammonium hydrogen phosphoramidate (PA) was synthesized as described previously [23]. [32P]ammonium hydrogen phosphoramidate ([32P]PA) was synthesized according to previously described methods [12, 24] to obtain a specific activity 46.5 Ci/mol. In vivo analyses were performed with E. coli BW25113 [25], which expresses wild-type PhoR, PhoB, and other protein components of the phosphate assimilation pathway (henceforth referred to as wild type), and JWK0389-1, a phoB deletion strain derived from BW25113 (henceforth referred to as ΔPhoB). Both strains were obtained from the Keio collection (National Biological Resource Project, Mishima, Japan) [26].
Measurement of phosphorylation induced changes in PhoB tryptophan fluorescence
All fluorescence experiments were conducted at 25 °C on a FluoroMax-3 spectrofluorometer (Horiba Jobin Yvon, Inc.; Edison, NJ) equipped with a circulating water bath for temperature control. For all fluorescence experiments, the excitation wavelength was set at 295 nm with the excitation slit width set at 1 nm. The emission was either set at 345 nm or monitored from 305–450 nm in 1-nm increments with a 2-s averaging time, with the slit width set at 1 nm. A quartz cell with a 1-cm path length in both the excitation and emission directions was used for all measurements. The emission profile of a 10-μM solution of PhoB in 50 mM Tris pH 7.5, 100 mM NaCl, 10 mM MgCl2 was recorded initially. Following the addition of PA to a final concentration of 20 mM, the emission at 345 nm was monitored for 1200 s in 3-s intervals with a 0.3-s averaging time. The emission spectrum from 305–450 nm was recorded again 1800 s after the addition of PA.
Fluorescence intensity values, I, corresponding to unphosphorylated PhoB (I0) and phospho-PhoB (If), respectively, were determined from the buffer and dilution corrected fluorescence intensities at 345 nm taken from the emission spectra of PhoB without PA and after 1800 sincubation with PA. The fraction of phosphorylated PhoB at time (t) was calculated as (It − I0)/(If − I0).
HPLC analysis of phosphorylated and unphosphorylated protein
HPLC analyses were performed as described previously [10, 24, 27], using a Hitachi D-7000 HPLC (San Jose, CA). Solutions of 10 μM protein in 50 mM Tris pH 7.5, 100 mM NaCl, 2 mM 2-mercaptoethanol, 10 mM MgCl2 with or without a 1-h incubation with 20 mM PA were prepared. 50-μl aliquots were injected onto a C-8 reverse-phase HPLC column (Grace-Vydac, Inc.) pre-equilibrated in 31.5% (v/v) acetonitrile (ACN), 0.1% (v/v) trifluoroacetic acid (TFA). Proteins were eluted using a 60-ml gradient from 31.5% (v/v) ACN, 0.1% (v/v) TFA, to 58.5% (v/v) ACN, 0.1% (v/v) TFA at a flow rate of 1 ml/min. Absorbance data were recorded at 210, 220, 260, and 280 nm. Areas under each elution peak at 210 nm from the absorbance versus elution time plots were calculated using HPLC-associated software.
SDS-PAGE and Phos-tag™ gel stain analysis of RR phosphorylation
SDS-PAGE was performed using standard protocols with minor modifications to prevent hydrolysis of phospho-Asp residues. Solutions of 10 μM protein in 50 mM Tris pH 7.5, 100 mM NaCl, 2 mM 2-mercaptoethanol, 10 mM MgCl2 with or without incubation with 20 mM PA were prepared. For experiments requiring autoradiography for imaging, solutions were incubated with 20 mM [32P]PA at a specific activity of 9.3 Ci/mol. To halt phosphorylation at specific times following initiation of incubation with PA, 18-μl aliquots of the reaction mixture were added to 4 μl of SDS loading buffer (4% (w/v) SDS, 40 mM Tris pH 6.3, 10% (v/v) glycerol) and 2 μl of 0.5 M EDTA. Quenched samples were left at room temperature for <30 min and were not heated prior to loading on gels to prevent hydrolysis of phospho-Asp. If left for longer periods of time prior to loading gels, storage on ice is recommended. Standards containing specific ratios of phosphorylated and unphosphorylated proteins were prepared by mixing appropriate volumes of solutions of known concentrations of unphosphorylated protein and phosphorylated protein (incubated with PA for >40 min) with SDS loading buffer and EDTA. In the final analyses, plotted values of [RR~P]/[RRtotal] were corrected for the level of phosphorylation in the phosphorylated protein standard as determined by HPLC analyses (95% for both PhoB and DrrD).
Protein samples were separated using 15% (w/v) acrylamide gels (37.5:1 acrylamide:N, N′-methylene-bis-acrylamide, 7 × 8 × 0.075 cm) and standard running buffer (0.4% (w/v) SDS, 25 mM Tris, 192 mM glycine) at 4 °C under constant voltage (150 V) using a mini-Protean II gel apparatus (Bio-Rad Laboratories). In gels containing [32P]PA the dye front was cut from the gel before analysis. Gels were analyzed using the supplied protocol for Phos-tag™ Phosphoprotein Gel Stain with the only modification being that all staining, washing, and destaining was performed at 4 °C to slow the rate of hydrolysis of the phospho-Asp residue. Phos-tag™ staining was visualized using a uv-transilluminator equipped with a cutoff filter and CCD camera. Pictures of gels were taken with exposure times ranging from 0.5 to 1.5 s to achieve best results. Following staining and visualizing with Phos-tag™ stain, gels were stained with Coomassie Blue and visualized on a fluorescent light box. Coomassie-stained gel images were captured using a CCD camera and a 1/30 s exposure time.
Phos-tag™ acrylamide gel analysis
Phos-tag™ acrylamide gels (7 × 8 × 0.075 cm) were prepared according to the instructions described by the manufacturer with minor modifications. Phos-tag™ acrylamide running gels contained 10% (w/v) 29:1 acrylamide:N, N′-methylene-bis-acrylamide, 375 mM Tris pH 8.8, 0.1% (w/v) SDS. Gels were copolymerized with either 75 μM Phos-tag™ acrylamide and 150 μM MnCl2 for analysis of purified proteins, or 25 μM Phos-tag™ acrylamide and 50 μM MnCl2 for analysis of PhoB from E. coli cell lysates. All stacking gels contained 4% (w/v) 29:1 acrylamide:N, N′-methylene-bis-acrylamide, 125 mM Tris pH 6.8, 0.1% (w/v) SDS. In all Phos-tag™ acrylamide experiments, phosphorylated and unphosphorylated purified PhoB and DrrD standards were prepared as described above for the Phos-tag™ gel stain experiments, with the only difference being that EDTA was not used in the gel loading buffer. All Phos-tag™ acrylamide containing gels were run at 4 °C under constant voltage (150 V). In experiments using unlabeled proteins, gels were run until 10 min after the dye front ran off the end of the gel. In experiments using [32P]PA, running of the gels was stopped before the dye front ran off the gel, and the dye front was cut from the gel before analysis.
Detection of PhoB phosphorylation in cell lysates
Both wild-type and ΔPhoB strains of E. coli were grown at 37 °C with shaking in MOPS media [28] supplemented with 40 μg/ml of each of the essential amino acids, 1 μg/ml each of thiamine, riboflavin, nicotinamide, and pyridoxine•HCl, and 0.4 % (w/v) glucose, and containing 5 mM K2HPO4, until cells reached mid log phase. Cells were then harvested by centrifugation and lysates were prepared from ΔPhoB cells as described below. Aliquots of wild-type cells were washed and resuspended in MOPS medium supplemented as above and containing either 0, 0.1, 0.2, 0.3, 0.4, 0.5, or 5.0 mM K2HPO4. After 2 h of growth in this medium, cells were pelleted by centrifugation. Immediately following harvesting, cells were lysed with 33 μl of 1 M formic acid per equivalent of pellet of 1 ml of 0.15 OD595 of cells. Trituration and 30 s of vigorous vortexing were required to ensure complete lysis of the pellets. Each lysate was solubilized by addition of 13 μl SDS loading buffer and subsequently neutralized to pH 6.0 by addition of 6 μl 5 N NaOH. Standards with different fractions of [PhoB~P]/[PhoBtotal] were prepared by adding known amounts of unphosphorylated PhoB and PhoB phosphorylated with PA to lysates of ΔPhoB cells. Samples were stored on ice for a short time (<10 min) prior to loading onto Phos-tag™ acrylamide gels. Samples and standards were run at 4 °C and a constant 150 V on a single 25 μM Phos-tag™ acrylamide gel, prepared as described in the previous section, until the dye front ran off the end of the gel.
Gels were fixed for 10 min in standard transfer buffer, 20% (v/v) methanol, 50 mM Tris, 40 mM glycine, with 1 mM EDTA added to remove Mn2+ from the gel. Gels were incubated for an additional 20 min in transfer buffer without EDTA to remove the chelated metal. Transfer to nitrocellulose membranes was performed using a Bio-Rad semidry transfer apparatus under a constant 110 mA for 70 min. Western blotting was performed using standard protocols with rabbit anti-PhoB primary antibody and anti-rabbit secondary antibody coupled to horseradish peroxidase. Blots were imaged by chemiluminescent detection (SuperSignal West Pico Chemiluminescent Substrate, Pierce Biotechnology, Inc., Rockford, IL.)
Results and discussion
Monitoring phosphorylation of PhoB by the small molecule phosphodonor, phosphoramidate
Small molecule phosphoryl group donors, such as acetylphosphate, carbamylphosphate, and phosphoramidate (PA), have been widely employed for in vitro characterization of response regulator phosphorylation and for generation of the active (phosphorylated) state of these signaling proteins [8]. Acetylphosphate has been shown to be an important secondary signal for the activation of the RR PhoB in vivo [29, 30]. However, PA has been shown to be a more efficient phosphodonor than acetylphosphate in vitro [8, 31–34] and therefore, we utilized PA as a phosphorylating agent to characterize the phosphorylation of PhoB and other RR proteins.
PhoB contains three tryptophan residues, one in the C-terminal DNA-binding domain and two in the N-terminal regulatory domain. The presence of these tryptophans yields a distinct emission spectrum for a solution of PhoB upon excitation with uv light, as depicted in Fig. 1a. Following incubation with PA, the emission intensity of PhoB significantly decreases, and after ~10 min the fluorescence reaches a new steady-state intensity at which the rate of phosphorylation equals that of dephosphorylation (Figs. 1a and 1b). These findings are similar to those previously reported for the phosphorylation of PhoB using acetylphosphate as a phosphodonor, but with a faster rate of phosphorylation [9].
Fig. 1.

Phosphorylation induced changes in fluorescence and reverse phase HLPC analysis of PhoB phosphorylation. (a) Buffer and dilution corrected fluorescence emission spectra of untreated PhoB (solid line) or PhoB following 1800-s incubation with PA (dashed line). (b) Time dependence of PhoB emission intensity at 345 nm following addition of PA. (c) HPLC chromatograms of untreated PhoB (solid line) and PhoB following 1-h incubation with PA (dashed line).
Monitoring the fluorescence decrease due to phosphorylation of PhoB is a useful tool for observing the presence of phospho-PhoB (PhoB~P) and the rate at which PhoB is converted to PhoB~P, but it yields little information regarding the extent of PhoB phosphorylation. Reverse phase HPLC was used to quantify the extent of PhoB phosphorylation. In the absence of PA, PhoB elutes as a single peak with a retention time of 31.6 min (Fig. 1c). When PhoB is analyzed after incubation with PA for 90 min, a major peak with a retention time of 31.1 min and a shoulder with a maximum at 31.6 min are observed. The similar retention times of the shoulder observed following incubation with PA and the only peak observed in the untreated PhoB sample indicate that a peak with this elution time (31.6 min) corresponds to unphosphorylated PhoB. The earlier eluting peak, observed in the presence of PA, must thus correspond to PhoB~P. The areas under each peak can be used to quantify the extent of phosphorylation of PhoB ([PhoB~P]/[PhoBtotal]). For the experiment depicted in Fig. 1c, 95% of the total protein elutes in the earlier peak (PhoB~P) following incubation with PA. This percentage is consistent over multiple experiments with values ranging from 93 to 97% (data not shown).
By combining the two techniques, fluorescence and reverse phase HPLC, both the extent and rate of phosphorylation of PhoB can be characterized. However, these techniques are limited in their applicability to other RR proteins, even when purified proteins are available. The monitoring of phosphorylation by fluorescence perturbation requires that a RR contain a tryptophan with an emission profile that is significantly altered upon phosphorylation. Unlike PhoB, many RR proteins do not have an appropriately positioned tryptophan residue and thus are not amenable to this method of analysis.
Although the use of reverse phase HPLC to monitor phosphorylation is not as strictly limited in its applicability as is the use of fluorescence, it is nonetheless a non-universal technique. For reverse phase HPLC to separate a phosphorylated protein from an unphosphorylated protein, the phosphorylation modification must induce a change in the solvent accessible surface of the protein, enabling it to interact differently with the HPLC column media and organic solvent than the unmodified protein. Although a phosphorylation-induced differential interaction with the HPLC column is common for many RR proteins, it is not the case for all.
A technique not influenced by the potential pitfalls described above would be an extremely useful tool for the study of RR phosphorylation. Phos-tag™, a commercially available phosphomonoester-binding substrate, may prove to fulfill this need. It should not be limited in its applicability due to the amino acid sequence and structural constraints noted for the fluorescence and HPLC techniques listed above. In the following sections, a novel technique for the characterization of RR phosphorylation is described, using Phos-tag™ to quantify the extent of protein phosphorylation.
Phos-tag™ gel stain characterization of RR phosphorylation
The fluorescence and HPLC experiments indicate that PhoB becomes nearly completely phosphorylated by PA over approximately 10 min. The time scale of this phosphorylation reaction and its ability to proceed to near completion make it a good system with which to test the functionality of Phos-tag™ gel stain for characterizing phosphorylation of RRs. To test the applicability of Phos-tag™ gel stain for monitoring the phosphorylation of PhoB we prepared solutions of radiolabeled PhoB~P by incubating a 10 μM PhoB solution with 20 mM [32P]PA in the presence of 10 mM MgCl2. Following a 1-h incubation, the reaction was quenched by addition of SDS loading buffer and EDTA. Samples of [32P]PhoB~P were loaded and run on an SDS-PAGE gel after mixing with unlabeled, unphosphorylated PhoB in ratios of either 1, 0.75, 0.50, 0.25, or 0 to obtain known values of [PhoB~P]/[PhoBtotal]with a constant amount of PhoB (3.3 μg) loaded onto each lane. The Phos-tag™ stained gel is depicted in Fig. 2a. Note that the staining intensity of the bands in the gel diminishes as the fraction of phosphorylated PhoB decreases, indicating that Phos-tag™ is staining the phosphorylated form of the protein.
Fig. 2.
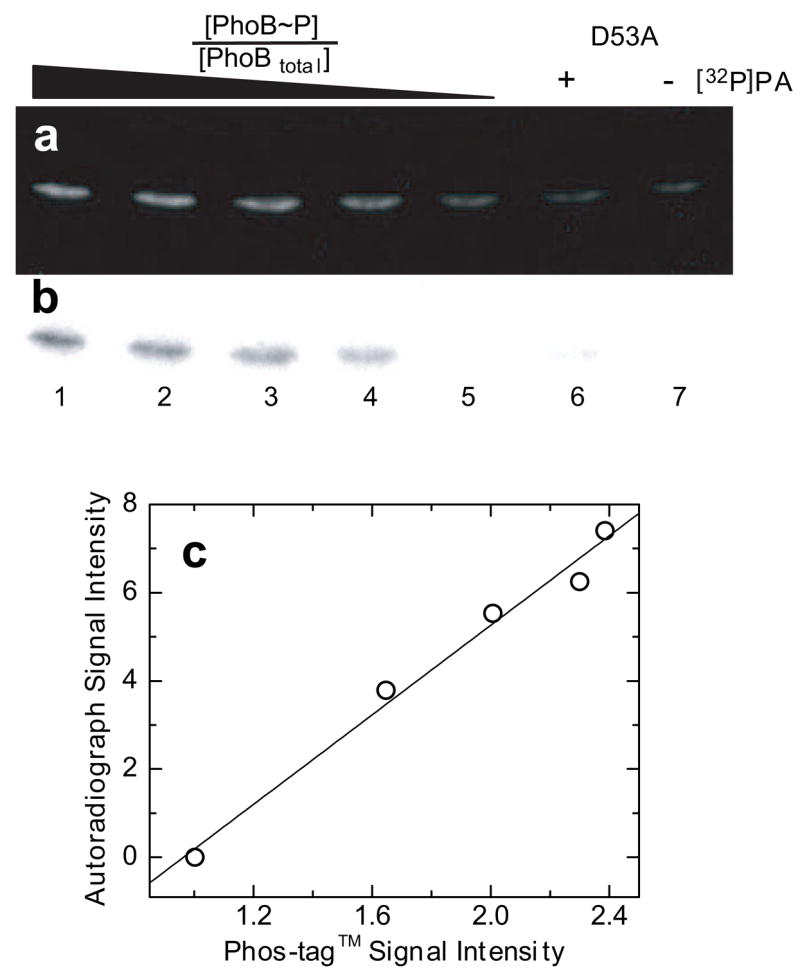
Comparison of Phos-tag™ Phosphoprotein Gel Stain and autoradiography. (a) Phos-tag™ (300/460) stained gel imaged using a uv-transilluminator, uv/vis cut-off filter, and CCD camera with 0.5-s exposure. (b) Image of the same gel obtained using autoradiography. All lanes were loaded with 3.3 μg PhoBtotal. Lanes 1–5 contained known fractions of 1, 0.75, 0.50, 0.25, and 0 [32P]phosphorylated PhoB ([PhoB~P]/[PhoBtotal]), respectively. Lanes 6 and 7 contained 3.3 μg PhoB D53A either following a 1-h treatment with [32P]PA or untreated, respectively. (c) Plot of autoradiograph signal intensity versus Phos-tag™ staining intensity. Solid line represents the linear regression analysis of the data.
To ensure that Phos-tag™ is selectively staining the phosphorylated form of PhoB and that PhoB is not phosphorylated at a site other than the predicted site of phosphorylation at Asp-53, a PhoB mutant protein was constructed with the Asp residue at position 53 substituted by an Ala residue (PhoB D53A). Lanes 6 and 7 of the gel depicted in Fig. 2 were loaded with 3.3 μg of either PhoB D53A following a 1-h incubation with [32P]PA or untreated PhoB D53A, respectively. Both lanes 6 and 7 show similar weak Phos-tag™ staining, indicating that the D53A substitution in PhoB essentially eliminates phosphorylation of this protein. This suggests that the conserved Asp residue at position 53 in PhoB is the major site of phosphorylation by the small molecule phospho-donor PA.
Phosphorylation by radiolabeled PA enables detection not only by Phos-tag™ gel stain but also by autoradiography. Following Phos-tag™ staining an autoradiograph was made by exposing the wet gel to a phosphorimage plate. Although acidic conditions, such as those required for fixing the gel for Phos-tag™ staining, have been shown to increase the rate of hydrolysis of acylphosphate moieties [7], in the context of a denatured protein the phospho-Asp residue has been shown to be unaffected or even slightly stabilized by these moderately acidic conditions [35]. In the case of PhoB, the phospho-Asp residue remains significantly phosphorylated throughout the Phos-tag™ staining process. The autoradiograph shows darkly shadowed bands in lanes that contain [32P]PA-treated PhoB (lanes 1–4) and a lightly shadowed band in the lane containing [32P]PA-treated PhoB D53A (lane 6). The lightly shadowed band in lane 6 has 98% less intensity than the band in lane 1. The minor amount of phosphorylated protein in lane 6 is likely due to nonspecific phosphorylation of one or more of the seven His residues in the PhoB D53A protein. Low levels of nonspecific phosphorylation of His residues in response regulators and other control proteins following long exposures to [32P]PA has been reported previously and has been shown to vary with amino acid composition and conditions of the phosphorylation reaction [12].
Fig. 2c shows a plot of Phos-tag™ staining intensity versus signal intensity from the autoradiograph of the gel depicted in Figs. 2a and 2b. The linearity of this plot (R2 = 0.98) strongly suggests that Phos-tag™ staining intensity directly correlates with the extent of PhoB phosphorylation. This direct correlation between Phos-tag™ staining intensity and extent of response regulator phosphorylation enables Phos-tag™ to be used quantitatively to monitor changes in response regulator phosphorylation.
Having established that Phos-tag™ staining can be used to detect phosphorylation of Asp residues in PhoB, with a negligible contribution from non-specific phosphorylation, we used it to examine phosphorylation kinetics. Fig. 3a shows an SDS-PAGE gel stained with Phos-tag™ gel stain and imaged using a uv-transilluminator and a CCD camera. Each lane contains 3.3 μg of total purified PhoB protein (PhoBtotal). Lanes 1–5 contain either unmodified PhoB, PhoB~P, or mixtures of both. The remaining samples (lanes 6–13) contain aliquots from a time course of PhoB phosphorylation with PA. As demonstrated above, the intensity of the Phos-Tag™-stained bands increases as the fraction of PhoB~P ([PhoB~P]/[PhoBtotal]) is increased in the standards (lanes 1–5) and a similar trend is seen as time is increased during the phosphorylation time course (lanes 6–13). Note that there is a signal from the Phos-tag™ stain even in lane 5, in which no PhoB~P is present. This is likely due to non-specific interactions of Phos-tag™ gel stain with protein-associated SDS that is not completely removed during the destaining process, and consequently, varies slightly in different gels.
Fig. 3.
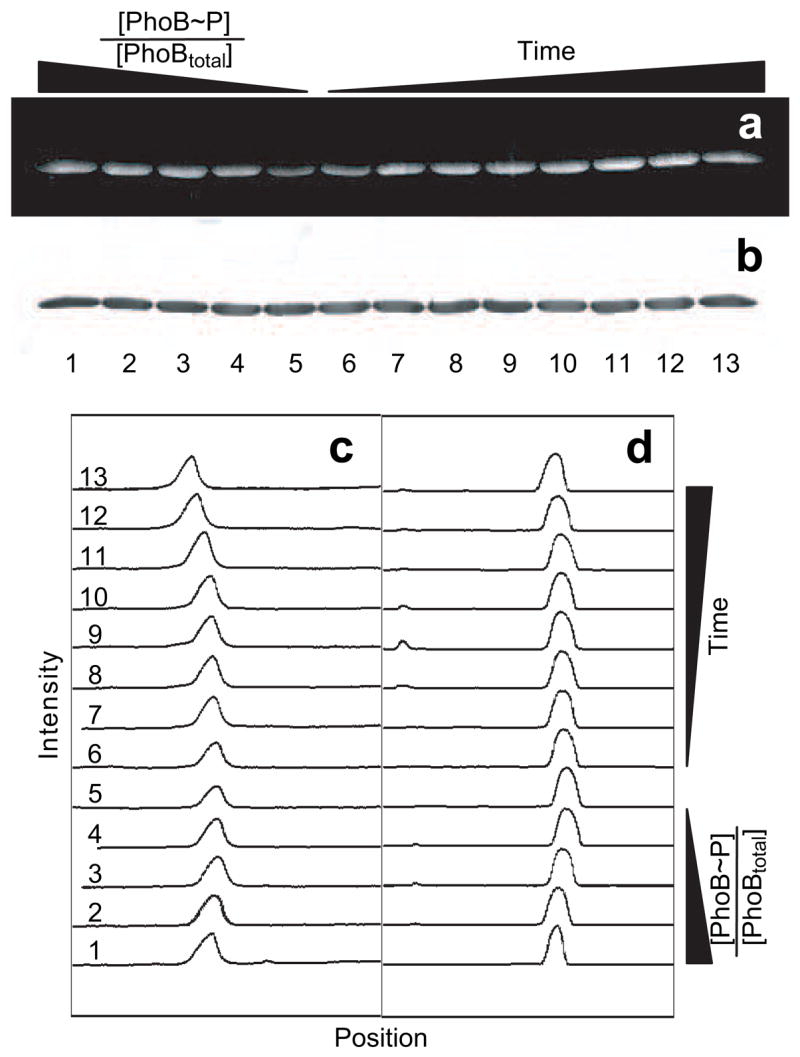
Monitoring of PhoB phosphorylation by phosphoramidate using Phos-tag™ Phosphoprotein Gel Stain. (a) Phos-tag™ (300/460) stained gel imaged using a uv-transilluminator, uv/vis cut-off filter, and CCD camera with 1-s exposure. (b) Image of the same gel stained with Coomassie Blue. All lanes were loaded with 3.3 μg PhoBtotal. Lanes 1–5 contained known fractions of 1, 0.75, 0.50, 0.25, and 0 phosphorylated PhoB ([PhoB~P]/[PhoBtotal]), respectively. Lanes 6–13 contained PhoB either 15, 30, 45, 60, 120, 300, 600, or 1200 s after exposure to 20 mM PA, respectively. (c and d) Plots of band intensity versus vertical position in the lane for the Phos-tag™ stained (c) and the Coomassie Blue stained gel (d). Numbers at the left correspond to lanes of the gel.
An image of the same gel stained with Coomassie Blue is shown in Fig. 3b. Note that the intensity of staining and position of the bands corresponding to PhoB are essentially identical in all lanes. This indicates that similar amounts of PhoBtotal were loaded into each well and that the Coomassie staining and protein migration were not noticeably influenced by phosphorylation.
To quantify the extent of phosphorylation of PhoB, the intensities of the bands in the photographs of the Phos-tag™-stained and Coomassie-stained gels were determined. Each gel lane was selected and plots of signal intensity versus vertical position on the gel were generated (Figs. 3c and 3d) using ImageJ software (NIH). The intensity of staining was calculated from the area under each histogram peak after selection of an appropriate baseline. To normalize for non-specific background staining by Phos-tag™, the Phos-tag™ staining intensity of each band was divided by the corresponding Coomassie-staining band intensity, since the Coomassie staining should be directly related to protein concentration. This correction also compensates for errors associated with gel loading.
A standard curve can be generated from the Coomassie-normalized Phos-tag™ signal intensities and the known faction of PhoB~P ([PhoB~P]/[PhoBtotal]) in standards loaded on a single gel. A plot of signal intensity versus loaded [PhoB~P]/[PhoBtotal] derived from lanes 1–5 of the gel depicted in Fig. 3 is shown in the upper left panel in Fig. 4a. This plot and the similar ones derived from replicate experiments (additional plots in Fig. 4a) demonstrate that signal intensity is directly correlated with the amount of PhoB~P. Although the general trend remains consistent, the relationship between normalized signal intensities and loaded [PhoB~P]/[PhoBtotal] varies significantly in different gels. This inconsistency might be due to variations in gel staining/destaining or in non-enzymatic hydrolysis of the phospho-Asp residue. Such effects on the observed Phos-tag™ signal intensity are likely to be consistent throughout an individual gel, but not between gels. To minimize the effect of this variation, an internal standard curve derived from standards analyzed on a single gel along with experimental samples was generated for each experiment. The best-fit linear trend line for plots of internal standard curves (Phos-tag™ signal intensity versus loaded [PhoB~P]/[PhoBtotal]) were used to calculate the fraction of PhoB~P in experimental samples.
Fig. 4.
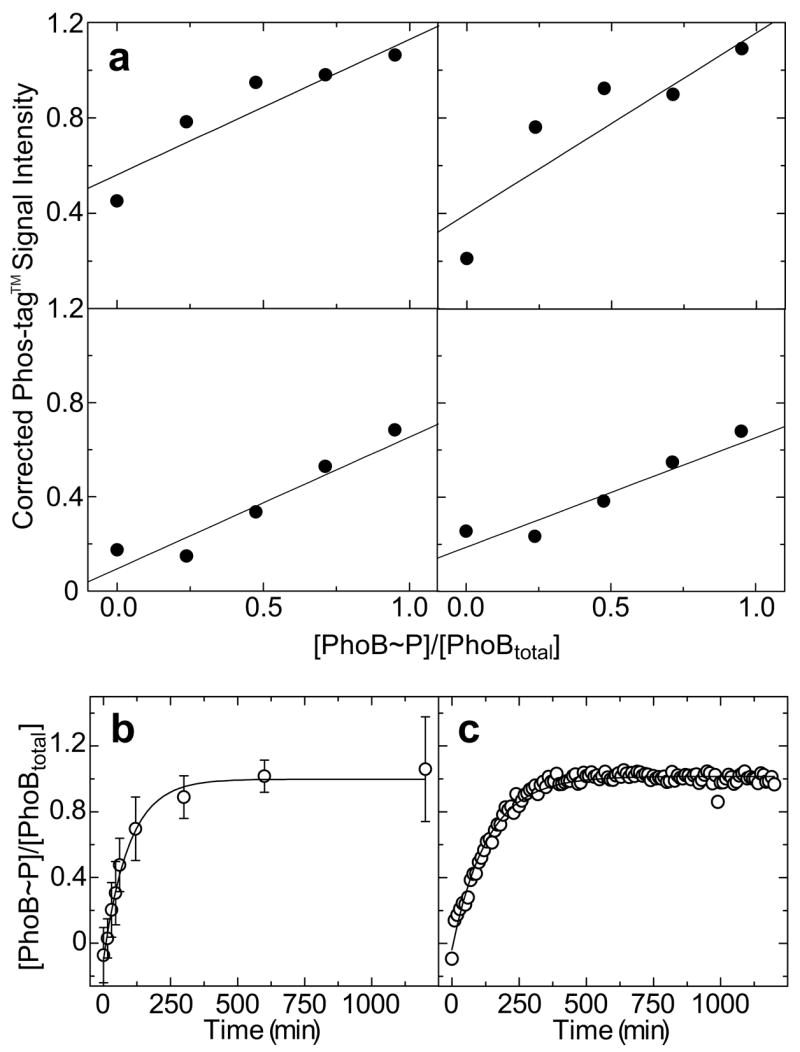
Phosphorylation of PhoB by phosphoramidate. (a) Replicate standard curves relating Coomassie-corrected Phos-tag™ signal intensities to known [PhoB~P]/[PhoBtotal] values of standards loaded onto gels in 4 independent experiments. The best fit linear trend line for each set of points is indicated. The upper left panel corresponds to the gel depicted in Fig. 3. (b) Time course of PhoB phosphorylation by PA as measured by Phos-tag™ gel stain. Each point represents the average of 4 measurements of Coomassie-corrected Phos-tag™ signal intensities from 4 independent experiments and correlated to fractional PhoB phosphorylation ([PhoB~P]/[PhoBtotal]) using individual internal standard curves depicted in panel a. Error bars indicate standard deviations from the mean. (c) Time course of PhoB phosphorylation by PA as measured by fluorescence emission intensity at 345 nm. Values of [PhoB~P]/[PhoBtotal] were calculated as described in Materials and methods using the buffer subtracted and dilution corrected fluorescence emission data depicted in Figs. 1a and 1b. The best fit first order exponential decay trend lines for data in panels c and d are shown as solid lines.
A plot of [PhoB~P]/[PhoBtotal], characterized by Phos-tag™ gel stain, versus time of PhoB incubation with PA is depicted in Fig 4b. Note that the reaction proceeds to near completion after approximately 10 min and that the data can be fit well with a first order exponential curve (solid line in Fig. 4b), which is expected for this type of reaction. A plot of [PhoB~P]/[PhoBtotal], derived from intrinsic tryptophan fluorescence, versus time of PhoB incubation with PA is depicted in Fig. 4c. This plot (Fig. 4c) and the Phos-tag™ derived curve (Fig. 4b) are remarkably similar. The parameters that define the best-fit exponential trend lines in each curve are nearly identical, with a deviation of less than 10%. This comparison of techniques demonstrates the usefulness of Phos-tag™ gel stain for characterizing the phosphorylation of PhoB. The results presented in this section clearly demonstrate that Phos-tag™ gel stain can be applied to the study of phospho-Asp containing proteins and, with appropriate controls, a quantitative determination of the extent of response regulator phosphorylation can be made.
Phos-tag™ acrylamide SDS-PAGE separation of phosphorylated and unphosphorylated RR proteins
Following the successful implementation of Phos-tag™ gel stain for monitoring the rate of RR phosphorylation by PA, we tested an additional Phos-tag™-based product, Phos-tag™ acrylamide, for analyzing RR phosphorylation. Phos-tag™ acrylamide is generally used as a copolymer in the preparation of an acrylamide gel [15, 19–21]. The addition of this co-polymer and its associated divalent cation, Mn2+, allows for separation of proteins not only by charge, shape, and size, but also by the presence of phosphorylated residues, which, when present, retard protein migration on the gel. The gel pictured in Fig. 5a shows an analysis of mixtures of unphosphorylated and phosphorylated forms of PhoB on a 10% (v/v) 29:1 acrylamide: N, N′-methylene-bis-acrylamide gel containing 75 μM Phos-tag™ acrylamide and 150 μM Mn2+ and stained with Coomassie Blue. Each lane in this gel contains a total of 3.3 μg of protein with different known ratios of PhoB phosphorylated using [32P]PA and unphosphorylated PhoB. As the fraction [PhoB~P]/[PhoBtotal] is increased, more of the protein appears in the upper band. Yet, even when ≥95% of the protein is phosphorylated in the sample prepared for loading on the gel, a significant fraction of the protein is observed in the lower band (lane 1). This discrepancy might be due to hydrolysis of the acyl phosphate bond occurring prior to, or during, the running of the gel. Hydrolysis of phospho-Asp might be expected to be greater during the Phos-tag™ acrylamide analysis than in the Phos-tag™ gel stain or HPLC analyses due to the fact that the chelator EDTA cannot be used to quench divalent cation-catalyzed phosphorylation and dephosphorylation, and that Mn2+ must be present during electrophoresis as it is essential for the interaction of Phos-tag™ with phosphate monoesters. Additionally, greater losses of phosphorylated protein are observed when higher concentrations of Phos-tag™ acrylamide are incorporated into the gels (data not shown). This finding is potentially explained by the increased time required for running gels with higher concentrations of Phos-tag™ acrylamide. It is also conceivable that interaction of Phos-tag™ with phospho-Asp makes the phosphate a better leaving group, therefore accelerating hydrolysis during electrophoresis.
Fig. 5.
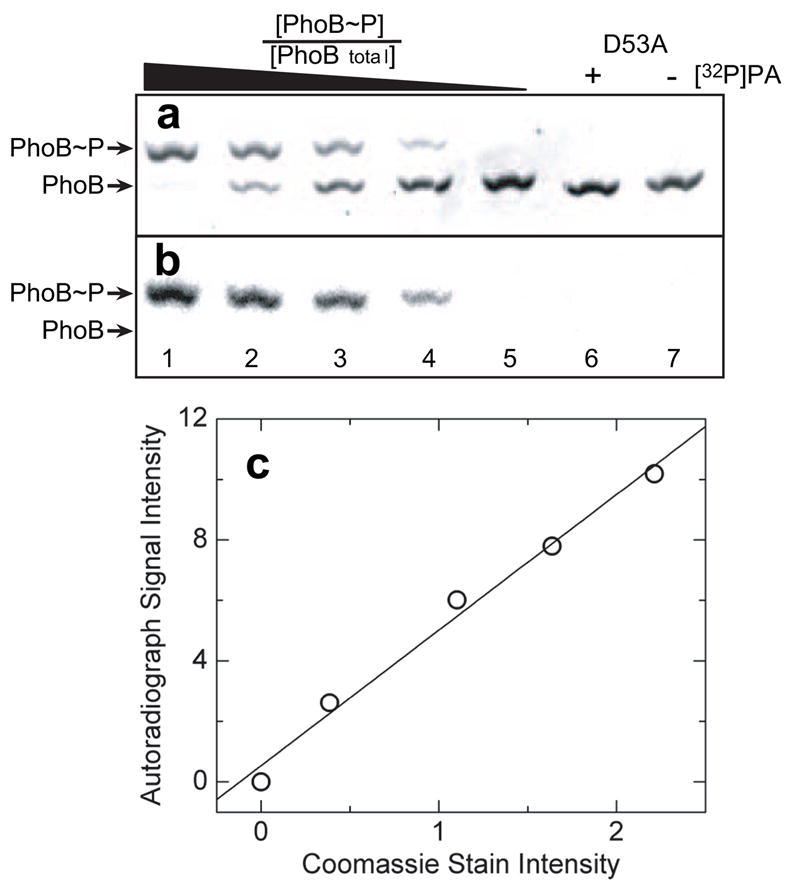
Phos-tag™ acrylamide gel electrophoresis separation of phosphorylated and unphosphorylated PhoB. (a) Coomassie Blue stained image of PhoB standards with known [PhoB~P]/[PhoBtotal] ratios separated on a 75-μM Phos-tag™ acrylamide gel. (b) Image of the same gel by autoradiography using a Phosphorimager. All lanes were loaded with 3.3 μg PhoBtotal. Lanes 1–5 contained known fractions of 1, 0.75, 0.50, 0.25, and 0 [32P]phosphorylated PhoB ([PhoB~P]/[PhoBtotal]), respectively. Lanes 6 and 7 contained 3.3 μg PhoB D53A either following a 1-h treatment with [32P]PA or untreated, respectively. (c) Plot of autoradiograph signal intensity versus Coomassie staining intensity. Solid line represents the linear regression analysis of the data.
The gel described above was analyzed using autoradiography prior to its staining with Coomassie Blue. This autoradiograph is depicted in Fig. 5b. Note that there is only one band visible in each lane containing PhoB~P (lanes 1–4), and that the position of this band corresponds to the more slowly migrating band in the Coomassie-stained gel. The presence of the radiolabel only in the more slowly migrating band indicates that the Phos-tag™ acrylamide gel completely separates PhoB~P from unphosphorylated PhoB. A plot of the intensity of Coomassie Blue staining of the slowly migrating bands versus intensity of signal from the autoradiograph for the gel depicted in Figs. 5a and 5b is shown in Fig. 5c. The linearity (R2 = 0.99) of this plot demonstrates that the intensity of Coomassie staining of the slowly migrating band in the gel directly correlates with the amount of phosphorylated protein loaded on the gel.
Fig. 6a shows an analysis of mixtures of unphosphorylated and phosphorylated forms of two RR proteins, DrrD (lanes 1–4) and PhoB (lanes 5–8), on a 10% (w/v) 29:1 acrylamide: N, N′-methylene-bis-acrylamide gel containing 75 μM Phos-tag™ acrylamide and 150 μM Mn2+ and stained with Coomassie Blue. Like PhoB, the related RR protein, DrrD, has been shown to undergo nearly complete (≥95%) phosphorylation upon incubation with Mg2+ and PA (data not shown). Each lane in this gel contains a total of 3.3 μg of protein with different known ratios of phosphorylated and unphosphorylated forms. As the fraction [RR~P]/[RRtotal] is increased, more of the protein appears in the upper band.
Fig. 6.
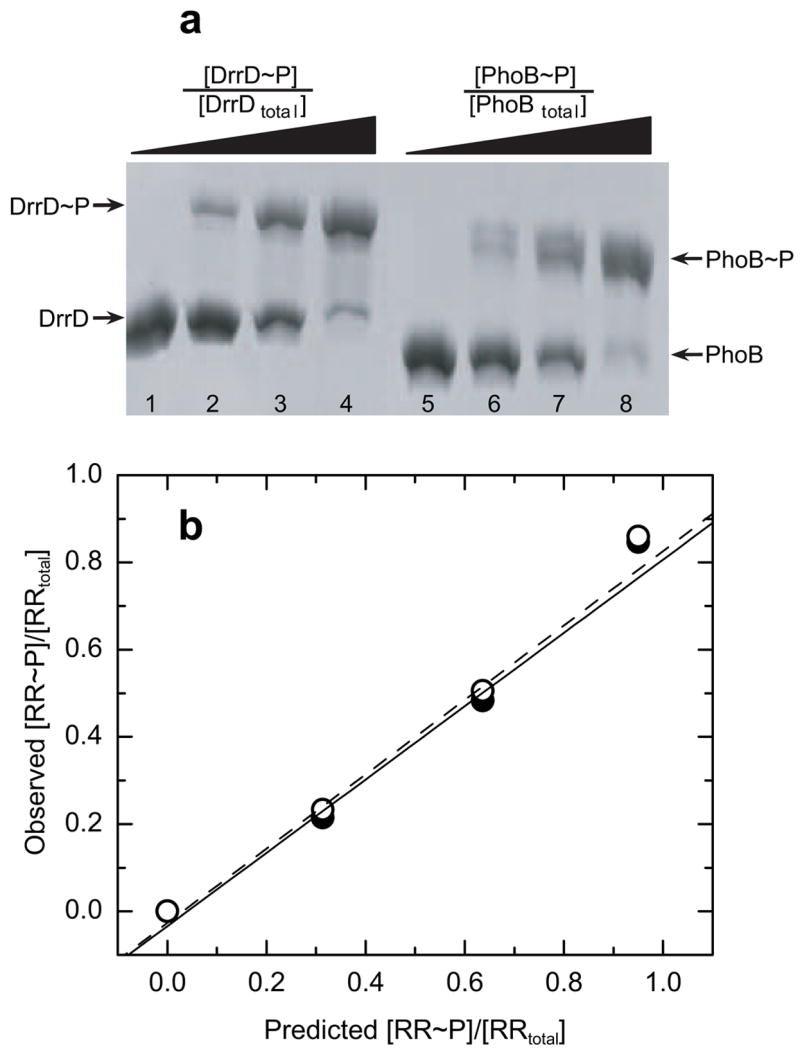
Extent of RR phosphorylation monitored using a 75-μM Phos-tag™ acrylamide gel. (a) Analysis of DrrD and PhoB standards with known [RR~P]/[RRtotal] ratios. Each lane contains 3.3 μg of either DrrD (lanes 1–4) or PhoB (lanes 5–8), with known fractions of phosphorylated RR ([RR~P]/[RRtotal]) of 0, 0.33, 0.67, and 1.0, for lanes 1–4 and 5–8, respectively. (b) Plots of the observed fraction [RR~P]/[RRtotal] versus the loaded fraction [RR~P]/[RRtotal] for DrrD (open circles) and PhoB (solid circles). Values were calculated as described in the text. The best fit linear trend line is indicated for DrrD (dashed line) and PhoB (solid line).
In each lane of this gel the intensities of the upper (phosphorylated) and lower (unphosphorylated) bands were determined from digital images using ImageJ analysis software as described above. The observed fraction of [RR~P]/[RRtotal] was calculated by dividing the intensity of the upper band by the total signal intensity from both bands in the lane. Fig. 6b shows plots of observed [RR~P]/[RRtotal] versus loaded [RR~P]/[RRtotal] for both PhoB (solid circles) and DrrD (open circles). Both the PhoB and DrrD plots are linear, indicating that values of observed [RR~P]/[RRtotal] are directly correlated with [RR~P]/[RRtotal] loaded on the gel. Although the observed [RR~P]/[RRtotal] ratios are significantly less than the [RR~P]/[RRtotal] ratios in the prepared standard samples, due to hydrolysis of phospho-Asp, the strong correlation between these values (R2 = 0.99) enables the use of standard curves to accurately calculate the actual [RR~P]/[RRtotal] ratio present in an initial sample. Furthermore both the PhoB and DrrD plots are nearly identical, with each point representing the phosphorylated fraction of one protein nearly overlapping the corresponding point for the other protein. This finding strongly suggests that a standard curve prepared from one RR with known phosphorylation levels can be used to accurately calculate the extent of phosphorylation of a different RR protein run on the same gel, as might be expected, due to the similar stability of the phospho-Asp residue in the context of a denatured protein.
Characterization of in vivo RR phosphorylation using Phos-tag™ acrylamide and western blotting
The ability of Phos-tag™ acrylamide SDS-PAGE to separate phosphorylated and unphosphorylated forms of a protein without modification of the protein allows subsequent use of any traditional technique for protein detection. We coupled Phos-tag™ acrylamide SDS-PAGE of E. coli cell lysates with western blotting and chemiluminescent detection to observe the phosphorylated state of PhoB as it exists in vivo under different growth conditions. PhoB is a RR transcription factor that functions within the PhoR/PhoB two-component system to control expression of genes involved in phosphate assimilation in response to availability of environmental phosphate (for reviews see [36–38]). The phosphorylation state of PhoB, and consequently its transcriptional regulation activity, are controlled by the relative autophosphorylation and PhoB~P phosphatase activities of the sensor histidine kinase PhoR, which is regulated by extracellular phosphate concentrations. Under phosphate replete conditions, levels of PhoB phosphorylation are low. Under conditions of limiting phosphate, PhoB is phosphorylated, enhancing its DNA-binding activity and promoting transcriptional activation of ~40 genes that constitute the Pho regulon. Notably, phoB is part of the Pho regulon, and this autoregulation results in elevated levels of PhoB protein upon phosphate starvation. Phos-tag™ acrylamide SDS-PAGE separation coupled with immunoblot detection allows the simultaneous monitoring of levels of both PhoB protein and PhoB phosphorylation.
For these studies, E. coli cells were grown in media containing different concentrations of potassium phosphate as described in Materials and methods. Sample preparation was designed to preserve the labile phospho-Asp modification. Our preliminary studies on purified phospho-Asp containing proteins indicate that lysis methods which involve sample heating promote extensive hydrolysis of phospho-Asp residues. Less than 30 s of heating samples in a 90 °C heat block caused essentially complete loss of phospho-Asp containing protein, while sonication of samples immersed in an ice bath, caused a >40% decrease in phospho-Asp compared to unsonicated controls. The mild formic acid treatment used to lyse E. coli cells in these studies caused no detectable loss of phospho-Asp from PhoB~P compared to an untreated PhoB~P sample (data not shown). For subsequent studies, cells were harvested by centrifugation, rapidly lysed with formic acid, solubilized by addition of SDS loading buffer, and neutralized to pH 6.0. Lysates from an E. coli phoB deletion strain (ΔPhoB) were prepared in parallel and known quantities of purified unphosphorylated and phosphorylated PhoB, generated by incubation with PA, were added to create well-matched standards with defined ratios of unphosphorylated and phosphorylated protein. Experimental samples and standards were electrophoresed on a single 10% (w/v) 29:1 acrylamide: N, N′-methylene-bis-acrylamide gel containing 25 μM Phos-tag™ acrylamide and 50 μM Mn2+, transferred onto a nitrocellulose membrane, and imaged with anti-PhoB polyclonal antibody and a chemiluminescent reagent.
Lanes 8–12 of the western blot depicted in Fig. 7a correspond to standards, consisting of lysates from a ΔPhoB strain combined with 5 ng purified PhoBtotal with increasing fractions of PhoB~P. Two major bands are present in each lane, except lane 12, which contains only the faster migrating band. The upper, slower migrating band corresponds to PhoB~P, while the lower band corresponds to unphosphorylated PhoB. Neither of these bands is observed in a ΔPhoB strain lysate without added PhoB (data not shown). As in the Phos-tag™ acrylamide gel analysis of purified PhoB protein (Figs. 5a and 6a), a significant band is seen at the lower position, corresponding to unphosphorylated protein, even for the standard prepared with ≥95% PhoB~P (lane 8). As before, this apparent hydrolysis that occurs prior to and/or during the running of the gel can be corrected by scaling to a standard curve (Fig. 7b).
Fig. 7.
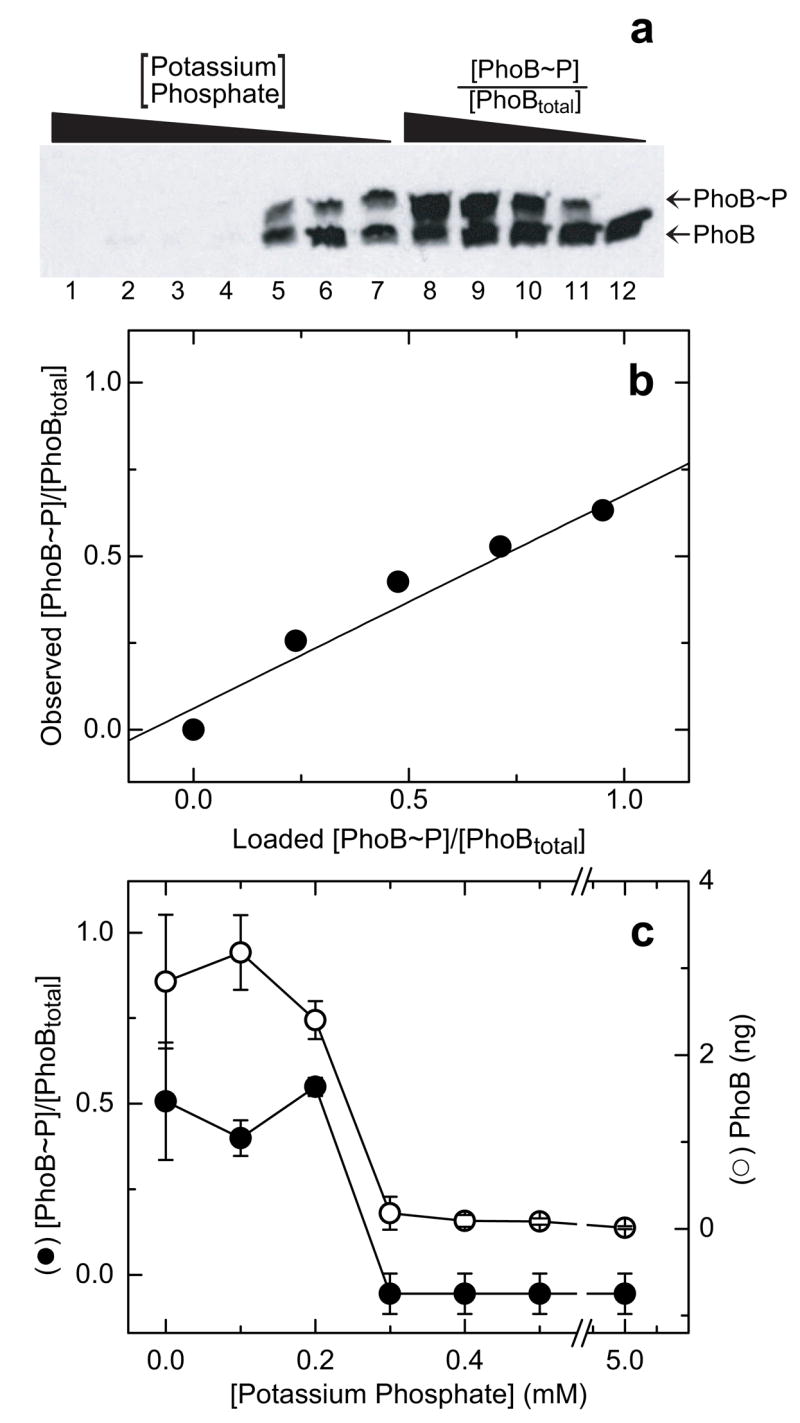
Phosphorylation of PhoB in vivo. (a) Western blot of E. coli lysates analyzed on a 25-μM Phos-tag™ acrylamide gel. Lanes 1–7 contain lysates of wild-type E. coli grown under different levels of induction of the PhoR/PhoB phosphate assimilation pathway, corresponding to 5.0, 0.5, 0.4, 0.3, 0.2, 0.1, and 0 mM potassium phosphate in the growth media, respectively. Lanes 8–12 contain standards of 5 ng of PhoBtotal with known fractions of phosphorylated PhoB ([PhoB~P]/[PhoBtotal]) of 1, 0.75. 0.5, 0.25, and 0, respectively, added to lysates of ΔPhoB cells. (b) Plot of the observed fraction [PhoB~P]/[PhoBtotal] versus the fraction [PhoB~P]/[PhoBtotal] in the standards loaded in lanes 8–12 of the gel shown in panel a. Values were calculated as described in the text. The best fit linear trend line is indicated. (c) Effect of media phosphate concentration on levels of PhoB phosphorylation (solid circles) and PhoB protein (open circles). Each [PhoB~P]/[PhoBtotal] was calculated as described in the text and corrected using individual internal standard curves. The amount of PhoB in each sample was calculated from the sum of the intensities of both bands in each lane, corresponding to PhoBtotal, and scaled to ng assuming a linear relationship between intensity and ng, with an average value defined by the standards. Each point represents the average of two independent experiments derived from western blots similar to that in panel a. Error bars indicate the standard deviation from the mean.
The remaining lanes of the western blot correspond to lysates of wild-type E. coli cells grown in media containing different concentrations of potassium phosphate. Lysates of cells grown in phosphate replete media (≥0.3 mM phosphate, lanes 1–4) exhibit only one faint band on the gel, corresponding to unphosphorylated PhoB, while lysates of cells grown in phosphate-limiting media (≤0.2 mM phosphate, lanes 5–7) exhibit two bands, corresponding to both unphosphorylated PhoB and PhoB~P. The intensities of each band were calculated as previously described and the observed values of [PhoB~P]/[PhoBtotal] were correlated with the actual fraction of [PhoB~P]/[PhoBtotal] using the linear relationship calculated from the standard curve (Fig. 7b).
It is also apparent from the western blot that the level of PhoB protein increases in cells grown under phosphate-limiting conditions. The sum of intensities in the upper and lower bands (PhoBtotal) can be used to quantify this effect, and absolute values can be obtained by scaling to the intensities of the standards. However, as bands are always significantly distorted in Phos-tag™ acrylamide gels, more accurate estimates of protein concentration can be obtained from the sharper bands in conventional SDS-PAGE gels. When such analyses are required, duplicate experimental samples are run in parallel on both Phos-tag™ acrylamide and conventional acrylamide gels, and standards that cover a range of pure protein concentrations in a deletion strain lysate are run on the conventional acrylamide gel to allow more accurate estimations of protein concentrations and to confirm linearity of the chemiluminescent detection assay.
Plots of the corrected fraction [PhoB~P]/[PhoBtotal] and PhoBtotal versus the concentration of potassium phosphate in the media are shown in Fig. 7c. Note that when the PhoR/PhoB system is induced under conditions of phosphate starvation (≤0.2 mM phosphate), the level of PhoB protein is increased and PhoB~P is the predominant species. These findings are entirely consistent with the predicted pattern of PhoB activation and expression upon phosphate starvation [36–39]. PhoB expression is greatly enhanced by PhoB activation (see Fig. 7c), such that the small amount of PhoB that is constitutively expressed (see the faint bands in lysates of E. coli grown in media ≥0.3 mM phosphate, Fig. 7a, lanes 1–4), when phosphorylated, activates transcription of the operon containing phoB, thus increasing PhoB expression. The combined effect of the increased level of PhoB protein (≥10-fold), together with an increased fraction of phosphorylated PhoB ≥7-fold) results in a≥70-fold increase in the intracellular concentration of PhoB~P. These results represent the first direct demonstration of the long-postulated effect of extracellular phosphate concentrations on the level of PhoB~P.
The results presented in this section describe a quantitative technique for monitoring the extent of phosphorylation of a RR in cell lysates. With one experiment, both the extent of RR phosphorylation as well as the quantity of the RR in cells can be measured. Unlike PhoB, some RR proteins have not been amenable to in vitro characterization of phosphorylation because of their inability to be detectably phosphorylated using small molecule phosphodonors and because cognate histidine protein kinases are either unknown or unavailable. Characterization of in vivo phosphorylation using Phos-tag™ acrylamide might be especially useful for the study of such proteins. The requirement for specific antibodies to the protein of interest can be readily circumvented by the addition of epitope tags using standard molecular biology techniques, further expanding the utility and universality of this method for in vivo analysis of RR phosphorylation.
Considerations in choice of methods
Phos-tag™ gel stain and Phos-tag™ acrylamide provide needed additional methodologies for the characterization of phosphorylation in two-component signaling systems. In performing the studies presented here, we noted some potential limitations and considerations that might influence the choice of method for characterizing protein phosphorylation. Analysis of phosphorylation by Phos-tag™ gel stain is methodologically similar for all phosphorylated proteins, thus phosphorylation of different RR proteins can be assessed using the manufacturer’s protocol (with the minor modifications noted in this study), without the requirement for optimization. In contrast, Phos-tag™ acrylamide analysis requires optimization of gel composition for each protein studied. The concentrations of Phos-tag™ acrylamide, acrylamide, and crosslinker influence band shape, rates of migration of unphosphorylated and phosphorylated proteins, and the extent of hydrolysis of phospho-Asp. However, note that as long as sufficient separation of unphosphorylated and phosphorylated protein bands is achieved, even with substantially distorted bands and moderate hydrolysis of phospho-Asp, the fraction of phosphorylated proteins can be accurately estimated (see Figs. 6 and 7).
Both methods require standards of phosphorylated proteins to be run on each gel for generation of standard curves. Unfortunately, the requirement for internal standards in each gel restricts the number of samples that can be characterized at one time. However, such curves are necessary for quantitative analysis, as we have observed significant variation in both the extent of phospho-Asp hydrolysis (±10% in Phos-tag™ acrylamide gels) and Phos-tag™ staining intensities (±30%) between replicate experiments. Standards should be generated from known quantities of phosphorylated protein, thus requiring purified protein and an independent method for assessing levels of phosphorylation. Our experience suggests that Phos-tag™ staining requires standards of the specific RR protein being analyzed, while standard curves for Phos-tag™ acrylamide analyses can be generated from any representative RR.
For repeated in vitro analyses of similar proteins (e.g. a set of proteins with single-site mutations) we have found that Phos-tag™ acrylamide analysis is more efficient than Phos-tag™ gel stain analysis with respect to time, labor, and sensitivity. As packaged, Phos-tag™ acrylamide is substantially more expensive than Phos- tag™ gel stain, but once a standard protocol for a specific protein is developed, the cost per gel is similar for the two products. Additionally, Phos-tag™ acrylamide can be used for analyses of RR phosphorylation in complex mixtures such as cell lysates, albeit with some additional optimization of gel composition.
Acknowledgments
We thank Timothy Mack for advice and assistance with protein phosphorylation experiments, Ti Wu for purification of DrrD and PhoB, Jayita Guhaniyogi and Yuan Tao for synthesis of phosphoramidate, and Jizong Gao for preparation of protein expression plasmids. This work was supported by grant R37GM047958 from the U.S. National Institutes of Health. A.M.S. is an investigator of the Howard Hughes Medical Institute.
Footnotes
Abbreviations used: ACN, acetonitrile; CCD, charge coupled device; DrrD~P, phosphorylated DrrD; HK, histidine protein kinase; MALDI-TOF-MS, matrix assisted laser desorption/ionization-time of flight-mass spectrometry; PhoB~P; phosphorylated PhoB; RR, response regulator; RR~P, phosphorylated response regulator; TFA, trifluoroacetic acid; PA phosphoramidate; IPTG, isopropyl β-D-1-thiogalactopyranoside.
Publisher's Disclaimer: This is a PDF file of an unedited manuscript that has been accepted for publication. As a service to our customers we are providing this early version of the manuscript. The manuscript will undergo copyediting, typesetting, and review of the resulting proof before it is published in its final citable form. Please note that during the production process errors may be discovered which could affect the content, and all legal disclaimers that apply to the journal pertain.
References
- 1.Galperin MY. A census of membrane-bound and intracellular signal transduction proteins in bacteria: bacterial IQ, extroverts and introverts. BMC Microbiol. 2005;5:35. doi: 10.1186/1471-2180-5-35. [DOI] [PMC free article] [PubMed] [Google Scholar]
- 2.Ashby MK. Distribution, structure and diversity of “bacterial” genes encoding two-component proteins in the Euryarchaeota. Archaea. 2006;2:11–30. doi: 10.1155/2006/562404. [DOI] [PMC free article] [PubMed] [Google Scholar]
- 3.Mizuno T. Two-component phosphorelay signal transduction systems in plants: from hormone responses to circadian rhythms. Biosci Biotechnol Biochem. 2005;69:2263–2276. doi: 10.1271/bbb.69.2263. [DOI] [PubMed] [Google Scholar]
- 4.Loomis WF, Kuspa A, Shaulsky G. Two-component signal transduction systems in eukaryotic microorganisms. Curr Opin Microbiol. 1998;1:643–648. doi: 10.1016/s1369-5274(98)80109-4. [DOI] [PubMed] [Google Scholar]
- 5.Kruppa M, Calderone R. Two-component signal transduction in human fungal pathogens. FEMS Yeast Res. 2006;6:149–159. doi: 10.1111/j.1567-1364.2006.00024.x. [DOI] [PubMed] [Google Scholar]
- 6.Stock AM, Robinson VL, Goudreau PN. Two-component signal transduction. Annu Rev Biochem. 2000;69:183–215. doi: 10.1146/annurev.biochem.69.1.183. [DOI] [PubMed] [Google Scholar]
- 7.Koshland DE., Jr Effect of catalysts on the hydrolysis of acetyl phosphate. Nucleophilic displacement mechanisms in enzymatic reactions. J Am Chem Soc. 1952;74:2286–2292. [Google Scholar]
- 8.Lukat GS, McCleary WR, Stock AM, Stock JB. Phosphorylation of bacterial response regulator proteins by low molecular weight phospho-donors. Proc Natl Acad Sci USA. 1992;89:718–722. doi: 10.1073/pnas.89.2.718. [DOI] [PMC free article] [PubMed] [Google Scholar]
- 9.McCleary WR. The activation of PhoB by acetylphosphate. Mol Microbiol. 1996;20:1155–1163. doi: 10.1111/j.1365-2958.1996.tb02636.x. [DOI] [PubMed] [Google Scholar]
- 10.Head CG, Tardy A, Kenney LJ. Relative binding affinities of OmpR and OmpR-phosphate at the ompF and ompC regulatory sites. J Mol Biol. 1998;281:857–870. doi: 10.1006/jmbi.1998.1985. [DOI] [PubMed] [Google Scholar]
- 11.Hess JF, Oosawa K, Kaplan N, Simon MI. Phosphorylation of three proteins in the signaling pathway of bacterial chemotaxis. Cell. 1988;53:79–87. doi: 10.1016/0092-8674(88)90489-8. [DOI] [PubMed] [Google Scholar]
- 12.Buckler DR, Stock AM. Synthesis of [32P]phosphoramidate for use as a low molecular weight phosphodonor reagent. Anal Biochem. 2000;283:222–227. doi: 10.1006/abio.2000.4639. [DOI] [PubMed] [Google Scholar]
- 13.Takeda H, Kawasaki A, Takahashi M, Yamada A, Koike T. Matrix-assisted laser desorption/ionization time-of-flight mass spectrometry of phosphorylated compounds using a novel phosphate capture molecule. Rapid Commun Mass Spectrom. 2003;17:2075–2081. doi: 10.1002/rcm.1154. [DOI] [PubMed] [Google Scholar]
- 14.Inamori K, Kyo M, Nishiya Y, Inoue Y, Sonoda T, Kinoshita E, Koike T, Katayama Y. Detection and quantification of on-chip phosphorylated peptides by surface plasmon resonance imaging techniques using a phosphate capture molecule. Anal Chem. 2005;77:3979–3985. doi: 10.1021/ac050135t. [DOI] [PubMed] [Google Scholar]
- 15.Kinoshita E, Kinoshita-Kikuta E, Takiyama K, Koike T. Phosphate-binding tag, a new tool to visualize phosphorylated proteins. Mol Cell Proteomics. 2006;5:749–757. doi: 10.1074/mcp.T500024-MCP200. [DOI] [PubMed] [Google Scholar]
- 16.Kinoshita E, Takahashi M, Takeda H, Shiro M, Koike T. Recognition of phosphate monoester dianion by an alkoxide-bridged dinuclear zinc(II) complex. Dalton Trans. 2004:1189–1193. doi: 10.1039/b400269e. [DOI] [PubMed] [Google Scholar]
- 17.Kinoshita E, Yamada A, Takeda H, Kinoshita-Kikuta E, Koike T. Novel immobilized zinc(II) affinity chromatography for phosphopeptides and phosphorylated proteins. J Sep Sci. 2005;28:155–162. doi: 10.1002/jssc.200401833. [DOI] [PubMed] [Google Scholar]
- 18.Kinoshita-Kikuta E, Kinoshita E, Yamada A, Endo M, Koike T. Enrichment of phosphorylated proteins from cell lysate using a novel phosphate-affinity chromatography at physiological pH. Proteomics. 2006;6:5088–5095. doi: 10.1002/pmic.200600252. [DOI] [PubMed] [Google Scholar]
- 19.Kinoshita-Kikuta E, Aoki Y, Kinoshita E, Koike T. Label-free kinase profiling using phosphate affinity polyacrylamide gel electrophoresis. Mol Cell Proteomics. 2007;6:356–366. doi: 10.1074/mcp.T600044-MCP200. [DOI] [PubMed] [Google Scholar]
- 20.Yamada S, Nakamura H, Kinoshita E, Kinoshita-Kikuta E, Koike T. Separation of a phosphorylated histidine protein using phosphate affinity polyacrylamide gel electrophoresis. Anal Biochem. 2007;360:160–162. doi: 10.1016/j.ab.2006.10.005. [DOI] [PubMed] [Google Scholar]
- 21.Kinoshita E, Kinoshita-Kikuta E, Koike T. A single nucleotide polymorphism genotyping method using phosphate-affinity polyacrylamide gel electrophoresis. Anal Biochem. 2007;361:294–298. doi: 10.1016/j.ab.2006.11.032. [DOI] [PubMed] [Google Scholar]
- 22.Buckler DR, Zhou Y, Stock AM. Evidence of intradomain and interdomain flexibility in an OmpR/PhoB homolog from Thermotoga maritima. Structure. 2002;10:153–164. doi: 10.1016/s0969-2126(01)00706-7. [DOI] [PubMed] [Google Scholar]
- 23.Sheridan RC, McCullough JF, Wakefield ZT. Phosphoramidic acid and its salts. Inorg Synth. 1971;13:23–26. [Google Scholar]
- 24.Friedland N, Mack TR, Yu M, Hung LW, Terwilliger TC, Waldo GS, Stock AM. Domain orientation in the inactive response regulator Mycobacterium tuberculosis MtrA provides a barrier to activation. Biochemistry. 2007;46:6733–6743. doi: 10.1021/bi602546q. [DOI] [PMC free article] [PubMed] [Google Scholar]
- 25.Datsenko KA, Wanner BL. One-step inactivation of chromosomal genes in Escherichia coli K-12 using PCR products. Proc Natl Acad Sci USA. 2000;97:6640–6645. doi: 10.1073/pnas.120163297. [DOI] [PMC free article] [PubMed] [Google Scholar]
- 26.Baba T, Ara T, Hasegawa M, Takai Y, Okumura Y, Baba M, Datsenko KA, Tomita M, Wanner BL, Mori H. Construction of Escherichia coli K-12 in-frame, single-gene knockout mutants: the Keio collection. Mol Syst Biol. 2006;2:0008. doi: 10.1038/msb4100050. [DOI] [PMC free article] [PubMed] [Google Scholar]
- 27.Toro-Roman A, Mack TR, Stock AM. Structural analysis and solution studies of the activated regulatory domain of the response regulator ArcA: a symmetric dimer mediated by the α4-β5-α5 face. J Mol Biol. 2005;349:11–26. doi: 10.1016/j.jmb.2005.03.059. [DOI] [PMC free article] [PubMed] [Google Scholar]
- 28.Neidhardt FC, Bloch PL, Smith DF. Culture medium for enterobacteria. J Bacteriol. 1974;119:736–747. doi: 10.1128/jb.119.3.736-747.1974. [DOI] [PMC free article] [PubMed] [Google Scholar]
- 29.McCleary WR, Stock JB. Acetyl phosphate and the activation of two-component response regulators. J Biol Chem. 1994;269:31567–31572. [PubMed] [Google Scholar]
- 30.McCleary WR, Stock JB, Ninfa AJ. Is acetyl phosphate a global signal in Escherichia coli? J Bacteriol. 1993;175:2793–2798. doi: 10.1128/jb.175.10.2793-2798.1993. [DOI] [PMC free article] [PubMed] [Google Scholar]
- 31.Silversmith RE, Appleby JL, Bourret RB. Catalytic mechanism of phosphorylation and dephosphorylation of CheY: kinetic characterization of imidazole phosphates as phosphodonors and the role of acid catalysis. Biochemistry. 1997;36:14965–14974. doi: 10.1021/bi9715573. [DOI] [PubMed] [Google Scholar]
- 32.Da Re SS, Deville-Bonne D, Tolstykh T, Veron M, Stock JB. Kinetics of CheY phosphorylation by small molecule phosphodonors. FEBS Lett. 1999;457:323–326. doi: 10.1016/s0014-5793(99)01057-1. [DOI] [PubMed] [Google Scholar]
- 33.Zapf JW, Hoch JA, Whiteley JM. A phosphotransferase activity of the Bacillus subtilis sporulation protein Spo0F that employs phosphoramidate substrates. Biochemistry. 1996;35:2926–2933. doi: 10.1021/bi9519361. [DOI] [PubMed] [Google Scholar]
- 34.Thomason PA, Traynor D, Cavet G, Chang WT, Harwood AJ, Kay RR. An intersection of the cAMP/PKA and two-component signal transduction systems in Dictyostelium. EMBO J. 1998;17:2838–2845. doi: 10.1093/emboj/17.10.2838. [DOI] [PMC free article] [PubMed] [Google Scholar]
- 35.Stock AM, Wylie DC, Mottonen JM, Lupas AN, Ninfa EG, Ninfa AJ, Schutt CE, Stock JB. Phosphoproteins involved in bacterial signal transduction. Cold Spring Harbor Symp Quant Biol. 1988;53:49–57. doi: 10.1101/sqb.1988.053.01.009. [DOI] [PubMed] [Google Scholar]
- 36.Wanner BL. Gene regulation by phosphate in enteric bacteria. J Cell Biochem. 1993;51:47–54. doi: 10.1002/jcb.240510110. [DOI] [PubMed] [Google Scholar]
- 37.Wanner BL. Phosphorus assimilation and control of the phosphate regulon. In: Neidhardt FC, Curtiss R III, Ingraham JL, Lin ECC, Low J, Magasanik KBB, Reznikoff WS, Riley M, Schaechter M, Umbarger HE, editors. Escherichia coli and Salmonella. American Society for Microbiology Press; Washington, D.C: 1996. pp. 1357–1381. [Google Scholar]
- 38.Makino K, Amemura M, Kim S-K, Nakata A, Shinagawa H. Mechanism of transcriptional activation of the phosphate regulon in Escherichia coli. In: Torriani-Gorini A, Yagil E, Silver S, editors. Phosphate in Microorganisms: Cellular and Molecular Biology. American Society for Microbiology; Washington, D.C: 1994. pp. 5–12. [Google Scholar]
- 39.Makino K, Shinagawa H, Amemura M, Kawamoto T, Yamada M, Nakata A. Signal transduction in the phosphate regulon of Escherichia coli involves phosphotransfer between PhoR and PhoB proteins. J Mol Biol. 1989;210:551–559. doi: 10.1016/0022-2836(89)90131-9. [DOI] [PubMed] [Google Scholar]