Abstract
The resistance for fluid flow of the cochlear aqueduct was measured in guinea pigs for different positions of the round window membrane. These different positions were obtained by applying different constant pressures to the middle ear cavity. Fluid flow through the aqueduct was induced by small pressure steps superimposed on these constant pressures. It was found that the resistance for fluid flow through the aqueduct depended on the round window position but not on flow direction. The results can be explained by special fibrous structures that connect the round window with the entrance of the aqueduct. It was also found that the equilibrium inner ear pressure depends on middle ear pressure, indicating that the aqueduct does not connect the inner ear with a cavity with constant pressure.
Keywords: flow resistance, cochlear aqueduct, round window, inner ear pressure
INTRODUCTION
The common explanation for the symptoms of Menière’s disease is an increase in endolymphatic volume (“hydrops”) and, as a consequence, a pressure difference between endolymph and perilymph. Manipulation of middle ear pressure through a ventilation tube inserted in the tympanic membrane, which influences inner ear fluid pressure, is the mechanism applied by the Meniett. This is a small therapeutic device designed for the relief of symptoms in patients suffering from Menière’s disease (Ödkvist et al. 2000).
The inner ear pressure change profile created by application of the Meniett has a complex shape (Feijen et al. 2000). This makes it difficult to derive the relation between the resulting inner ear pressure changes and the middle ear pressure changes produced by experiments in which the Meniett is the pressure generator. Therefore, we studied inner ear pressure changes in the guinea pig induced by middle ear pressure changes with a simple rectangular profile (Feijen et al. 2002). One of the outcomes of this study was that the resistance for fluid flow through the cochlear aqueduct, which connects scala tympani with the cerebrospinal fluid space, is not constant but depends on both inner ear volume and pressure. The dependence on inner ear volume was explained by round window membrane position influencing aqueduct flow resistance (Wit et al. 2003). The study also indicated that aqueduct flow resistance does not depend on flow direction, in contrast with evidence from earlier research (Densert et al. 1981; Carlborg et al. 1982; Thalen et al. 2001, 2002).
The present study was designed to verify the relation between round window position and aqueduct resistance by keeping the pressure changes that induced fluid flow through the aqueduct as small as possible. In this way flow resistance could be measured at different (almost) constant values of inner ear volume.
Because the resistance was measured both for flow in the direction of the cerebrospinal fluid space and for the returning flow, the influence of flow direction on resistance could also be determined.
MATERIALS AND METHODS
The experimental design was basically the same as described before (Feijen et al. 2002). The head of the guinea pig was fixated and a flexible tube, glued airtight in the external meatus, was connected to a pressure generator [modified WPI 900A micropressure system (World Precision Instruments Inc.)] controlled by a synthesized function generator (DS345; Stanford Research Systems). Also connected to this tube was an electronic pressure-measuring device (EMA 84; Erwin Halstrup Multur GmbH), to measure ear canal pressure. The bulla was opened via a retroauricular incision. The tympanic membrane was perforated and the tip of a beveled micropipette (tip diameter = 10 μm), filled with 2 M NaCl, was introduced through the round window rim into scala tympani. Through this tip perilymphatic pressure was measured with a second WPI 900A system. Finally, the hole in the bulla was carefully closed with dental cement. The experimental setup is schematically shown in Figure 1.
Figure 1.
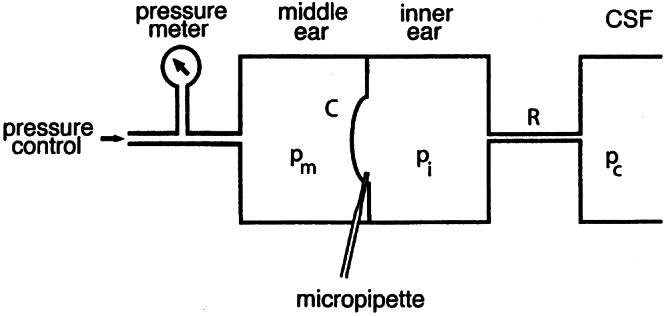
Experimental representation of measurement setup. Middle ear pressure pm is changed with an electronic pressure control system and measured with a solid-state pressure meter. Inner ear pressure pi is measured through a micropipette with a WPI micropressure system. R = flow resistance of cochlear aqueduct; C = compliance of cochlear windows (mainly of round window); pc= pressure of cerebrospinal fluid (CSF).
A pressure change profile was applied to and monitored in the external ear canal, while the resulting perilymphatic pressure change was recorded. This stimulus consisted of a small positive pressure step of 0.5 cm water, followed after 60 s by a returning pressure step of −0.5 cm water, superposed on a constant pressure pmc. This stimulus was repeated every 120 s and inner ear pressure responses to 10 successive stimuli were recorded and averaged offline. The complete procedure was carried out for 4 values of pmc: −2.5, 0, 2.5, and 5 cm water.
Stimuli were generated on a personal computer with software for communication with the synthesized function generator (Arbitrary Waveform Composer, ver. 1.10). The output signals of the pressure-measuring devices were A/D converted and stored on hard disk with a rate of 20 Hz. “High-frequency” fluctuations caused by breathing and heartbeat were removed offline from the inner ear pressure recordings by digital filtering. Calibration of the pressure transducers was performed against a known water column.
This study used 4 healthy female albino guinea pigs (Duncan Hartley; HSD Poc) weighing 400–500 g. They were anesthetized with ketamine hydrochloride 50 mg/ml and xylazine 20 mg/ml (in the volume ratio 2:1, at a dose level of approximately 1 ml/kg body weight), given intramuscularly. Complete muscle relaxation was obtained by intramuscular administration of suxamethoniumchloride (5 mg/kg body weight). Body temperature was kept stable between 37°C and 38°C with a heating pad. Animals were artificially ventilated through tracheal cannulation and heart rate was monitored. Both ears of the guinea pigs were experimented on and animals were sacrificed after the experiments by intracardial pentobarbital injection. The experiment was approved by the Experimental Animal Committee of Groningen University (protocol number 2439) in accordance with the principles of the declaration of Helsinki.
RESULTS
Measurements were considered successful in five ears. At pmc = 0 (atmospheric pressure) mean inner ear pressure was 3.4 (±1.4) cm water.
An illustrative result of a complete series of measurements in one ear is given in Figure 2. The upper panels show the pressure profiles applied to the middle ear, while the resulting inner ear pressure profiles are shown in the corresponding lower panels. It is noticeable that the time constants τ for the exponentially shaped inner ear pressure recovery curves increase with increasing equilibrium middle ear pressure (from −2.5 to 5 cm water in Fig. 2a–d).
Figure 2.
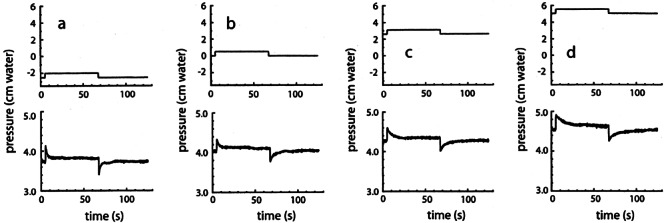
Middle ear air pressure (upper panels) and inner ear fluid pressure (lower panels) profiles. Small positive pressure steps of 0.5 cm water, followed after 60 s by small negative steps with the same magnitude, were superimposed on constant middle ear pressures of (a) −2.5, (b) 0, (c) 2.5, and (d) 5 cm water.
The product of the flow resistance R of the aqueduct and the compliance C of the cochlear windows was derived from the slope of these recovery curves in the following way: R is defined as
 |
1 |
where Δp is the pressure difference across the cochlear aqueduct and f is the fluid flow through it. This flow is not directly measurable. It is equal to the change of inner ear volume with time:
 |
2 |
Combining Eqs. (1) and (2) gives:
 |
3 |
Inner ear (excess) volume V (see Fig. 3a) is related to the pressure pw exerted on the inner ear fluids by the cochlear windows:
 |
4 |
Figure 3.
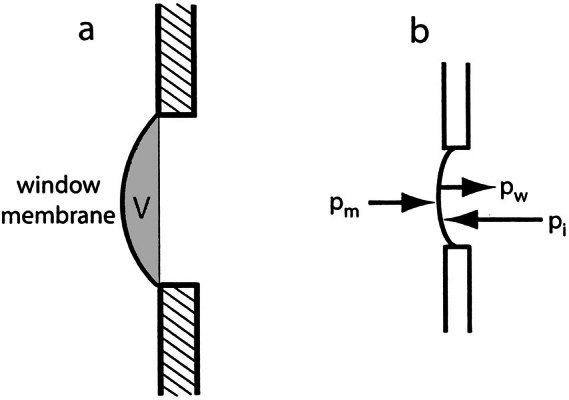
a. Definition of excess inner ear volume V (gray area), b. Inner ear pressure (pi) counteracts the sum of middle ear pressure (pm) and the pressure (pw) exerted on the inner ear fluid by the elastic membrane: pi = pm + pw.
Differentiating this function with respect to time gives
 |
5 |
Because the compliance C of the cochlear windows is defined by dV/dpw, the foregoing expression can be replaced by
 |
6 |
The relation between inner ear pressure pi, middle ear pressure pm, and window pressure pw is
 |
So, in general,
 |
7 |
If pm is constant, which is the situation right after a stepwise middle ear pressure change, this relation reduces to
 |
8 |
Combining Eqs. (6) and (8) gives
 |
9 |
And finally, from Eqs. (3) and (9), the relation
 |
10 |
is obtained.
Because it was found that RC is not constant during inner ear pressure recovery after a change of inner ear pressure (Thalen et al. 2002), we restricted our analysis to the first part of the recovery curves, immediately following a middle ear pressure step (at t0). A horizontal line was fitted to the part of the measured pi curves preceding t0, to obtain a value for p1 (see Fig. 4). Then a sloping line (first or second order, depending on the curvature) was fitted to the part of the pi* curves right after t0, to obtain pi at t0 and a value for p2 (Fig. 4). The difference p1− p2 gives Δp. From the values for p*i and Δp, the product RC was calculated with Eq.(10).
Figure 4.
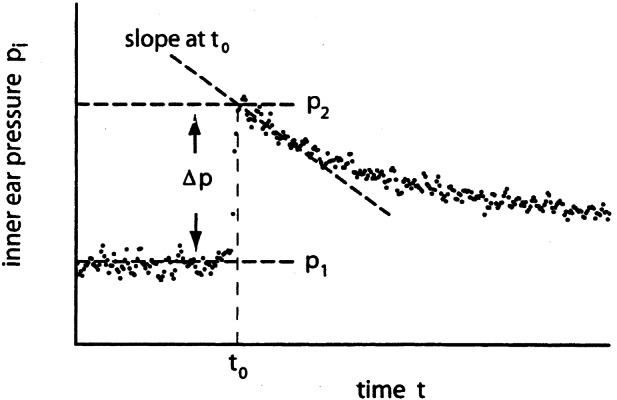
First part of inner ear pressure recovery curve after a middle ear pressure step. This pressure step increases inner ear pressure by Δp. The sloping dashed line is a fit to the first part of the decaying pressure curve.
The results for four ears are compiled in Figure 5 (results from the fifth ear were incomplete). Open circles in this figure give RC for a flow direction out of the ear and open squares are for the returning flow. The four different pairs (circle + square) in one panel correspond to the equilibrium values +5, +2.5, 0, and −2.5 cm water for pm.
Figure 5.
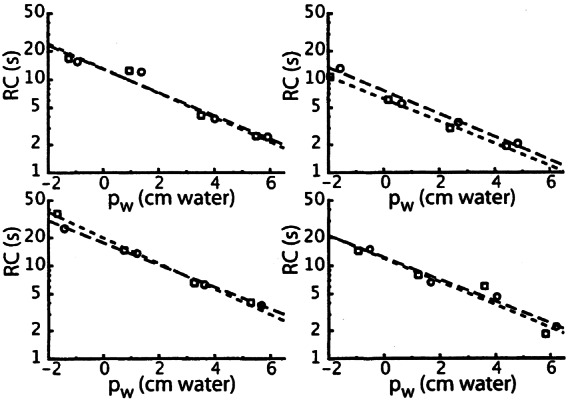
The product RC of aqueduct flow resistance and window compliance for different values for window pressure pw for four different ears. Circles are for fluid flow out of the inner ear, squares for the returning flow. Dashed lines are linear fits to log RC as a function of pw (long dashes for the circles; short dashes for the squares). Window pressure pw is inner ear pressure pi just after a pressure step (=p2 in Fig. 4 for a positive-going step) minus middle ear pressure after this pressure step.
Fits with exponential curves were made to the data points in Figure 5, for both outgoing and returning fluid flow (long and short dashes, respectively). It can be seen that the fits do not differ systematically for the two directions of flow. Averaging of the 8 fitted lines gives the relation
 |
11 |
An average value of 21 Pa s/nl was obtained for R in a direct measurement of flow resistance (Thalen et al. 2004), at a pressure of 2.8 cm water (=280 Pa). Substituting these two values in Eq. (11) gives a value of 0.26 nl/Pa for C at pw = 2.8 cm water. The compliance of the human cochlear windows as a function of inner ear pressure has a Gaussian shape (Ivarsson and Pedersen 1977; Wit et al. 2003). If we suppose the same to be true for the guinea pig and combine this assumption with the above given value for C at pw= 280 Pa, Figure 6 can be constructed. This figure gives C as a function of pw for different values C0 of C at pw= 0 in the upper panel, and the derived relation between inner ear volume V and window pressure pw in the lower panel. The curves in the lower panel are the integrals of the Gaussian curves in the upper panel. For comparison the relation is also given for the human round window (Ivarsson and Pedersen 1977).
Figure 6.
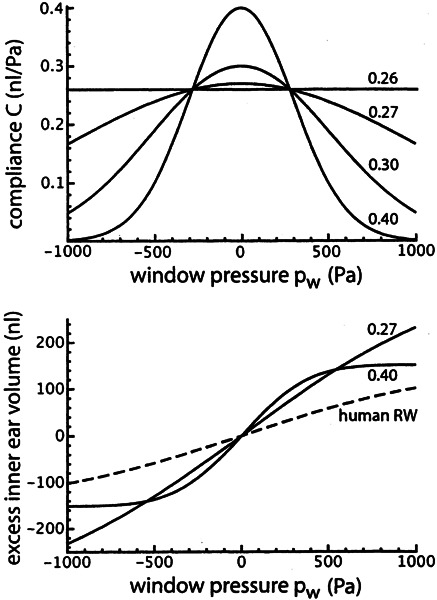
Upper panel: assumed Gaussian shape for window compliance as a function of window pressure for four different values for C at pw = 0. The curves intersect at C = 0.26 nl/Pa for pw = 280 Pa. Lower panel: Integrals of two curves in the upper panel and, for comparison, the relation between inner ear excess volume and window pressure for the human round window.
Figure 7 gives the derived relation between excess inner ear volume V and cochlear aqueduct flow resistance R. This figure was constructed by using the relation between C and pw as given in the upper panel of Figure 6 and the relation between V and pw as given in the lower panel of Figure 7. The values given by these relations were substituted in Eq. (11), for a pw range between −200 and +600 Pa.
Figure 7.
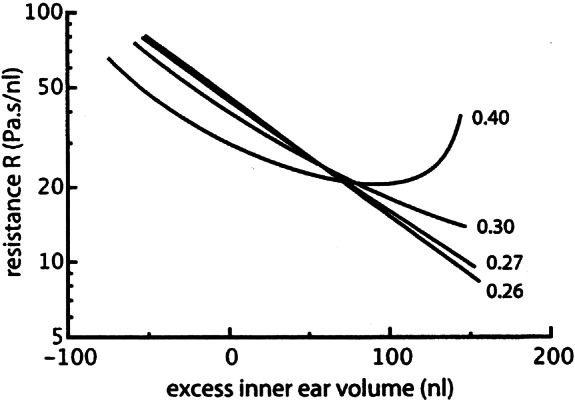
Derived aqueduct flow resistance R for four different values for C0, as given in the upper panel of Fig. 6.
It can be seen in Figure 2 that the equilibrium value to which pi returns after a pressure step slightly changes with different equilibrium values for pw (from 3.8 cm water in Fig. 7a to 4.6 cm water in Fig. 7d). This effect was observed in all five investigated ears, as can be seen in Figure 8. The average slope of the dashed line in this figure is 0.10.
Figure 8.
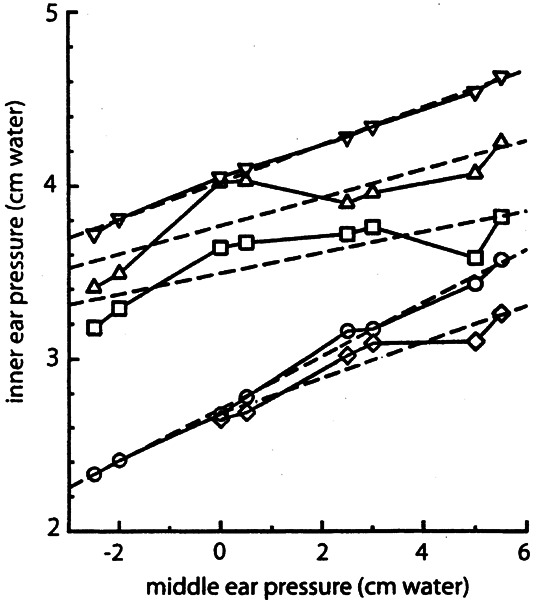
Permanent change of inner ear pressure for five ears (denoted with different symbols) for different (constant) values of middle ear pressure. Dashed lines are linear least squares fits to the data from these five ears. The average slope of these lines is 0.10.
DISCUSSION
The value for the compliance of the guinea pig cochlear windows is not exactly known. In a previous article we used a value of 0.17 nl/Pa (Wit et al. 2003; Fig. 9b), which was based on a value that was indirectly obtained by Décory et al. (1990). In the present article we use somewhat larger values for the compliance (Fig. 6) to match the value for R from Thalen et al. (2004) and the product of R and C as given in Eq. (11).
Figure 9.
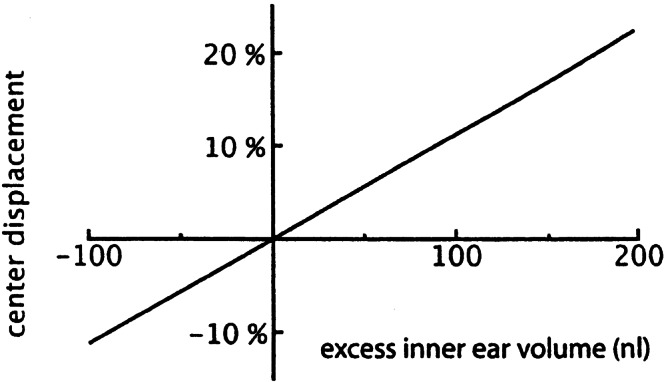
Calculated displacement of round window center as a function of excess inner ear volume (as defined in Fig. 3a), expressed in percentage of its diameter.
Figure 7 shows that the flow resistance of the cochlear aqueduct depends on excess inner ear volume (as defined in Fig. 3a). This can be explained by the influence of the position of the round window on the conducting properties of the aqueduct: If the round window bulges outward (positive volume), it stretches the meshwork inside the opening of the aqueduct and lowers the flow resistance. If the window bulges inward (negative volume), the meshwork collapses and the resistance increases (Wit et al. 2003).
With this explanation the curve for C0 = 0.40 nl/Pa in Figure 7 has an unlikely shape. This gives an upper limit for C0 that must be somewhat lower. The same conclusion can be drawn from Figure 6: For C0 = 0.40 nl/Pa, the cochlear windows behave as almost completely stiff for pressures above 500 Pa (approximately 5 cm water).
It can be seen in Figure 5 that the time constant (τ = RC) for pressure recovery after a small pressure step changes by about a factor of 10 for the applied range of pressure values. This large difference in τ values is clearly observable in Figure 2: Pressure recovery is much faster in Figure 2a than in Figure 2d.
The relation between excess inner ear volume and the displacement of the center of the round window is given in Figure 9. It was assumed that the round window has a parabolic shape with an area of 1.2 mm2 (Ghiz et al. 2001), and that the contribution of the round window displacement to the inner ear volume change is 5 times that of the oval window (Ivarsson and Pedersen 1977).
No systematic difference exists for the relation between RC and pw for fluid flow out of the inner ear through the cochlear aqueduct (circles in Fig. 5) and the returning flow (squares in Fig. 5). Because it is very unlikely that C depends on the direction of motion of the cochlear windows, this means that R does not depend on the direction of flow through the cochlear aqueduct. That is to say, for the flow values that occurred. With formulas (2) and (9) this range of flow values (immediately after the middle ear pressure step) was calculated to be between 0.5 and 5 nl/s. Although the possibility that R depends on flow direction could not be excluded in earlier experiments (Thalen et al. 2001), it was concluded later that flow direction has no influence (Wit et al. 2003), which is in accordance with the present results.
The pressure profile applied to the ear canal of Menière patients by the Meniett is the sum of a “DC” pressure shift of 8 cm water during 1 s and an “AC” pressure modulation with an amplitude of 3 cm water and with a frequency of 6 Hz. This profile is repeated every 6 s. The DC pressure shift will move the round window inward and increase the flow resistance of the cochlear aqueduct. In this situation the AC pressure modulation will create fluid flow with changing direction, possibly mainly in the endolymphatic duct, which is the connection between the inner ear and the endolymphatic sac. Why this is beneficial to Menière patients is unclear.
When the vestibular or cochlear aqueduct was obstructed, Suzuki et al. (1994a, b) found marked effects on the neural vestibular response to middle ear pressure changes, most probably caused by a permanent change in inner ear fluid pressure. And, contrary to what would be expected, inner ear pressure did not return to the value it had before middle ear pressure was changed in their control measurements (Suzuki et al. 1994b, no aqueduct obstructed, Figs. 1 and 2), after both a positive and a negative middle ear pressure change.
We observed the same effect, as is shown in Figure 8. This means that in a static situation (middle ear pressure constant) inner ear pressure depends on middle ear pressure. The permanent change of inner ear pressure is about 10% of the (permanent) change in middle ear pressure. This means that the model that we proposed earlier for the relation between inner and middle ear pressure (Wit et al. 2003; Fig. 1) is too simple. In this model it is assumed that the CSF space, to which the inner ear is connected through the cochlear aqueduct, has an infinitely large compliance, making inner ear pressure to always return to the (constant) CSF pressure in a static situation. The present results can be explained by modelling the exit of the cochlear aqueduct in the CSF space as a closed volume, surrounded by a membrane, as schematically shown in Figure 10. The compliance C2 of this membrane must be about 9 times that of the cochlear windows (Appendix), because the permanent change in inner ear pressure is one tenth of the change in middle ear pressure.
Figure 10.

Schematic representation of model to explain the relation between static middle ear and inner ear pressures (mathematical formulation in Appendix).
However, an unsolved discrepancy remains: When fluid is injected into the inner ear, inner ear pressure rapidly returns to its preinjection value (e.g., Takeuchi et al. 1991; Wit et al. 1999) after termination of the injection. No permanent shift of inner ear pressure was reported, although substantial amounts of fluid (a few microliters) were injected. An increase in inner ear fluid volume with 1 μl in Figure 10 gives an increase of pi of about 3 cm water for the estimated values of C1 and C2. Such a pressure increase would have been easily observable.
Acknowledgments
This study was supported by the Heinsius Houbolt Foundation and is part of the research program of our department: Communication through Hearing and Speech. The program is incorporated in the Sensory Systems Group of the Groningen Graduate School for Behavioural and Cognitive Neurosciences (BCN).
Appendix
Starting from the situation as shown in Figure 10, middle ear pressure pm is increased by an amount Δp. This will move the membrane compliance C1 inward and displace a fluid volume ΔV through flow resistance R. The volume surrounded by the membrane with compliance C2 will then expand by an amount ΔV, causing the pressure exerted by this membrane on the inner ear fluids to increase with ΔV/C2. Because the pressure in the CSF space pc is supposed to remain constant, this pressure increase is equal to the increase of inner ear pressure: Δpi= ΔV/C2. On the other hand, Δpi is also equal to the increase in middle ear pressure minus the decrease of the pressure exerted by the membrane with compliance C1. In the formula Δpi = Δpm − ΔV/C1, combining the two relations for pi by removing ΔV gives, after some rewriting
 |
References
- Carlborg B, Densert B, Densert O. Functional patency of the cochlear aqueduct. Ann. Otol. Rhinol. Laryngol. 1982;91:209–215. doi: 10.1177/000348948209100219. [DOI] [PubMed] [Google Scholar]
- Décory, l, Franke, RB, Dancer, AL (1990) “Measurement of the middle ear transfer function in cat, chinchilla and guinea pig” In: Dallas, P, Geiser, CD, Matthews, JW, Ruggero, MA, Steele, CR (eds.), The Mechanics and Biophysics of Hearing, Springer, Berlin, pp 270–277
- Densert O, Carlborg B, Stagg J. Transmission of low frequency pressure steps to the perilymphatic fluid. Acta Otolaryngol. (Stockh.) 1981;91:55–64. [Google Scholar]
- Feijen RA, Segenhout JM, Wit HP, Albers FWJ. Monitoring inner ear pressure changes in normal guinea pigs induced by the Meniett20. Acta Otolaryngol. (Stockh.) 2000;120:804–809. doi: 10.1080/000164800750061633. [DOI] [PubMed] [Google Scholar]
- Feijen RA, Segenhout JM, Albers FWJ, Wit HP. Change of guinea pig inner ear pressure by square wave middle ear cavity pressure variation. Acta Otolaryngol. (Stockh) 2002;122:138–145. doi: 10.1080/00016480252814135. [DOI] [PubMed] [Google Scholar]
- Ghiz AF, Salt AN, DeMott JE, Henson MM, Henson O-WJ, Gewalt SL. Quantitative anatomy of the round window and cochlear aqueduct in guinea pigs. Hear Res. 2001;162:105–112. doi: 10.1016/S0378-5955(01)00375-6. [DOI] [PubMed] [Google Scholar]
- Ivarsson A, Pedersen K. Volume–pressure properties of round and oval windows. A quantitative study on human temporal bone. Acta Otolaryngol (Stockh) 1977;84:38–43. doi: 10.3109/00016487709123940. [DOI] [PubMed] [Google Scholar]
- Ödkvist LM, Arlinger S, Billermark E, Densert B, Lindholm S, Wallqvist J. Effects of middle ear pressure changes on clinical symptoms in patients with Meniere’s disease—a clinical multicenter placebo-controlled study. Acta Otolaryngol. Suppl. (Stockh) 2000;543:99–101. [PubMed] [Google Scholar]
- Suzuki M, Kitahara M, Kitano H. The influence of middle ear pressure changes on the primary vestibular neurons in guinea pigs. Acta Otolaryngol. Suppl. (Stockh.) 1994a;510:9–15. doi: 10.3109/00016489409127294. [DOI] [PubMed] [Google Scholar]
- Suzuki M, Kitahara M, Kitano H. The influence of vestibular and cochlear aqueducts on vestibular response to middle ear pressure changes in guinea pigs. Acta Otolaryngol. Suppl. (Stockh.) 1994b;510:16–19. doi: 10.3109/00016489409127295. [DOI] [PubMed] [Google Scholar]
- Takeuchi S, Takeda T, Saito H. Pressure relation between perilymph and endolymph associated with endolymphatic infusion. Ann. Otol. Rhinol. Laryngol. 1991;100:244–248. doi: 10.1177/000348949110000314. [DOI] [PubMed] [Google Scholar]
- Thalen EO, Wit HP, Segenhout JM, Albers FWJ. Dynamics of inner ear pressure change caused by intracranial pressure manipulation in the guinea pig. Acta Otolaryngol. (Stockh) 2001;121:470–476. doi: 10.1080/000164801300366606. [DOI] [PubMed] [Google Scholar]
- Thalen E, Wit H, Segenhout H, Albers F. Inner ear pressure changes following square wave intracranial or ear canal pressure manipulation in the same guinea pig. Eur. Arch. Otorhinolaryngol. 2002;259:174–179. doi: 10.1007/s00405-001-0431-0. [DOI] [PubMed] [Google Scholar]
- Thalen EO, Wit HP, Segenhout JM, Albers FWJ. Direct measurement of the flow resistance of the cochlear aqueduct in the guinea pig. Acta Otolaryngol. (Stockh) 2004;124:1–5. doi: 10.1080/00016480410017530. [DOI] [PubMed] [Google Scholar]
- Wit HP, Thalen EO, Albers FWJ. Dynamics of inner ear pressure release, measured with a double-barreled micropipette in the guinea pig. Hear. Res. 1999;132:131–139. doi: 10.1016/S0378-5955(99)00048-9. [DOI] [PubMed] [Google Scholar]
- Wit HP, Feijen RA, Albers FWJ. Cochlear aqueduct flow resistance is not constant during evoked inner ear pressure change in the guinea pig. Hear Res. 2003;75:190–199. doi: 10.1016/S0378-5955(02)00738-4. [DOI] [PubMed] [Google Scholar]


