Abstract
Existing cochlear implants stimulate the auditory nerve with trains of symmetric biphasic (BP) pulses. Recent data have shown that modifying the pulse shape, while maintaining charge balance, may be beneficial in terms of reducing power consumption, increasing dynamic range, and limiting channel interactions. We measured thresholds and most comfortable levels (MCLs) for various 99-pulses-per-second (pps) stimuli. “Pseudomonophasic (PS)” pulses consist of a brief phase of one polarity followed immediately by a longer and lower-amplitude phase of the opposite polarity. We focused on a novel variant of PS pulses, termed the “delayed pseudomonophasic (DPS)” stimulus, in which the longer phase is presented midway between the short phases of two consecutive pulses. DPS pulse trains produced thresholds that were more than 10 dB lower than those obtained with BP pulses. This reduction was much greater than the 0- to 3-dB drop obtained with PS pulses and was still more than 6 dB when a pulse rate of 892 pps was used. A study of the relative contributions of the two phases of DPS suggested that the short, high-amplitude phase dominated the perceived loudness. This study showed major threshold and MCL reductions using a DPS stimulus compared to the widely used BP stimulus. These reductions, which were predicted by a simple linear filter model, might lead to considerable power savings if implemented in a cochlear implant speech processor.
Keywords: pulse shape, cochlear implants, asymmetric pulse, polarity, threshold, loudness perception
Introduction
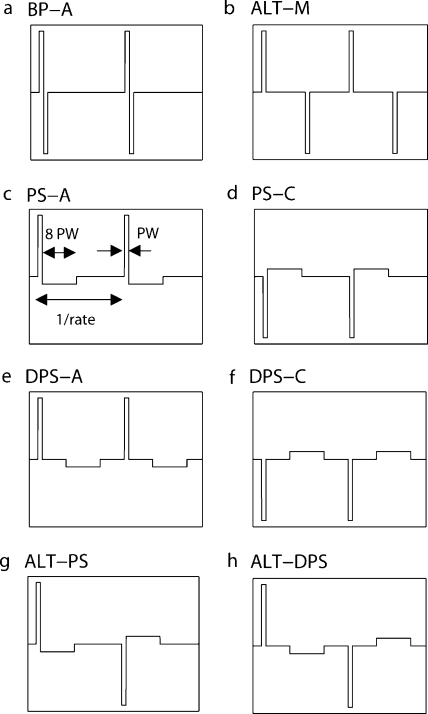
Several experimenters have reported behavioral data from cochlear implant (CI) users using pulse shapes that differed from the widely used biphasic (BP) waveform (Fig. 1a). Novel pulse shapes that have been studied include triphasic pulses (Eddington et al. 2004; Bonnet et al. 2004), BP pulses with a long interphase gap (IPG; McKay and Henshall, 2003; Carlyon et al. 2005), “alternating-monophasic (ALT-M)” pulses (Fig. 1b; van Wieringen et al. 2005; Carlyon et al. 2005), and “pseudomonophasic (PS)” pulses (Fig. 1c and d; van Wieringen et al. 2005). Several of these pulse shapes produced lower thresholds and lower most comfortable levels (MCLs) than the “standard” BP stimulus. This may possibly lead to reduced power consumption when applied in CIs.
Fig. 1.
Overview of the pulse shapes used in the study. (a) Biphasic anodic-first (BP-A), (b) Alternating-monophasic (ALT-M), (c) pseudomonophasic anodic-first (PS-A), (d) pseudomonophasic cathodic-first (PS-C), (e) delayed pseudomonophasic anodic-first (DPS-A), (f) delayed pseudomonophasic cathodic-first (DPS-C), (g) alternating pseudomonophasic (ALT-PS), and (h) alternating-delayed pseudomonophasic (ALT-DPS). All asymmetric pulses had a long/low phase eight times longer (and eight times lower in amplitude) than the short/high one. Rate and phase width (PW) are defined in panel (c).
Another possible advantage of alternative pulse shapes is in limiting channel interactions. Although existing CIs possess up to 24 electrodes, the spread of current generated by adjacent channels overlaps and consequently limits the number of independent channels to about eight (Friesen et al. 2001, 2005; Fishman et al. 1997). Reduced spread of excitation using PS pulses has been observed in modeling studies of auditory (Frijns et al. 1996) and central (McIntyre and Grill, 2002) neurons. Moreover, asymmetric pulses, as suggested by Eddington et al. (2004) for the triphasic shape, might restore the neural membrane to its resting potential more rapidly than BP pulses, so that nonsimultaneous interactions might also be reduced. This effect is, however, likely to be limited by the duration of the charge-recovery phase of the pulse. In the case of PS stimulation, if the duration of the long, low-amplitude phase is longer than the time needed by the membrane potential to return to rest following a BP pulse, then PS pulses may lead to more channel interactions than BP. That apart, signal processing strategies using carefully chosen asymmetric pulse shapes might lead to an increased number of independent stimulation channels and, possibly, to better speech perception. Bonnet et al. (2004) reported that, at an SNR of 5 dB, identification of phonemes presented in a consonant–vowel–consonant context improved from 66 to 74% with triphasic compared to BP pulses.
A third reason for studying asymmetric pulse shapes is that they may shed light on polarity effects with electrical stimulation. Physiological studies of electrical stimulation in cats' single auditory-nerve fibers have indicated that cathodic monophasic pulses are more efficient than anodic ones (Miller et al. 1999). Because we would expect excitation by PS pulses to be dominated by the shorter of the two phases (Frijns et al. 1996; Miller et al. 2001), they may allow polarity effects to be observed in human behavioral experiments. This would, in turn, provide a rationale for implementing a particular pulse polarity in a CI speech processor.
Previous reports on pulse shape effects on human sensitivity to electrical stimulation have revealed a number of important facts. Using 100-pulses-per-second (pps) pulse trains, van Wieringen et al. (2005) showed that PS pulses produced thresholds that were only slightly (0–3 dB) lower than obtained with BP pulses. They also found that the ALT-M stimulus (Fig. 1b) produced lower thresholds and larger dynamic ranges than standard BP pulses (Fig. 1a). Similarly, Carlyon et al. (2005) found that the thresholds of 100-pps BP pulses decreased with increases in IPG up to 4.9 ms. These findings suggest that increasing the time over which charge is recovered by several milliseconds can reduce thresholds. However, the stimuli that led to the lowest thresholds (the ALT-M stimulus and the BP stimulus with an extended IPG) consisted of two symmetric phases, both of which are likely to contribute to neural activation. Such stimuli are unlikely to be useful in CI speech processors because, to maintain a charge balance, the two phases will be constrained to have equal amplitudes; the fact that they are separated in time means that this will distort the representation of the signal amplitude. A possible solution, proposed by Carlyon et al. (2005), is the use of a delayed pseudomonophasic (DPS) stimulus (Fig. 1e and f); this is identical to PS except that the long, low-amplitude phase is delayed. If the nerve is stimulated primarily by the short, high-amplitude phase, then this stimulus may be a more appropriate candidate for a speech processing strategy, while still producing lower thresholds than the BP or PS waveforms. The only limiting factor in using DPS or PS in a speech strategy is the duration of the long, low-amplitude phase. Stimulating at rates similar to those used in existing CIs (from 800 to 3000 pps per channel) with asymmetric pulses may require the currents of two or more channels to be partially overlapping, possibly increasing interactions between channels. It is therefore important to estimate the relative effects of the two asymmetric phases on neural excitation. The present study reports the results from five single-channel experiments that compared the efficiency of several stimuli, focusing on DPS, and which manipulated pulse shape and width, electrode configuration, polarity, and pulse rate. Some of the experiments were motivated by a linear filter model, which predicted that DPS stimuli should indeed produce lower thresholds than PS or BP stimuli (Carlyon et al. 2005). This turns out to be the case, and we will compare the results of the threshold measurements to the specific predictions of the model.
Methods
Subjects
Twelve postlingually deafened adult users of the Clarion CII or HiRes 90K cochlear implants, manufactured by Advanced Bionics Corporation, participated in the study. Subject details are indicated in Table 1. Testing was carried out both in Belgium (S1–S4) and in the UK (S5–S12) and was in accordance with the Declaration of Helsinki (1975). It was approved by the K.U. Leuven Medical Ethical Committee, by the UGent Medical Ethical Committee, and by the Cambridge Local Research Ethics Committee. Subjects were paid for participating.
Table 1.
Biographical data of the 12 Clarion cochlear implant subjects (S1–S12) with age, duration of deafness (DD), and cochlear implant use (CI) in years and etiology
| Subject | Age (years) | DD (years) | CI (years) | Etiology |
|---|---|---|---|---|
| S1 | 41 | <0.5 | 3 | Meningitis |
| S2 | 60 | 3 | 2 | Unknown progressive |
| S3 | 54 | 7 | 1 | Congenital progressive |
| S4 | 42 | 4 | 1 | Unknown progressive |
| S5 | 61 | 18 | 3 | Unknown |
| S6 | 32 | 10 | 3 | Unknown |
| S7 | 52 | 1 | 4 | Meningitis |
| S8 | 55 | 4 | 4 | Genetic |
| S9 | 70 | <2 | 3 | Unknown sudden |
| S10 | 51 | 1 | 3 | Meningitis |
| S11 | 31 | 2 | 7 | Unknown progressive |
| S12 | 58 | 34 | 2 | Unknown progressive |
Overview of pulse shapes
Stimuli consisted of 400-ms pulse trains applied to a single channel of the implant located in the middle of the array. Pulse shape, polarity of the leading phase, rate, and phase width varied across experiments. For bipolar coupling, electrodes 9 and 11 were used, and pulse polarity is described in terms of the polarity of the more basal electrode. In monopolar mode, electrode 9 was the active electrode, and the ground was the case electrode. An overview of the pulse shapes is presented in Figure 1. Similarly to van Wieringen et al. (2005), the stimuli were named by acronyms: the first letters stand for the shape of the pulse (BP for biphasic, PS for pseudomonophasic, M for monophasic, DPS for delayed pseudomonophasic) and the subsequent letter for the leading polarity (A for anodic, C for cathodic). When the “ALT-” prefix was used, the leading polarity alternated from pulse to pulse. The ratio of duration between the long/low and the short/high phases of asymmetric pulse shapes (PS, ALT-PS, DPS, and ALT-DPS) was always 8.
Experimental platform and implant hardware
Software
All stimuli were presented via the APEX platform (Laneau et al. 2005), which controlled the Bionic Ear Data Collection System (BEDCS; Litvak, 2003). APEX uses the basic built-in functions of BEDCS. The stimuli were defined by their pulse shape, duration, rate, and phase width.
Current flow during the IPG
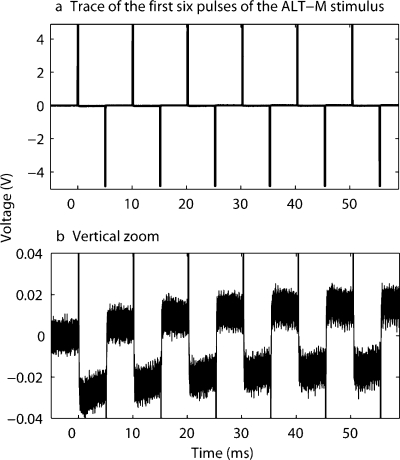
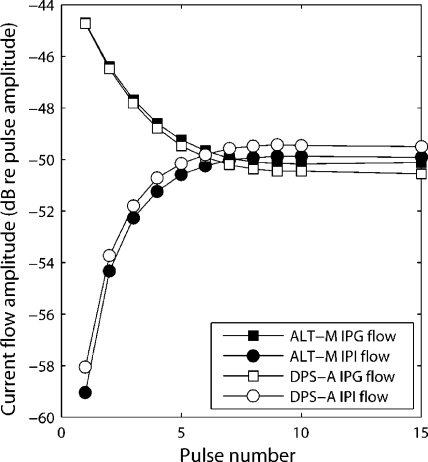
In two different studies using relatively long IPGs (van Wieringen et al. 2005; Carlyon et al. 2005), a low-amplitude current flowing during the gap was reported. Current flows are caused by the leakage of the charge accumulated on the DC-blocking capacitors of the implant. Measurement of this current was made with the Clarion CII device for an ALT-M pulse train with an IPG of 4.9 ms and for a DPS-A pulse train with an IPG of 4.7 ms. The stimuli had a total duration of 400 ms, a rate of 99 pps, and a phase width of 97 μs (the values used in experiments 1 and 2). Traces were measured across a 10-kΩ resistive load at the output of a test implant and averaged over 500 sweeps using a LeCroy LT344 digital oscilloscope. The first six pulses of the ALT-M stimulus are illustrated in Figure 2a. A vertical zoom in Figure 2b shows the evolution of the current flow during both the IPG and the interpulse interval (IPI). The polarity of the IPG flow is opposite to the polarity of the first phase of the pulse, and its amplitude is maximal for the first pulse. The polarity of the IPI flow is opposite to the polarity of the second phase of the pulse, and its amplitude increases with time. The absolute values of the current flow amplitudes are shown in Figure 3, as a function of pulse number, for the ALT-M and DPS-A stimuli. The flows measured during the IPG and the IPI are similar for the two pulse shapes and stabilize about 70 ms (7 pulses) after the stimulus onset. Their steady-state amplitude is approximately 50 dB lower than the corresponding pulse amplitude. This value is similar to the 52 dB measured by Carlyon et al. (2005) with the CI24 device using a 2.9-ms IPG and similar values of rate and phase width. In their study, they rejected the hypothesis that the threshold drops at long IPGs were a result of this low-amplitude current flow. Given the similarities of the current flow value in the Cochlear CI24 and in the Clarion CII devices, we assume that this current flow will not have a major impact on our results either.
Fig. 2.
Trace measured across a resistive load of 10 kΩ at the output of a test implant for the ALT-M stimulus with a 99-pps rate, a 97-μs phase width, and a 4.9-ms IPG. The requested pulse amplitude was 512 μA. The first 5 ms was used to correct for any DC offset due to the calibration equipment. (a) Trace for the first six pluses of the stimulus. (b) Vertical zoom.
Fig. 3.
Absolute value of the current flow amplitude, expressed in dB relative to the pulse amplitude, as a function of pulse number. Values are reported for the current flow during both the interphase gap (IPG) and the interpulse interval (IPI) and for two pulse shapes: ALT-M (same parameters as Fig. 2) and DPS-A (same rate and phase width as ALT-M and an IPG of 4.7 ms).
At higher rates of stimulation, similar behavior is observed except that the amplitude of the current flow is essentially lower. An identical analysis was performed with the DPS-A stimulus used in experiment 5 (22.6-μs phase duration and 813-pps rate). The maximal value of the flow (during the IPG of the first pulse of the stimulus) was 60 dB lower than the pulse amplitude.
As a safety check and similarly to previous studies (van Wieringen et al. 2005; Carlyon et al. 2005), we measured the impedances of the test electrodes in all subjects, both at the start and at the end of each session. No changes were noticed within or between sessions. Moreover, at no instance during or between the experiments did subjects report adverse effects following the measurements, and no long-term threshold changes were observed.
Intensity coding
The BEDCS software (Litvak, 2003) uses 8 bits to encode the intensity of stimulation, which means that, for a given current range, the implant can be stimulated at 256 discrete intensity levels. Four current ranges are available in BEDCS, each of them associated with a certain resolution (in μA): 0–255 (resolution: 1), 0–510 (2), 0–1020 (4), and 0–2040 (8). For “standard” BP stimulation, it is possible to use all the intensities of a given current range. However, with asymmetric pulse shapes (where the intensity of the long/low phase is eight times lower than the short/high one), the charge-balancing requirement means that the intensities of both phases must be exactly specified within the same current range. This results in a resolution decrease, the smallest current steps becoming 8, 16, 32, and 64 μA, respectively, for the four current ranges. Therefore, for a given range, the current step that we used was eight times larger in experiments involving PS and DPS stimuli than in those involving BP and ALT-M. As a consequence, standard deviations for thresholds and MCLs of asymmetric pulses (PS and DPS) were usually larger than those of BP or ALT-M. In all experiments, we tried to use a current range with a step size as small as possible to obtain the most accurate estimate.
Procedure
Threshold estimation
Thresholds were estimated by means of a two-down, one-up two-alternative forced choice adaptive procedure (Levitt, 1971). The intervals were indicated by two buttons flashing successively on a computer screen while the signal was played in one of them. Subjects were asked to identify which interval contained the signal by clicking on one of the two buttons. Feedback was presented after each response. Each estimate was obtained by averaging the last six reversals out of eight. Every threshold value presented here is the average of at least five estimates. Starting levels were set to approximately one third of the patient's dynamic range. The step size was eight current steps for the first two reversals and one current step for the last six reversals (cf. Experimental platform and implant hardware for the definition of a current step).
Most comfortable levels
In each experiment, the stimuli were balanced in loudness to a reference BP signal. The parameters of this reference signal varied from experiment to experiment and will be explicitly mentioned in Experiments. For each loudness balancing trial, two pulse trains were presented successively, the first being the reference and the second being the target to balance. Subjects could adjust the current level by pressing one of the six buttons (three to increase, three to decrease) until they perceived the levels to sound equal. Each button corresponded to a different step size (one, two, or three current steps). The experiment was repeated four times for each stimulus using various starting levels (below and above MCL).
Linear filter model
Several linear approaches have been used in the past to try to model the effects of pulse shape on electrical stimulation of nerve (van den Honert and Mortimer, 1979; Rubinstein et al. 2001; Carlyon et al. 2005). In experiments 1, 2, 4, and 5, threshold data were compared to the predictions of the linear filter model of Carlyon et al. This approach was chosen because it already predicted thresholds of cochlear implant users for several BP pulses with nonzero IPG using a fixed set of parameters. Each electrical stimulus submitted to the model is first low-pass-filtered. The filter is designed to match human sinusoidal threshold data and consists of a 2.5-order low-pass Butterworth filter with a cutoff frequency of 100 Hz and an attenuation outside the band pass of 15 dB/octave. To reduce the slope at higher frequencies, a double zero is added to the transfer function of the filter at a frequency of 200 Hz. Each filtered stimulus is then multiplied by a series of 20-ms overlapping Hanning windows. The start times of the windows are incremented in 0.5-ms steps, and the RMS of each window is calculated. Threshold is assumed to be inversely proportional to the maximum RMS output level of any window. The model predictions in decibels will be illustrated using an arbitrary reference for which the model threshold matches the mean threshold across subjects for the reference stimulus (identical to the reference stimulus of the loudness balancing task).
Experiments
Experiment 1: Effects of pulse shape with bipolar stimulation
Rationale and design
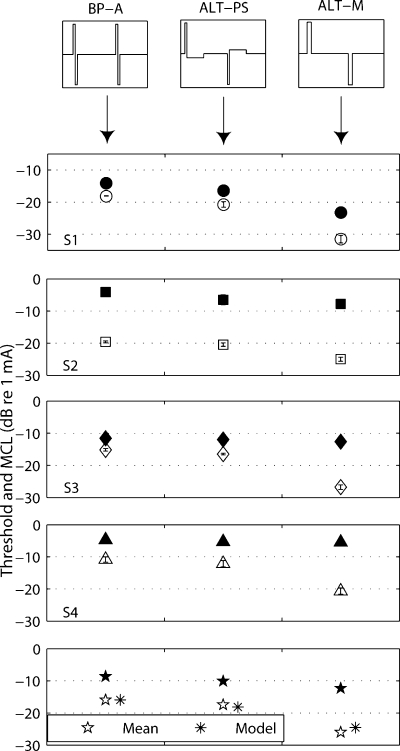
Experiment 1 was a preliminary study designed to replicate the data, reported by van Wieringen et al. (2005) with the LAURA implant, with the Clarion device. Four subjects (S1, S2, S3, and S4) participated in this experiment. Three pulse shapes, BP-A, ALT-M, and ALT-PS (Fig. 1a, b, and g), were presented in bipolar mode. The phase width (97 μs) and rate (198 pps for BP-A and ALT-PS, 99 pps for ALT-M) were similar to the ones used in their study. The rate for the ALT-M stimulus was half that for the BPA and ALT-PS stimuli, in order that the interval between successive short high-amplitude phases was the same for all conditions. The IPG of ALT-M was 4.9 ms. The ALT-PS and ALT-M stimuli were balanced in loudness to BP-A, which was our reference for this experiment.
Results
The results of the four subjects are shown in Figure 4. As reported by van Wieringen et al. the BP-A stimulus showed the highest thresholds, with a small (1.5-dB average) drop for the ALT-PS stimulus and a much larger (10-dB average) drop for the ALT-M stimulus. A one-way repeated-measures analysis of variance (ANOVA) on threshold data indicated that the factor pulse shape was significant [F(1,3) = 34.77, p = 0.01]. Subsequent pairwise comparisons showed that thresholds were significantly lower for ALT-PS (p = 0.03) and ALT-M (p = 0.01) than for BP-A. The most striking result was that the threshold of the ALT-PS stimulus was significantly higher than that of the ALT-M stimulus (p < 0.01). These two stimuli only differ by the presence of a long, low-amplitude phase of opposite polarity immediately following the short, high-amplitude phase in ALT-PS. Removing these long/low phases resulted in a threshold drop of, on average, 8.5 dB. This suggests that a recovery phase as long as eight times longer than the short/high phase still has a significant counteracting effect on the efficiency of stimulation. The threshold predictions of the filter model are shown in the bottom panel together with the across-subjects mean threshold and MCL data. The model follows the same trend as the mean data.
Fig. 4.
Thresholds (open symbols) and MCLs (filled symbols) of four subjects (S1–S4) for the three stimuli of experiment 1 presented in bipolar coupling mode (between electrodes 9 and 11). Bottom panel: across-subjects mean and threshold model predictions. The phase width is 97 μs; the rate is 198 pps for the BP-A and ALT-PS stimuli and 99 pps for the ALT-M. Error bars in all figures show standard deviation, but are in most cases smaller than the symbols.
For two subjects (S3 and S4), the MCLs remain similar for the different pulse shapes. Given the decrease in threshold, these subjects' dynamic ranges are larger for ALT-PS and ALT-M than for BP-A. A one-way repeated-measures ANOVA, applied on the MCLs of all subjects, did not reveal a significant effect of pulse shape [F(1,3) = 3.12, p = 0.1).
Experiment 2: Effects of pulse shape with monopolar stimulation
Rationale and design
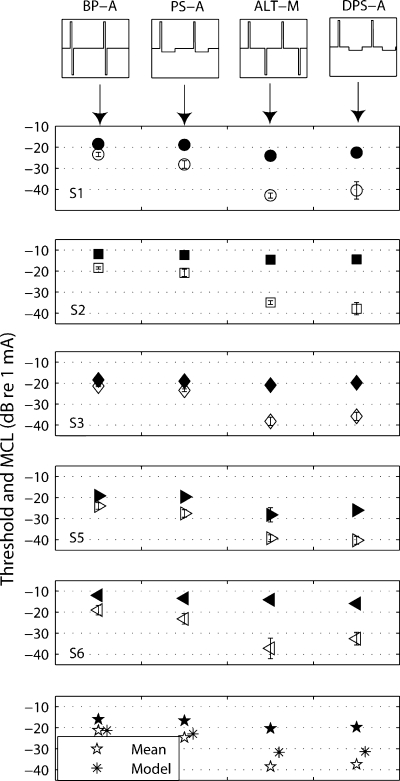
The filter model introduced by Carlyon et al. (2005) predicted that the DPS stimulus with a large IPG (up to several milliseconds) should lead to a much larger threshold reduction than a PS stimulus with no IPG. Experiment 2 tested this prediction for five subjects (S1, S2, S3, S5, and S6). For this and subsequent experiments, the electrode configuration was monopolar. Monopolar coupling is the most widely used mode of stimulation in cochlear implants, as it considerably reduces power consumption (relatively compared to bipolar) and has been shown to give better speech recognition scores by a number of patients (Pfingst et al. 1997). The four pulse shapes were BP-A, ALT-M, PS-A, and DPS-A (Fig. 1a–c and e). As in experiment 1, a 97-μs phase width and a relatively low rate (99 pps) were used because the linear filter model predicted larger effects of pulse shape at lower rates. The generality of the findings to higher pulse rates will be addressed in experiment 4. The reference signal for the loudness balancing task and for the model predictions was the 99-pps, 97-μs phase width BP-A stimulus presented in monopolar mode.
Results
The results of the five subjects are shown in Figure 5. As was found in experiment 1 with bipolar stimulation, thresholds (open symbols) were lower for the PS-A than for the BP-A stimulus (3.4-dB difference on average). More importantly, the delayed DPS-A stimulus resulted in threshold reductions similar to those of ALT-M (∼16 dB here). The absolute size of the thresholds for the DPS stimulus must be considered with some care because the level of the delayed long/low phase was often so small (a few microamperes) that accurate measures of the current source were precluded by noise present in the output of our test implant. This does not affect the main conclusion that thresholds were lower than with the BP-A and PS-A stimuli because, of course, the low levels reached only occurred because detection at higher levels was so easy. A one-way repeated-measures ANOVA showed that the factor pulse shape was highly significant [F(1,4) = 170.3, p < 0.001]. Subsequent pairwise comparisons between pulse shapes indicated BP-A to produce significantly higher thresholds than PS-A (p = 0.003), DPS-A (p < 0.001), and ALT-M (p < 0.001). However, no significant difference was found between DPS-A and ALT-M thresholds (p = 0.46). The model predictions (asterisks) follow the general pattern of data (pentagrams), although it underestimates the size of the drop for ALT-M and DPS-A (10 dB instead of 16).
Fig. 5.
Thresholds (open symbols) and MCLs (filled symbols) of five subjects (S1, S2, S3, S5, and S6) for the four stimuli of experiment 2 presented in monopolar coupling mode (electrode 9). Bottom panel: across-subjects mean and model predictions. The phase width is 97 μs; the rate is 99 pps.
An ANOVA performed on the MCL values (filled symbols) showed a significant main effect of condition [F(1,4) = 9.62, p = 0.036]. As with the threshold results, the MCL of BP-A was significantly higher than the MCLs of PS-A (p = 0.015), DPS-A (p = 0.015), and ALT-M (p = 0.029) stimuli (filled symbols). The reductions in MCL for the DPS-A and ALT-M stimuli compared to the BP-A stimulus were less than the corresponding threshold decreases, leading to a significant increase in dynamic range (p = 0.002 for DPS-A and p = 0.001 for ALT-M).
Experiment 3: Effects of polarity
Rationale and design
Auditory nerve (AN) recordings in animals have shown that pulse polarity can influence the efficacy of electrical stimulation of nerve fibers (Miller et al. 1998, 1999, 2004; Shepherd and Javel, 1999). Particularly, cathodic monophasic pulses have been found to be more effective than anodic ones. Of course, the safety requirement that stimuli should be charge-balanced precludes the use of monophasic pulses for human subjects. However, if, as is also suggested by AN recordings (Miller et al. 2001), thresholds for PS and DPS stimuli are dominated by the short, high-amplitude phase, then it is possible that polarity differences could be revealed using these asymmetric pulse shapes. This would provide a rationale for using the most efficient polarity in a speech processor. In experiment 3, effects of polarity on threshold and MCL were investigated using two asymmetric pulse shapes, PS and DPS, with the same five subjects as in experiment 2. Thresholds and MCLs for PS-A and DPS-A were compared to the corresponding measures for PS-C and DPS-C, using the same parameter values as in experiment 2, i.e., a 99-pps rate and a 97-μs phase width. To tease out possible interaction effects of rate and phase width with polarity, two supplementary sets of parameters were tested with subjects S1, S2, and S3. These two sets were (1) PS with a 198-pps rate and a 97-μs phase width and (2) PS with a 99-pps rate and a 32.4-μs phase width. For the MCL measures, every stimulus was balanced in loudness to the same BPA reference signal used in experiment 2.
Results
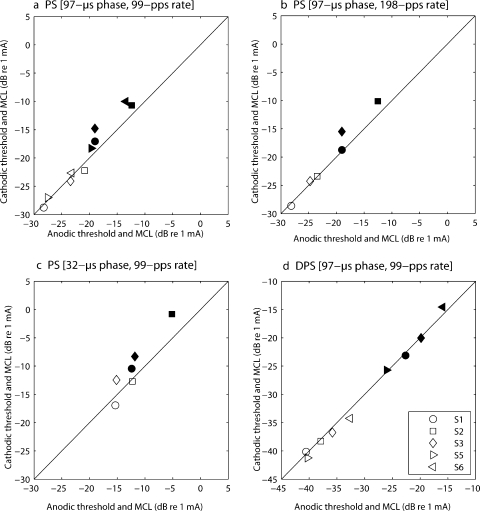
Thresholds (open symbols) and MCLs (filled symbols) of anodic vs. cathodic pulses are illustrated in Figure 6a–c for PS and in Figure 6d for DPS. The diagonal indicates equal sensitivity to anodic and cathodic stimulation. When the levels are higher for cathodic first stimuli, the values lie above the diagonal (and vice versa). No significant effect of polarity on threshold was observed, either with the PS or with the DPS stimuli. However, a paired-sample t test revealed that the MCLs were significantly higher for PS-C than for PS-A (df = 4, p = 0.01) in the condition “99-pps rate and 97-μs phase width” (cf. Fig. 6a). The mean difference was 2.5 dB and was consistent across subjects. It is opposite to that observed for threshold in animal AN recordings and will be discussed further in Discussion. The MCLs of PS-C were even significantly higher than those obtained with the BP-A stimulus of experiment 2 (p = 0.021). The two additional sets of parameters that were tested with subjects S1–S3 followed the same trend (cf. Fig. 6b and c). When the data for these three subjects were analyzed over the three conditions of phase width and rate in a two-way repeated-measures ANOVA, the main effect of polarity approached significance [F(1,2) = 14.8, p = 0.06] and did not differ significantly across conditions as revealed by the lack of an interaction between polarity and condition [F(1,2) = 1.1, p = 0.4]. Also, it should be noted that the polarity dependence of MCLs disappeared when the long/low phase was delayed (i.e., with DPS, Fig. 6d).
Fig. 6.
Effect of polarity on thresholds (open symbols) and MCLs (filled symbols) for various asymmetric stimuli presented in monopolar mode. Results of five subjects (S1, S2, S3, S5, and S6). Cathodic levels are plotted vs. anodic levels. All five subjects performed the comparison at a 97-μs phase width and a 99-pps rate [panel (a) for PS and panel (d) for DPS]. Three of them (S1–S3) did two additional PS conditions: (1) 97-μs phase width and 198-pps rate [panel (b)] and (2) 32-μs phase width and 99-pps rate [panel (c)].
Experiment 4: Combined effects of rate and phase width
Rationale and design
The stimuli used in experiments 1, 2, and 3 cannot be effectively implemented in a speech processing strategy because of their relatively low rate and/or relatively long phase width. In experiment 4, thresholds and MCLs of BP-A and DPS-A were measured at higher rates and shorter phase widths for four subjects (S1, S2, S3, and S5). The stimulus period, phase width, and IPG were systematically covaried by the same proportion leading to a net AC charge constant over the different rate stimuli. The polarity of the leading phase was always anodic. The rate values were 100, 223, 446, and 892 pps. A summary of the parameter values (rate, phase width, and IPG) is shown in Table 2. Stimuli were balanced in loudness to the same BP-A reference already used in experiments 2 and 3.
Table 2.
Summary of parameters used in experiment 4
| Rate (pps) | Period (ms) | Phase width (μs) | IPG (ms) |
|---|---|---|---|
| 99 | 10.1 | 97.0 | 4.7 |
| 223 | 4.5 | 43.1 | 2.1 |
| 446 | 2.2 | 21.6 | 1.0 |
| 892 | 1.1 | 10.8 | 0.52 |
The four conditions were tested using two pulse shapes: BP-A and DPS-A.
Results
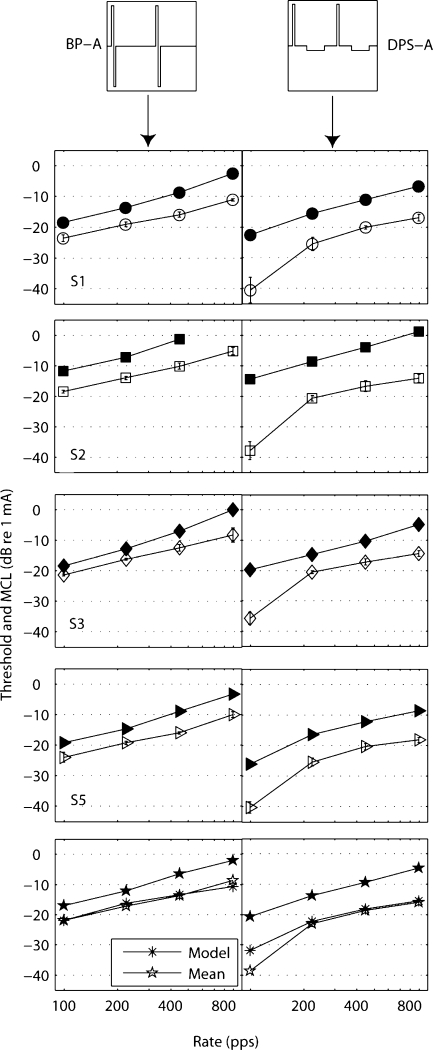
The left and right columns of Figure 7 show thresholds (open symbols) and MCLs (filled symbols) for the BP-A and DPS-A stimuli, respectively. Thresholds and MCLs decreased as rate decreased and phase width increased for both pulse shapes. However, the drop at the lowest rate (99 pps) was much larger than that of other rates.
Fig. 7.
Thresholds (open symbols) and MCLs (filled symbols) of BP-A (left column) and DPS-A (right column) pulses as a function of rate. Results of four subjects (S1, S2, S3, and S5). Bottom panels: across-subjects mean and model predictions of threshold. The values of the stimuli parameters can be found in Table 2. The MCL value of subject S2 for the highest rate condition with BP-A is missing because of compliance issues.
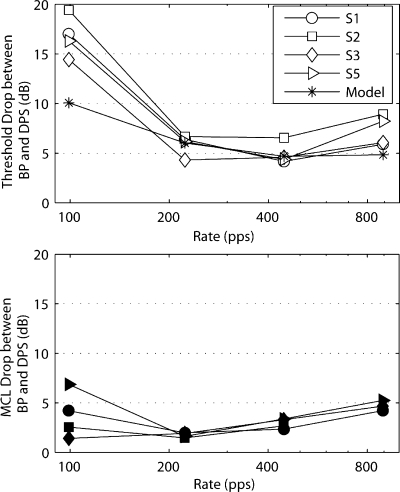
To illustrate the improvements obtained with the DPS-A stimulus, the threshold and MCL decreases, relative to the values obtained with BP-A pulse trains, are shown in the top and bottom panels of Figure 8. It can be seen that, even at a rate (892 pps) and a phase width (10.8 μs) within the range of parameters typically used in each channel of a CI, thresholds were significantly lower for the DPS-A stimulus (7-dB drop on average). A two-way repeated-measures ANOVA on threshold data showed the factors pulse shape [F(1,3) = 189.4, p = 0.001], rate [F(1,3) = 2409, p < 0.001], as well as their interaction [F(1,3) = 142.9, p = 0.001] to be significant. In an identical analysis with the first data point removed (99-pps rate and 97-μs phase width), the interaction was not significant anymore [F(1,3) = 8.00, p = 0.066]. A two-way repeated-measures ANOVA with the four MCL values showed significant effects of pulse shape [F(1,2) = 61.5, p = 0.016] and rate [F(1,2) = 553.6, p = 0.002], but not of their interaction [F(1,2) = 2.52, p = 0.25].
Fig. 8.
Threshold (top figure) and MCL (bottom figure) drops between BP-A and DPS-A as a function of rate. Results of four subjects (S1, S2, S3, and S5) and model predictions. The values of the stimuli parameters can be found in Table 2.
Once more, the filter model (bottom panels of Figs. 7 and 8) captured the important trends in the data: thresholds increase with increasing pulse rate, thresholds are lower with DPS than with BP stimuli, and this advantage is reduced but still present at the highest rates tested. In terms of the model, the threshold increase at high pulse rates occurred because phase width decreased with increasing rate, and to the resulting fast fluctuations being attenuated by the low-pass filter. This overcame the fact that more pulses fell within the model's 20-ms integration window at higher rates. The advantage for the DPS waveform arose because the waveform fluctuated more slowly than for the BP stimulus.
Experiment 5: Relative phase contributions of DPS
Rationale and design
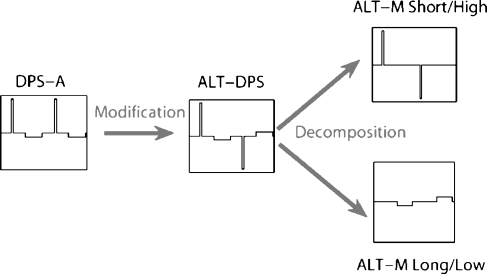
Experiment 5 was designed to tease out relative effects of the two different phases of the DPS stimulus. As pointed out in Introduction, the feasibility of using a DPS stimulus in a speech processor depends on the short/high phase producing substantially more neural excitation than the long/low phase. To investigate this, we used a modification of the DPS stimulus in which the polarity of each phase alternated from pulse to pulse. Figure 9 shows that this “ALT-DPS” stimulus can be viewed as the sum of two alternating-monophasic (ALT-M) pulse trains of different amplitudes and phase widths. Although this decomposition makes the simplistic assumption that the electrode/neuron interface is linear and time-invariant, thereby neglecting refractory and residual potential effects, the comparison of these stimuli may indicate which of the two phases has the larger effect on neural excitation. Thresholds and MCLs of the ALT-DPS stimulus were first compared to those of the DPS-A and BP-A stimuli to determine whether it offered similar advantages over BP-A as obtained with the DPS-A pulse. We then compared the thresholds and MCLs for the two ALT-M stimuli to determine which phase width was more effective. As in experiment 4, the stimuli parameters were chosen to fall within the range of values used in each channel of a CI speech processor (813-pps rate and 21.6 and 172.4-μs phase widths). The rate of the two ALT-M stimuli (407 pps) was half the rate of BP-A, DPS-A, and ALT-DPS (813 pps), so that the interval between successive short high-amplitude phases was the same for all conditions (cf. experiment 1). For the loudness balancing task, DPS-A, ALT-DPS, and the two ALT-M stimuli were compared to the 813-pps, 21.6-μs phase width, with BP-A stimulus taken as the reference for this experiment. Six subjects (S7–S12) participated in this experiment.
Fig. 9.
Stimulus decomposition used in experiment 5.
Results
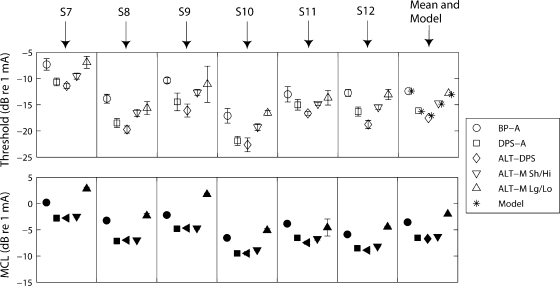
The open symbols in Figure 10 (top panel) show that the threshold for the DPS-A (squares) and ALT-DPS (diamonds) stimuli were consistently lower than for the BP-A stimulus (circles). The average threshold drop from BP-A to DPS-A was 3.7 dB and that from BP-A to ALT-DPS was 5.7 dB. A repeated-measures ANOVA showed the factor pulse shape to be highly significant [F(1,5) = 68.8, p < 0.001). Pairwise comparisons revealed that the average 3.7-dB threshold decrease from BP-A to DPS-A was also highly significant (p < 0.001), and that the ALT-DPS produced significantly lower thresholds than did the DPS-A stimulus (p = 0.003). The thresholds of the ALT-M short/high and long/low components were 2.8 and 4.7 dB higher, respectively, on average than the ALT-DPS threshold (Fig. 10, top panel). These differences were highly significant (p < 0.001), indicating that both phases contributed to detection. However, thresholds for the short/high phase (inverted triangles) were significantly lower than for the long/low phase (upright triangles; p = 0.002). This suggests that the short/high component dominates at threshold, but that the long/low one still has a significant effect. The asterisks in the far right panel show that the filter model captures this trend. It predicts thresholds of the ALT-M short/high and long/low stimuli to be 2.2 and 4.0 dB lower, respectively, than the ALT-DPS one.
Fig. 10.
Thresholds (top figure) and MCLs (bottom figure) of six subjects (S7–S12), across-subjects mean, and model predictions (asterisks) of threshold for the five stimuli of experiment 5. The duration of the short/high phase is 21.6 μs, the duration of the long/low phase is 172.4 μs, and the rate is 813 pps for BP-A, DPS-A, and ALT-DPS and 407 pps for the two ALT-M stimuli.
Identical analysis with MCLs (Fig. 10, bottom panel) indicated that the factor pulse shape was significant [F(1,5) = 17.8, p = 0.008]. The MCL of DPS-A was significantly lower (3.0 dB on average) than that one of BP-A (p < 0.001). Moreover, no significant difference was found between DPS-A and ALT-DPS (p = 0.37). Here, the short/high phase more completely dominated loudness: MCLs for the short/high ALT-M were 3.4 dB lower than for the long/low one (p = 0.016) and differed from the ALT-DPS stimulus by only 0.4 dB (p = 0.043).
These results show that short-duration pulses are more efficient than long-duration ones using the ALT-M pulse shape with relatively short phase widths (21.6 and 172.4 μs). This is similar to what has been observed in BP stimulation for phase widths up to 500 μs (Moon et al. 1993).
Discussion
Safety of stimulation pulse shapes
The first electrochemical requirement for a safe neural stimulation is chemical reversibility (Robblee and Rose, 1990; Brummer and Turner, 1977). It implies that all processes occurring at an electrode subjected to a pulse are reversed by a pulse of opposite polarity. Irreversible reactions such as electrode dissolution or water electrolysis can occur following a large charge injection and cannot be effectively reversed because some of their products migrate away from the electrode surface. Monophasic stimulation and, more generally, any DC current can lead to neural damage because charge is being accumulated until it initiates irreversible chemical reactions. Shepherd et al. (1999) found a significant reduction in AN fibers of the cat subjected to chronic stimulation by noncharge balanced stimuli having DC levels as low as 0.4 μA. In another study, noncharge balanced BP stimuli were found to produce new bone growth throughout all turns of the cochlea (Shepherd et al. 1991). The limits for a safe charge injection are dependent on the electrode material, the electrode surface area, and the stimulation pulse shape (Robblee and Rose, 1990). The Clarion HiFocus II electrode array consists of 16 Platinum/Iridium electrodes having a geometrical surface area of 0.2 mm2. The highest charge per phase delivered in our experiments reached 0.06 μC for a bipolar, BP pulse train (subject S2 in experiment 1). Expressed in units of charge density, this is equivalent to a charge injection of approximately 30 μC/cm2 per phase, which is below the limit for chemical reversibility. As a matter of comparison, Robblee and Rose (1990) determined this limit to be equal to 74 μC/cm2 per phase for a 0.28-mm2 Platinum electrode driven by a 0.2-ms phase width BP pulse. As a consequence of lower threshold and MCL values, the injected charge per phase was lower for all the other stimuli used in the present study.
The stimulation pulse shape itself also plays a role in the safety of stimulation. We have used asymmetric pulses (PS and DPS) as well as BP pulses with IPGs up to 4.9 ms (ALT-M and DPS). Asymmetric pulses such as PS-C and DPS-C are believed to increase the limit of safe charge injection compared to a symmetric BP pulse (Robblee and Rose, 1990). Moreover, ALT-M pulses with a 40-ms IPG have been found to postpone nerve fatigue compared to BP pulses with an 800-μs IPG in electrical stimulation of the dog's phrenic nerve (Tanae et al. 1973). ALT-M pulses with an IPG of 5.7 ms have also been used in a chronic study using guinea pigs implanted with an extracochlear electrode on the round window (Charlet de Sauvage et al. 1997). The authors did not report any adverse effects of using ALT-M pulses on the auditory functions and suggested that this pulse shape could be safely used in inner-ear stimulation.
Finally, it should be mentioned that neural damage can depend on the specific characteristics of the tissue being stimulated. However, to our knowledge, there is no evidence in the literature of any of the pulse shapes used in the present study to be potentially more damaging than a standard symmetric BP pulse. Furthermore, as mentioned in an earlier section, our use of novel pulse shapes in the present experiments did not result in any impedance or threshold changes.
Spike initiation site
Potential sites of spike initiation in spiral ganglion cells have been reviewed by Javel and Shepherd (2000). They identified five sites: two at the level of the hair cells arising from electrophonic excitation, two on the myelinated and unmyelinated portions of the peripheral spiral ganglion cell process, and one at a more central locus. As cochlear implant subjects do not have many functioning hair cells, the first two sites are probably not involved in cochlear implant stimulation.
The remaining question is whether spike initiation occurs at the peripheral site, at the central site, or at both sites of the spiral ganglion cells. Two physiological studies with cats report that neural activation is possible at both sites (Shepherd and Javel, 1999; Miller et al. 1999). Moreover, these experimenters measured lower threshold and lower saturation levels for monophasic cathodic pulses than for anodic ones. To our knowledge, anodic monophasic pulses yielding lower thresholds than cathodic ones have only been reported by Miller et al. (1998). They found this trend to occur in electrically evoked compound action potentials of guinea pigs. They observed the opposite (and “usual”) trend in cats.
Our results fail to show the common pattern of lower cathodic thresholds as we did not find any significant effect of polarity on thresholds of the two asymmetric pulses (PS and DPS). More importantly, the MCL for cathodic PS pulses was 2.5 dB higher than for anodic ones. These findings depended neither on phase width nor on rate and are the opposite of what would be expected from the single-unit animal recordings. Two possible explanations are suggested by modeling studies (Frijns et al. 1996; Rattay et al. 2001). Rattay et al. used a physiologically based model to evaluate the effects of polarity on both monophasic and BP stimuli. Simulations of neurons with peripheral axons produced lower thresholds for cathodic monophasic pulses both in human and cat models. However, simulations without peripheral axons produced lower thresholds for anodic pulses than for cathodic ones in humans (the difference was about 8 dB) and not in cats. This suggested that central processes were more sensitive to anodic stimulation in human subjects. Combined with the fact that peripheral processes are believed to be somewhat degenerated in deaf people (Linthicum et al. 1991; Spoendlin and Schrott, 1989), this suggests that patients' MCLs may have been determined by anodal stimulation of central processes. Evidence for a spike initiation site central to the soma has been found experimentally in rat cortical neurons subjected to monophasic cathodic stimulation (Nowak and Bullier, 1998a,b) and in a computational model of central neurons (McIntyre and Grill, 1999). In this same study, McIntyre and Grill showed that monophasic anodic pulses yielded lower thresholds than cathodic ones when the stimulating electrode was placed over the dendrite or over the soma (situation probably comparable to cochlear implant stimulation), but not when the electrode was placed over the central axon. However, it has to be mentioned that the dendrite was simply modeled as a passive compartment and therefore was not determinant in neural activation. Although these several studies pointed out differences between anodic and cathodic stimulation at threshold level, the data presented here did not show such a difference. It is not clear why this effect should be apparent with PS but not with DPS stimuli, and at MCL but not at threshold level, and so the central site activation hypothesis should be considered tentative. Another possibility is that, at high levels of cathodic stimulation, spike conduction is blocked by the strong hyperpolarization of a more central part of the fiber. In this hypothesis, the intensity of stimulation would need to be further increased to recruit more fibers (located further from the electrode) and to eventually achieve a most comfortable listening level. This phenomenon of “cathodal blocking” has been observed by Frijns et al. (1996) in modeled fibers subjected to cathodic monophasic and pseudomonophasic stimulation.
Application to speech processing strategies
We have shown that DPS stimuli presented on a single channel of a cochlear implant produce lower thresholds and MCLs than the commonly used BP stimuli at pulse rates and phase widths similar to those implemented in each channel of a CI speech processor. As mentioned in Introduction, the current sources of the Clarion implant are capacitively coupled and induce a current flow during successive phases of a DPS stimulus. At such high rates, however, the mean value of the flow will remain low (<60 dB lower than the pulse amplitude using the parameters of experiment 5), and electrical interactions between channels should be limited. Moreover, because perception seems to be mainly dominated by one phase of each DPS pulse, it may be possible for the long, low-amplitude phase to recover charge without producing unwanted neural activity. In this case, interactions between channels using DPS pulses should also be minimized, and it is possible that DPS stimuli could be incorporated into a speech processing strategy and to achieve worthwhile power savings. A decrease of 6 dB in thresholds and MCLs (i.e., using DPS instead of BP with the parameters of the highest rate condition tested in experiment 4) on every channels of the device would save more than half of the power consumed in the stimulation pulses. As next generations of cochlear implants will be optimized for a low-power consumption of the electronics part, the proportion of power needed for stimulation should increase, and this will increase the proportion of total power consumption to be saved by implementing more efficient pulse shapes. As mentioned in Introduction, a potential additional advantage of DPS arises from improved spatial selectivity, and these are currently under investigation in our laboratories.
Most of the speech processing strategies available in commercial devices make use of interleaved stimulation (Wilson et al. 1991) where each channel is stimulated subsequently. This type of strategy has been shown to reduce channel interactions (Favre and Pelizzone, 1993), although some nonsimultaneous interactions can still occur (de Balthasar et al. 2003; Middlebrooks, 2004). Because the DPS pulse shape necessarily contains a long, low-amplitude phase, then to completely avoid any simultaneous stimulation, one would have to use slower pulse rates than would be required with BP waveforms. However, the amplitude of the long-duration phase is generally low, and within-channel interactions could be further minimized by allowing simultaneous stimulation only on electrodes that are remote from each other (cf. Bonnet et al. 2004). We have recently implemented such a strategy and are currently testing its performance.
Summary of results
Thresholds and MCLs measured in bipolar mode with Clarion subjects for several pulse shapes (BP-A, ALT-PS, and ALT-M) were comparable to the results obtained with the Laura device in a previous study (van Wieringen et al. 2005).
At a relatively low rate (99 pps) and long phase width (97 μs), long IPGs produced the largest threshold drops both in bipolar and in monopolar (up to 16 dB) modes. The size of this drop did not change when the second phase of the pulse was lengthened and lowered (no difference between DPS and ALT-M). The PS stimulus provided a much smaller and subject-dependent threshold drop (0–3 dB).
The polarity of the leading phase did not have an effect on the thresholds of PS and DPS. However, the PS-A stimuli had lower MCLs (2.5 dB) than the PS-C ones. This observation was true for several values of rate and phase width and suggests that the neural activation site may be located at a central part of the spiral ganglion cell. No difference was found between DPS-A and DPS-C.
The magnitude of the threshold drop between BP-A and DPS-A reduced when the rate was increased and the phase width decreased. However, the size of the drop was still substantial (7 dB on average) at a rate of 892 pps, similar to that implemented in each channel of the CIS speech processing strategy by the Clarion cochlear implant.
A relative comparison of the thresholds and MCLs of the short, high-amplitude and of the long, low-amplitude phases of the ALT-DPS stimulus suggested that the short/high phase was more effective, both at threshold level and (more clearly) at MCL.
A linear threshold model predicted the relative trends of our threshold data for a wide range of stimuli (concerning pulse shape, rate, and phase width).
Acknowledgments
We would like to thank the subjects who participated in this study. We thank Prof. I. Dhooge, E. de Vel (University of Ghent), and T. Nunn (St Thomas' Hospital, London) for their help in recruiting implant users. We also thank Dr. F. Vanpoucke from Advanced Bionics for providing his help on software tools. This research was supported by the Fonds voor Wetenschappelijk Onderzoek FWO-Vlaanderen (FWO G.0233.01) and the Research Council of the Katholieke Universiteit Leuven (OT/03/58).
References
- Bonnet RM, Frijns JH, Peeters S, Briaire JJ. Speech recognition with a cochlear implant using triphasic charge-balanced pulses. Acta Oto-laryngol. 124:371–375, 2004. [DOI] [PubMed]
- Brummer SB, Turner MJ. Electrochemical considerations for safe electrical stimulation of the nervous system with platinum electrodes. IEEE Trans. Biomed. Eng. 24:59–63, 1977. [DOI] [PubMed]
- Carlyon RP, van Wieringen A, Deeks JM, Long CJ, Lyzenga J, Wouters J. Effect of inter-phase gap on the sensitivity of cochlear implant users to electrical stimulation. Hear. Res. 205:210–224, 2005. [DOI] [PubMed]
- Charlet de Sauvage R, Lima da Costa D, Erre JP, Aran JM. Electrical and physiological changes during short-term and chronic electrical stimulation of the normal cochlea. Hear. Res. 110:119–134, 1997. [DOI] [PubMed]
- De Balthasar C, Boex C, Cosendai G, Valentini G, Sigrist A, Pelizzone M. Channel interactions with high-rate biphasic electrical stimulation in cochlear implant subjects. Hear. Res. 182:77–87, 2003. [DOI] [PubMed]
- Declaration of Helsinki. Recommendations guiding medical doctors in biomedical research involving human subjects. Adopted by the 18th World Medical Assembly, Helsinki, Finland, 1964 and revised by the 29th World Medical Assembly, Tokyo, Japan in 1975.
- Eddington DK, Tierney J, Noel V, Hermann B, Whearty M, Finley CC. Speech processors for auditory prostheses. Ninth quarterly progress report, NIH contract N01-DC-2-1001, 2004.
- Favre E, Pelizzone M. Channel interactions in patients using the Ineraid multichannel cochlear implant. Hear. Res. 66:150–156, 1993. [DOI] [PubMed]
- Fishman KE, Shannon RV, Slattery WH. Speech recognition as a function of the number of electrodes used in the SPEAK cochlear implant speech processor. J. Speech Lang. Hear. Res. 40:1201–1215, 1997. [DOI] [PubMed]
- Friesen LM, Shannon RV, Baskent D, Wang X. Speech recognition in noise as a function of the number of spectral channels: comparison of acoustic hearing and cochlear implants. J. Acoust. Soc. Am. 110:1150–1163, 2001. [DOI] [PubMed]
- Friesen LM, Shannon RV, Cruz RJ. Effects of stimulation rate on speech recognition with cochlear implants. Audiol. Neuro-otol. 10:169–184, 2005. [DOI] [PubMed]
- Frijns JHM, de Snoo SL, ten Kate JH. Spatial selectivity in a rotationally symmetric model of the electrically stimulated cochlea. Hear. Res. 95:33–48, 1996. [DOI] [PubMed]
- Javel E, Shepherd RK. Electrical stimulation of the auditory nerve. III. Response initiation sites and temporal fine structure. Hear. Res. 140:45–76, 2000. [DOI] [PubMed]
- Laneau J, Boets B, Moonen M, van Wieringen A, Wouters J. A flexible auditory research platform using acoustic or electric stimuli for adults and young children. J. Neurosci. Methods 142:131–136, 2005. [DOI] [PubMed]
- Levitt H. Transformed up-down methods in psychoacoustics. J. Acoust. Soc. Am. 49:467–477, 1971. [DOI] [PubMed]
- Linthicum FH Jr, Fayad J, Otto SR, Galey FR, House WF. Cochlear implant histopathology. Am. J. Otol. 12:245–311, 1991. [PubMed]
- Litvak L. BEDCS Bionic Ear Data Collection System. Version 1.16, user manual, 2003.
- McIntyre CC, Grill WM. Excitation of central nervous system neurons by nonuniform electric fields. Biophys. J. 76:878–888, 1999. [DOI] [PMC free article] [PubMed]
- McIntyre CC, Grill WM. Extracellular stimulation of central neurons: influence of stimulus waveform and frequency on neuronal output. J. Neurophysiol. 88:1592–1604, 2002. [DOI] [PubMed]
- McKay CM, Henshall KR. The perceptual effects of interphase gap duration in cochlear implant stimulation. Hear. Res. 181:94–99, 2003. [DOI] [PubMed]
- Middlebrooks JC. Effects of cochlear–implant pulse rate and inter-channel timing on channel interactions and thresholds. J. Acoust. Soc. Am. 116:452–468, 2004. [DOI] [PubMed]
- Miller CA, Abbas PJ, Rubinstein JT, Robinson BK, Matsuoka AJ, Woodworth G. Electrically evoked compound action potentials of guinea pig and cat: responses to monopolar, monophasic stimulation. Hear. Res. 119:142–154, 1998. [DOI] [PubMed]
- Miller CA, Abbas PJ, Robinson BK, Rubinstein JT, Matsuoka AJ. Electrically evoked single-fiber action potentials from cat: responses to monopolar, monophasic stimulation. Hear. Res. 130:197–218, 1999. [DOI] [PubMed]
- Miller CA, Robinson BK, Rubinstein JT, Abbas PJ, Runge-Samuelson CL. Auditory nerve responses to monophasic and biphasic electric stimuli. Hear. Res. 151:79–94, 2001. [DOI] [PubMed]
- Miller CA, Abbas PJ, Hay-McCutcheon MJ, Robinson BK, Nourski KV, Jeng FC. Intracochlear and extracochlear ECAPs suggest antidromic action potentials. Hear. Res. 198:75–86, 2004. [DOI] [PubMed]
- Moon AK, Zwolan TA, Pfingst BE. Effects of phase duration on detection of electrical stimulation of the human cochlea. Hear. Res. 67:166–178, 1993. [DOI] [PubMed]
- Nowak LG, Bullier J. Axons, but not cell bodies, are activated by electrical stimulation in cortical gray matter. I. Evidence from chronaxie measurements. Exp. Brain Res. 118:477–488, 1998a. [DOI] [PubMed]
- Nowak LG, Bullier J. Axons, but not cell bodies, are activated by electrical stimulation in cortical gray matter. II. Evidence from selective inactivation of cell bodies and axon initial segments. Exp. Brain Res. 118:489–500, 1998b. [DOI] [PubMed]
- Pfingst BE, Zwolan TA, Holloway LA. Effects of stimulus configuration on psychophysical operating levels and on speech recognition with cochlear implants. Hear. Res. 112:247–260, 1997. [DOI] [PubMed]
- Rattay F, Lutter P, Felix H. A model of the electrically excited human cochlear neuron. I. Contribution of neural substructures to the generation and propagation of spikes. Hear. Res. 153:43–63, 2001. [DOI] [PubMed]
- Robblee LS, Rose TL. Electrochemical guidelines for selection of protocols and electrode materials for neural stimulation. In: Agnew WF and McCreery DB (eds) Neural Prostheses: Fundamental Studies. Prentice Hall, New Jersey, pp. 25–66, 1990.
- Rubinstein JT, Miller CA, Mino H, Abbas PJ. Analysis of monophasic and biphasic electrical stimulation of nerve. IEEE Trans. Biomed. Eng. 48:1065–1070, 2001. [DOI] [PubMed]
- Shepherd RK, Javel E. Electrical stimulation of the auditory nerve: II. Effect of stimulus waveshape on single fibre response properties. Hear. Res. 130:171–188, 1999. [DOI] [PubMed]
- Shepherd RK, Matsushima J, Millard RE, Clark GM. Cochlear pathology following chronic electrical stimulation using non charge balanced stimuli. Acta Oto-laryngol. (Stockh) 111:848–860, 1991. [DOI] [PubMed]
- Shepherd RK, Linahan N, Xu J, Clark GM, Araki S. Chronic electrical stimulation of the auditory nerve using non-charge-balanced stimuli. Acta Oto-laryngol. (Stockh) 119:674–684, 1999. [DOI] [PubMed]
- Spoendlin H, Schrott A. Analysis of the human auditory nerve. Hear. Res. 43:25–38, 1989. [DOI] [PubMed]
- Tanae H, Holcomb WG, Yasuda R, Hogan JF, Glenn WWL. Electrical nerve fatigue: advantages of an alternating bidirectional waveform. J. Surg. Res. 15:14–21, 1973. [DOI] [PubMed]
- van den Honert C, Mortimer JT. The response of the myelinated nerve fiber to short duration biphasic stimulating currents. Ann. Biomed. Eng. 7:117–125, 1979. [DOI] [PubMed]
- van Wieringen A, Carlyon RP, Laneau J, Wouters J. Effects of waveform shape on human sensitivity to electrical stimulation of the inner ear. Hear. Res. 200:73–86, 2005. [DOI] [PubMed]
- Wilson BS, Finley CC, Lawson DT, Wolford RD, Eddington DK, Rabinowitz WM. Better speech recognition with cochlear implants. Nature 352:236–238, 1991. [DOI] [PubMed]


