Abstract
Electrically evoked otoacoustic emissions (EEOAEs) are sounds measured in the ear canal when alternating current (AC) stimulation is passed into the cochlea. These sounds are attributed to the motile responses of outer hair cells (OHCs). The EEOAE has characteristic amplitude, phase, and fine structure. Multicomponent analysis of the EEOAE shows short (SDC) and long delay components (LDC) that are thought to originate from OHCs near the AC stimulating site and from OHCs at more remote locations, respectively. We measured the effects of various loud noise exposures on the EEOAE and the cochlear whole-nerve action potential (CAP) in animals chronically implanted with a scala tympani electrode. Noise exposures that produced permanent (PTS) or temporary threshold shifts (TTS) were associated with frequency-specific changes in CAP thresholds, EEOAE fine structure, and reductions in the amplitude of the LDC. A frequent observation in this study was an increase in the overall EEOAE amplitude after the noise exposure. The increase was correlated with increased SDC amplitude. The SDC was present in animals chemically treated with ototoxic drugs and mechanical damage to the cochlea. The SDC was eliminated after disarticulation of the ossicular chain. The presence of EEOAE fine structure in the postexposure response is an indicator of TTS in advance of CAP recovery. The results suggest that the EEOAE might be used to differentiate the mechanisms associated with TTS and PTS.
Keywords: hearing, otoacoustic emission, cochlea, EEOAE, acoustic trauma
Introduction
Acoustic trauma results in hearing loss that can lead to a temporary threshold shift (TTS), where complete recovery is achievable, or to some degree of permanent threshold shift (PTS); however, it is difficult to determine which will happen at the time of exposure. The structures affected by acoustic trauma within the cochlea may include hair cells, supporting structures, stria vascularis, and the afferent nerve terminals. Mechanisms for noise-induced damage include mechanical damage, ischemia, excitotoxic damage, metabolic fatigue, and ionic imbalance (for reviews, see Willott 1991; Borg et al. 1995). Prime targets of traumatizing noise are the soma and stereocilia of the outer hair cell (OHC), presumably the mediators of the so-called cochlear amplifier (Davis 1983).
The isolated OHC is capable of length changes in response to alternating current (AC) stimulation (Brownell et al. 1985; Kachar et al. 1986). These length changes are one likely source of acoustically evoked otoacoustic emissions (Kemp 1978; Kim 1980; Mountain 1980). Intracochlear AC stimulation produces sound in the ear canal as electrically evoked otoacoustic emissions (EEOAE) (Hubbard and Mountain 1983; Mountain and Hubbard 1989; Murata et al. 1991; Ren and Nuttall 1995).
Nuttall and Ren (1995) showed that round window (RW) AC stimulation produced a forward traveling wave along the basilar membrane (BM) resulting in BM vibration apical to the site of current injection and a reverse traveling wave resulting in a broadband response in the ear canal. Ear canal pressure with a restricted bandwidth was observed for intracochlear AC stimulation (Nuttall et al. 2001) with stimulation from the first turn to the apex. For RW AC stimulation, there was evidence that the EEOAE resulted from activation of more than one site within the cochlea (Ren and Nuttall 2000; Zheng et al. 2001; Nuttall et al. 2001; Zou et al. 2003). Multicomponent analysis (Ren et al. 2000) showed a short delay component (SDC) and a long delay component (LDC) in the RW EEOAE. The source of the SDC was thought to be direct electrical excitation of OHCs near the RW stimulating electrode. The source of the LDC was presumed to be OHC-mediated, arising from a location on the basilar membrane near the best location corresponding to the excitation frequency. The EEOAE is also characterized by fine structure (Ren and Nuttall 2000), where fine structure is loosely defined as fluctuations in the EEOAE amplitude spectrum occurring on the order of 1–2 kHz. Scattering from inhomogeneities in the cochlea has been proposed as another potential source of fine structure in the acoustically evoked otoacoustic emissions (Shera and Guinan 1999), which may be the same for the EEOAE (Ren and Nuttall 2000). Several studies have demonstrated the vulnerability of the EEOAE through various methods. However, Murata et al. (1991) showed that the EEOAE was less susceptible to insult than distortion-producing mechanisms. They also demonstrated that the EEOAE was reduced by crossed olivocochlear bundle (COCB) stimulation after exposure to a “fatiguing” sound. Chemicals (furosemide, paraformaldehyde, quinine, carboplatin, 4-aminopiridine) also altered the EEOAE (Nuttall and Ren 1995; Ren and Nuttall 1998; Ren and Nuttall 2000; Kirk 2001; Zheng et al. 2001; Reyes et al. 2001) as did death (Nuttall et al. 2001) and acoustic stimulation (Ren 1996; Nakajima et al. 1996; Nakajima et al. 1998; Ren and Nuttall 1998; Nakajima et al. 2000; Zou et al. 2003). Vulnerability of the EEOAE demonstrated in these studies strongly point to the OHC as a main source of the response.
The results of Murata et al. (1991) suggest that the EEOAE may be more resilient than a traditional cochlear response measure such as the cochlear whole-nerve action potential (CAP). As such, the EEOAE may invoke an OHC mode of activity different from acoustic stimulation. Can AC stimulation of the cochlea predict the effects of acoustic trauma in terms of a resultant TTS or PTS? This study explores the effects of various levels of acoustic trauma on CAP and EEOAE in animals in which the cochlear responses are measured for extended periods of time after exposure. The noise exposure stimulus was varied in level to produce a range of threshold shifts from temporary to permanent. The response measures were then obtained days to several weeks after the noise exposure. In addition to the free-field noise exposure conditions, some animals were monaurally noise exposed, under anesthesia, to measure the cochlear responses immediately after the exposure. Later experiments were conducted to further analyze the source of the SDC through chemical treatment to eliminate the cochlear hair cells as well as mechanical destruction of the cochlea and the ossicular chain. We determined that the EEOAE is a sensitive measure of cochlear activity that may provide useful information about the mechanisms associated with noise-induced hearing loss.
Methods
Chronic animal surgery/experiment
Pigmented guinea pigs were anesthetized (ketamine 58.8 mg/kg, xylazine 2.4 mg/kg, acepromazine 1.2 mg/kg, i.m.), administered glycopyrrolate (0.2 mg/kg, s.c.), and given a prophylactic antibiotic (chloramphenicol 30 mg/kg, i.m.). Lidocaine (0.2%) was injected subcutaneously in regions undergoing surgical manipulation. Body temperature was maintained using water-circulating heating pads and heat lamps. Using aseptic technique, the bulla was exposed through a postauricular approach. Some bone of the bulla was removed to allow access to the middle ear space. A single ball electrode (180–200 μm ball diameter), made from 3T 90% platinum/10% iridium wire (Teflon-coated, except for the ball), was inserted through a small fenestra in the basal turn cochlear wall into scala tympani (with a sylastic ball preventing insertion beyond 0.5 mm) adjacent to the RW, and a return electrode (5T 90% platinum/10% iridium wire, uncoated) placed subcutaneously in the neck. This electrode configuration gave rise to EEOAE and CAP responses very similar to the extracochlear RW electrode, with the added benefit of improved long-term electrode stability and response consistency over time. The active electrode was secured to the edge of the bulla defect with carboxylate cement, and the bulla defect was then completely sealed with a second layer of carboxylate cement. Both active and ground electrodes were attached to a connector securely mounted to the animal's skull with anchor screws and dental acrylic (methyl methacrylate). Skin closure was achieved with a subcuticular closure (3–0 Dexon absorbable suture) in a continuous suture pattern and a cuticular closure (4–0 Ethilon monofilament nylon suture) in a simple interrupted suture pattern. Any exposed skin edges around the skull-mounted connector were completely sealed with additional methyl methacrylate. The animal was then administered sterile physiological saline (1–2 ml per 100 g body weight) and allowed to recover. CAP was tested weekly until thresholds became stable before the animal was started on the experimental protocol. The experimental protocol consisted of baseline physiology (CAP and EEOAE), followed by noise exposure or drug-induced deafening. Postnoise physiology was collected one day postexposure, and was repeated weekly until responses were stable (at least two weeks). Postdeafening physiology was collected three days, one week, and two weeks after deafening. Animals deafened with kanamycin and ethacrynic acid were processed for hair cell counts after completing the protocol.
Kanamycin and ethacrynic acid deafening
Animals were administered a subcutaneous dose of 400 (n = 1) or 500 (n = 6) mg/kg kanamycin. Two hours later, they were anesthetized as described above. Using the aseptic technique, the external jugular vein was cannulated, and a dose of ethacrynic acid [40 (n = 1) or 50 (n = 6) mg/kg] was administered intravenously. The cannula was then removed, the vessel tied off, and skin was closed using 4–0 Ethilon monofilament nylon suture in a simple interrupted suture pattern. The animal was administered sterile physiological saline (1–2 ml per 100 g body weight), and allowed to recover. This drug combination was expected to destroy all OHCs, and most inner hair cells (IHCs) (West et al. 1973; Kanzaki et al. 2002), with the possible exception of apical turn IHCs.
Sound exposure
Animals were placed in a ventilated chamber with the inner walls covered with 5 cm acoustic foam. The noise was presented through a loudspeaker (Parasound HCA-750A amplifier, JBL 2450H Compression Driver with 2385A Horn) mounted on the top of the chamber. For calibration, the system response (62.5–22 kHz) to a white noise source (General Radio 1381) was measured with a 1/2-in. microphone (B&K 4134) and fast Fourier-transform (FFT) spectrum analyzer (Stanford Research SR760). The spectrum data was used to create an equalizing FFT filter in an audio file editor (Adobe Audition), which then used to create an audio CD for the noise used in this study [10 kHz 1/3 octave band noise (OBN)]. The system response to the audio CD was then verified with an FFT spectrum analyzer. The awake animals were exposed in individual wire cages (approximately 7 × 7 × 7 in.). The level of the noise was measured within the cage using a B&K Sound level meter (model 2231, with type 4155 1/2-in. microphone, and type 1625 octave band filter). Alternately, some animals were exposed to a monaural, TTS-inducing noise in a setting where finer time resolution could be obtained. Animals were anesthetized for baseline physiology, and were exposed to a unilateral noise exposure (10 kHz 1/3 OBN at 110 dB SPL for 20 min) via the same transducer used to present CAP stimuli (closed-field condition). The level of this noise was measured using a B&K Sound level meter (model 2231, with type 4138 1/8-in. microphone, and type 1625 octave band filter) coupled to the transducer for a closed-field condition approximating the volume of a guinea pig ear canal. Physiology was retested after exposure (for approximately 1.5 to 2 h postexposure), and then repeated two to three days postexposure and weekly postexposure until responses stabilized.
Measurement of the CAP
Acoustic stimulation was presented in the ear canal (closed field) with a shielded, calibrated sound source (TDT EC1) mated to an Etymotic (ER 10B+). CAP was measured (TDT System II/III hardware (DB4 Bioamp Controller and HS4 Bioamp Headstage, gain = 10 k, filter = 0.3–3 kHz, and BioSig/SigGen software). CAP thresholds (256 epochs) evoked by tone bursts (15 ms duration, 1 ms rise/fall times, 10/s) at 2–32 kHz were measured at baseline and monitored throughout the experiment.
Measurement and data analysis of EEOAE
For the EEOAE, the output frequency from the SRS 830 lock-in amplifier was stepped from 1 to 35 kHz in 22-Hz increments, with a time constant of 3 s and a dwell time of 1 s. These settings were found to produce the most stable and reproducible results. The voltage (0.1 mV) from the SRS 830 lock-in amplifier was sent to a custom constant current amplifier (resulting in a current of 10 μA) and to the scala tympani electrode. A lock-in amplifier sensitivity of 1 mV/nA was used. The sound pressure in the in the ear canal was measured with the Etymotic (ER 10B+). In this way, the amplitude, A(ω), and phase,  , of the EEOAE were obtained.
We analyzed the time–frequency nature of the EEOAE using two measures. The first was the time delay spectrum (TDS), which is an estimate of the delay integrated over all frequency components. Following the approach of Ren and Nuttall (2000), the TDS, denoted as r(τdelay), was computed as the amplitude of the discrete Fourier-transform (DFT) of the real part of the EEOAE spectrum or
 |
1 |
where  , the vertical lines indicate the absolute value of the complex quantity, and the factor of 2 is a normalization compensating for using the real part of the spectrum only. Using the DFT in this way, the discrete time delay was evaluated at bins given by τdelay(n) = (n − 1)/(Fband), where 1 < n < Nfreq/2. Fband was the measurement bandwidth, and Nfreq was the number of frequencies in the one-sided, experimentally determined spectrum. In the present study, Fband was 34 kHz as the EEOAE was measured from 1 to 35 kHz and the delay resolution, given by 1/Fband, was 0.029 ms. A second measure, denoted as the delay–frequency spectrum (DFS), was also computed. In this approach, a frequency domain Hanning window with length Fwindow was applied to sections of R(ω). The window was moved along the frequency axis and the delay spectrum estimated by applying Eq. (1) to each band of frequencies. Gray-scale, linear contour plots were used to display the delay versus frequency spectrum in a smoothed fashion using Matlab (Mathworks, Inc.). In the present study, a broad frequency window of Fwindow = 13.6 kHz was used to maintain a delay resolution of 0.0735 ms. Computing the DFS in this way complimented the TDS by separating the delay into broad frequency components. Note that alternative approaches to computing the time–frequency distribution, including using the impulse response or the Hilbert transform computed from the EEOAE spectrum, are also possible and were investigated. We found that these measures resulted in very similar delay (or temporal) amplitude plots compared to the TDS as computed above. It should be noted that the TDS is not the same as the impulse response method and is most similar to Hilbert transform. Results computed using the TDS are noticeably different from those stemming from the Hilbert transform only for very small delays. For the results and spectra analyzed in this article, all three methods yielded the same overall conclusions.
Histology
Cochleae of three chronically implanted, chemically deafened animals were removed and fixed in 2% paraformaldehyde for 2 h. The surrounding bony capsule and lateral wall regions were removed, and the tectorial membrane peeled away. The remaining organ of Corti (attached to the modiolar core) was permeabilized with 0.3% Triton X-100 for 10 min, and then incubated with rhodamine phalloidin diluted at 1:100 (Molecular Probes, Junction City, OR, USA) for 30 min. Whole-mounts of the organ of Corti were dissected off the modiolar core and mounted on glass slides with antifade media. Samples were analyzed with a Leica DMRB epifluorescence microscope with 40× and 100× objective lenses. Images were recorded with a charged-coupled device (CCD) Cooled SPOT-RT digital camera. TIFF files were handled with Adobe Photoshop.
The experimental protocol was approved by the Animal Care and Use Committee at the University of Michigan and conforms to the NIH Guidelines for the Care and Use of Laboratory Animals.
Results
The results are a representative subset of experiments designed to explore the effects of various manipulations on CAP and EEOAE. These manipulations were performed on 23 animals, as follows: 12 animals exposed to 1/3 OBN 10 kHz noise (two at 116 dB SPL for 4 h, two at 110 dB SPL for 4 h, five at 104 dB SPL for 4 h, and three unilateral exposures), seven animals treated with ototoxic agents, and four control animals that received no disruption of cochlear activity.
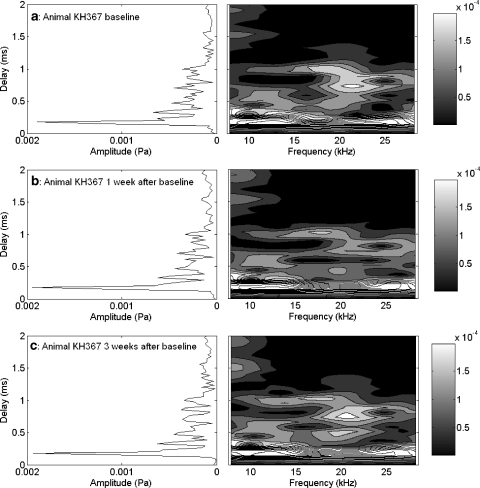
The procedures and recorded responses result from repeated measures over a two- to three-week period (exceptions are noted in the text and figures). The responses in Figures 1–3 were recorded over a three-week period from a control animal with no intentional manipulation of cochlear sensitivity. Very minor changes in CAP threshold from baseline over the three-week period are shown in Figure 1. The baseline, one-week, and two-week measures of the EEOAE amplitude and phase are shown in Figure 2a,b. The EEOAE amplitude shows two characteristics: overall level and fine structure. Although there were slight changes in the overall level during the three-week period, the fine structure remained quite consistent (Fig. 2a). This consistency was also reflected in the phase measure (Fig. 2b). The TDS and DFS plots for the EEOAE also showed consistency over the three-week period (Fig. 3a–c). The TDS (Fig. 3a–c, left column) axes are delay (expressed in milliseconds) and amplitude [in pascal (Pa)]. Typically, there was a large amplitude component near 0.1–0.2 ms delay, followed by smaller peaks out to 2.0 ms delay. The early peak is referred to as the short delay component (SDC), whereas the later peaks are referred to as long delay components (LDC) (Ren et al. 2000; Ren and Nuttall 2000). The DFS plots (Fig. 3a–c, right column) yield a more complete description of the variation of the EEOAE with respect to frequency and time delay. The DFS amplitude surfaces are plotted versus delay and frequency, where the delay axis is drawn parallel to the TDS delay axis with the same scale. The DFS representation enables the quantification of the presence or absence of contributions to the EEOAE over specific domains of delay–frequency space. For instance, the SDC of the EEOAE appears as a band of high amplitude response centered at 0.12 ms over the entire frequency range. The LDC has more variety in its appearance, with contributions at delays greater than 0.5 ms. The DFS representation allows us to separate the components more easily.
Fig. 1.
CAP for a control animal showing very minor changes in threshold over the course of the experiment.
Fig. 3.
TDS and DFS plots for the EEOAE data shown in Figure 2a,b. Some level changes were observed, but no gross changes to the shape of the DFS plot's LDC or SDC from week 1 (a) to week 2 (b) or week 4 (c) measures. Contour lines (and shaded areas) indicate 0.00004 Pa changes in amplitude. Amplitudes in the short-delay region exceeding 0.00020 Pa are all in white, and can be distinguished by additional contour lines.
Fig. 2.
EEOAE amplitude (a) and phase (b) for the same animal and time points shown in Figure 1. There were some changes in EEOAE amplitude, but no changes in EEOAE fine structure or in the slope of the phase. Note that 360° differences in phase have no real significance, and are an artifact of an “unwrapping” procedure.
The effects of a 10-kHz 1/3 OBN exposure at 116 dB SPL for 4 h on CAP and EEOAE are shown in Figures 4–6. The changes (threshold shifts) in CAP caused by the noise exposure at one day and two weeks postexposure are shown in Figure 4. The noise exposure caused a PTS that peaked at 8 kHz (60 dB shift) and caused losses of about 50 to 35 dB in the higher frequencies. There was some recovery of threshold at 24 and 28 kHz by two weeks postexposure. The noise exposure affected both EEOAE amplitude and fine structure (Fig. 5a). The EEOAE amplitude was increased by approximately 1–15 dB over the tested frequency range. Note that the data for this animal was acquired for a bandwidth of 1.0–25 kHz. For all other animals the bandwidth was 1.0–35 kHz. The displayed noise floor shown was obtained at the two-week postexposure time point. The effect of the noise exposure was to largely eliminate the fine structure above 4–5 kHz at both one day and two weeks postexposure (Fig. 5a). The postexposure phase was similar to the mean linear slope of that measured at baseline, but with fewer deviations from the mean slope. We observed that this was consistent with a dominance of the overall response by the SDC (Fig. 6) and a loss of fine structure in the EEOAE. The effect of the noise exposure on the EEOAE TDS and DFS plots are shown in Figure 6a–c. Although the baseline TDS (Fig. 6a, left) for this animal showed small SDC and LDC amplitudes, the noise-induced damage reduced the LDC/SDC ratio and eliminated the LDC for delays greater than 1 ms. The postexposure increase in the EEOAE amplitude shown in Figure 5a was reflected in the increased SDC in Figure 6(b,c left). Compared to baseline (Fig. 6a, right), the DFS plots postexposure (Fig. 6b,c, right) showed broad frequency elimination above 0.5 ms. The increase in the SDC (Fig. 6b,c, left) at both postexposure measurement points is indicated as an increase across the frequency spectrum between 0.1 and 0.5 ms. The phenomenon of EEOAE amplitude increase was seen in both animals exposed to high noise levels.
Fig. 4.
CAP threshold shifts of an animal exposed to high-level noise (10 kHz 1/3 OBN, 4 h, 116 dB SPL). This animal had extensive permanent threshold shifts at frequencies above 4 kHz, with a small region of partial recovery around 24 kHz.
Fig. 6.
TDS and DFS plots for the EEOAE data shown in Figure 5a,b. There was significant LDC for the baseline measure (a), which was eliminated one day postexposure (b), and did not recover by two weeks postexposure (c). Contour lines (and shaded areas) indicate 0.00004 Pa changes in amplitude. Amplitudes in the short-delay region exceeding 0.00020 Pa are all in white, and can be distinguished by additional contour lines. Increase observed in the EEOAE amplitude (Fig. 5a) is associated with an increase in the SDC amplitude (b,c).
Fig. 5.
EEOAE amplitude (a) and phase (b) for the same animal and time points shown in Figure 4. Changes both in EEOAE amplitude and fine structure were observed, with increased amplitude postexposure, and the fine structure was mostly eliminated.
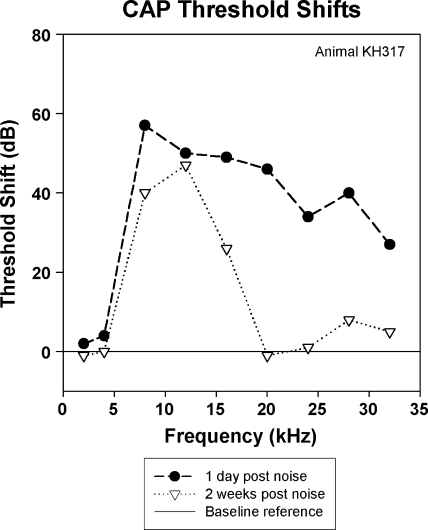
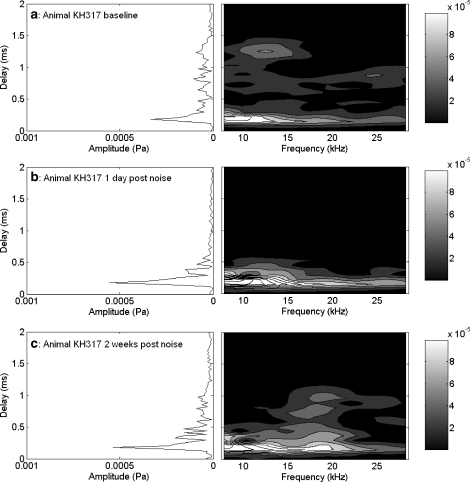
Effects of exposing an animal to 1/3 OBN for 4 h at 110 dB SPL are shown in Figures 7–9. In this animal, the one-day postexposure changes in CAP thresholds (Fig. 7) were similar to the 116 dB SPL exposure (Fig. 4). However, two weeks postexposure, there was a return to near-baseline threshold values at 20 kHz and above (Fig. 7). Hence a band-limited PTS was achieved. One day postexposure, the effect of the noise on the EEOAE was a reduction or elimination of the fine structure above approximately 4 kHz (Fig. 8a). At two weeks postexposure the fine structure remained absent from approximately 4 kHz to approximately 16 kHz, but fine structure reappeared above 16 kHz, although altered from the baseline form. There were also regions where the overall amplitude of the EEOAE increased above the baseline, specifically from 4 to 10 kHz. The effect of noise on the EEOAE phase was once again to suppress deviations from the mean phase line one day postexposure. The effects of this noise exposure on the TDS and DFS are shown in Figure 9a–c. The effect one day after the noise exposure on the TDS and DFS plots (Fig. 9b) was similar to the 116 dB SPL exposure (Fig. 6b), a reduction of the LDC and increase in the SDC (Fig. 9b, left and right). The reduction in the LDC (0.5–2.0 ms) was associated with an elimination of fine structure above 0.5 ms (Fig. 9b, right). Unlike the 116 dB SPL exposure, at two weeks postexposure there was a return of energy for delays greater than 0.5 ms (Fig. 9c, left), and the DFS shows this energy to be associated with frequencies in the band between 15 and 25 kHz (Fig. 9c, right). There was a clear reduction of the energy in the delay region between 1.0 and 1.5 ms (Fig. 9a,c, left) and the region between 8 and about 17 kHz (Fig. 9a,c, right). Comparing the DFS in Figure 9a,c, the LDC components are seen in both figures, but the energetic regions in delay–frequency space (as indicated by higher levels) are different, with the baseline plot showing more energy from 5 to 15 kHz compared to the postexposure data. The postexposure data showed more energy in the 15–25 kHz region, with a complete elimination of contributions with delays greater than 1.25 ms. Both animals exposed to this PTS-inducing exposure demonstrated some regions of EEOAE amplitude enhancement. This enhancement was seen in the SDC and in some regions of the LDC in the DFS plots.
Fig. 7.
CAP threshold shifts of an animal exposed to medium level noise (10 kHz 1/3 OBN, 4 h, 110 dB SPL). This animal had a significant permanent threshold shift, but in a narrower frequency band than seen in the higher-level exposure.
Fig. 9.
TDS and DFS plots for the EEOAE data shown in Figure 8a,b. There was significant LDC for the baseline measure (a), which was completely eliminated one day postexposure (b). By two weeks postexposure, LDC had returned, but in a very different configuration from baseline (c). Contour lines (and shaded areas) indicate 0.00002 Pa changes in amplitude. Amplitudes in the short-delay region exceeding 0.00010 Pa are all in white, and can be distinguished by additional contour lines.
Fig. 8.
EEOAE amplitude (a) and phase (b) for the same animal and time points shown in Figure 7. Changes both in EEOAE amplitude and fine structure were observed, with amplitude increasing postexposure, and fine structure mostly eliminated by one day postexposure, but returning somewhat by two weeks postexposure, except for the frequency region where the PTS was observed in the CAP.
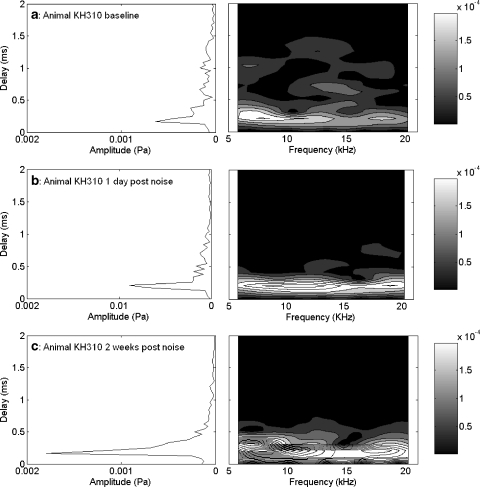
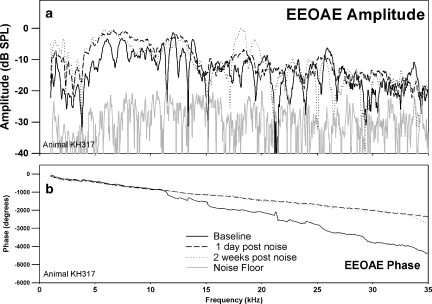
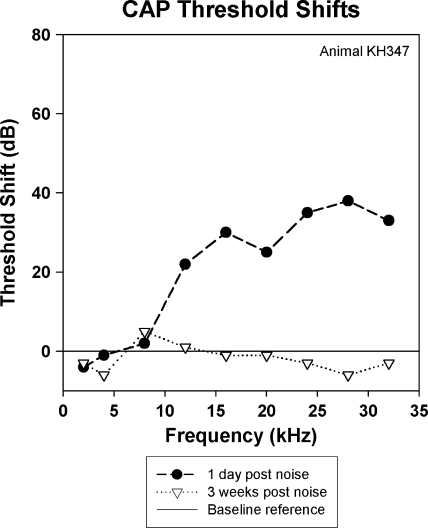
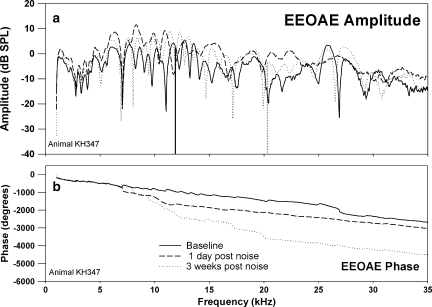
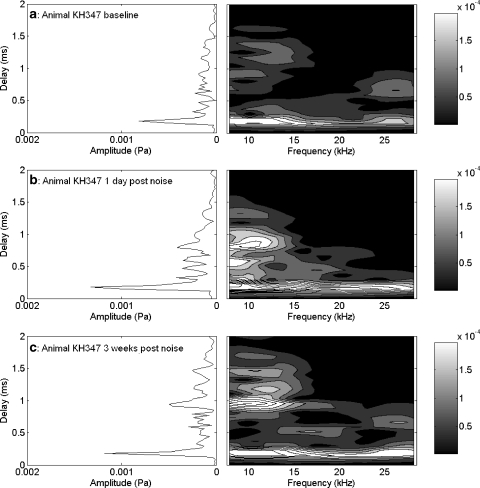
The effects of a 10-kHz 1/3 OBN noise exposure at 104 dB SPL are shown in Figures 10–13. This exposure produced a graded elevation in CAP threshold from 12 to 32 kHz with a maximum increase of about 40 dB one day postexposure (Fig. 10). The loss seen one day postexposure was a TTS that recovered to near-baseline values two weeks postexposure (Fig. 10). In comparison to the higher-level noise exposures, this exposure produced modest changes in the EEOAE amplitude spectrum and phase (Fig. 11a–b). One day postexposure, there was a broadening of the some of the fine structure peaks (near 15 kHz and the region above 24 kHz) (Fig. 11a). Although there were minor differences at two weeks postexposure, the fine structure returned to near-baseline form. The effects on the TDS and DFS are shown in Figure 12a–c. Compared to the baseline measures (Fig. 12a), one day postexposure DFS plots showed an increase in both the SDC and LDC amplitudes. This was consistent with the increase observed in the overall EEOAE amplitude and the increase in the fine structure amplitude (Fig. 11a). The increase in the LDC components was in the region below about 14 kHz and delay of 0.4–1.2 ms (Fig. 12b, right). There was a reduction or elimination of any energy above about 14 kHz (Fig. 12b, right) for delays greater than 0.5 ms. Also, spectral energy for delays above 1.2 ms was reduced or eliminated (Fig. 12b, right) for all frequencies. At two weeks postexposure (Fig. 12c), the LDC components above 1.2 ms returned with an increase in LDC amplitude (Fig. 12c, left). The delay–frequency regions of energy in the DFS plots mimicked those of the baseline condition, but the postexposure amplitudes were greater. Also, note that the energy above about 14 kHz with a delay less than 1.2 ms (Fig. 12c, right) returned to near-baseline levels (Fig. 12a, right).
Fig. 10.
CAP threshold shifts of an animal exposed to low-level noise (10 kHz 1/3 OBN, 4 h, 104 dB SPL). This animal had no permanent threshold shift.
Fig. 13.
CAP for an animal exposed to a brief lower-level unilateral noise (10 kHz 1/3 OBN, 110 dB SPL, for 20 min). A threshold shift was observed, which had partially recovered by two days postexposure, and completely recovered one week postexposure, except for a slight (<10 dB) shift at higher frequencies.
Fig. 11.
EEOAE amplitude (a) and phase (b) for the same animal and time points shown in Figure 10. Changes both in EEOAE amplitude and fine structure were observed, with increased amplitude postexposure, and the fine structure was significantly altered one day postexposure, but returned almost completely to baseline three weeks postexposure.
Fig. 12.
TDS and DFS plots for the EEOAE data shown in Figure 11a–b. There was significant LDC for the baseline measure (a). The high-frequency component of the LDC was eliminated one day postexposure, but the lower frequency regions remained similar to baseline (b). By three weeks postexposure, all frequencies of the LDC had returned to a very similar configuration to baseline (c). Contour lines (and shaded areas) indicate 0.00004 Pa changes in amplitude. Amplitudes in the short-delay region exceeding 0.00020 Pa are all in white, and can be distinguished by additional contour lines.
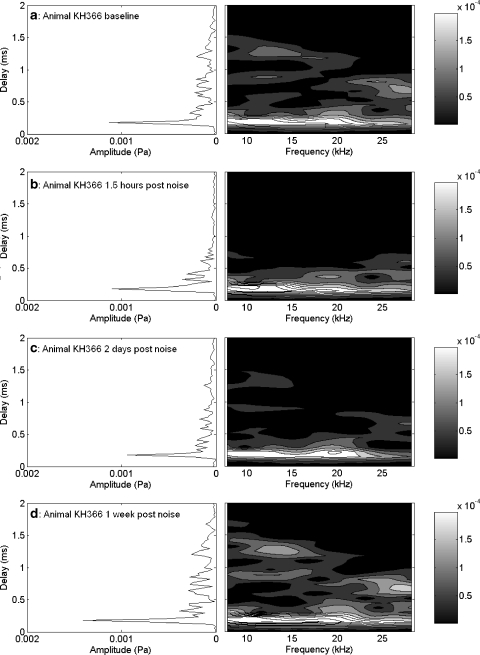
Measurements presented thus far were acquired no sooner than one day postexposure. In addition, noise exposure was presented free-field while the animals were awake and unrestrained. The results shown in Figures 4–9 are for conditions of PTS where differences in the response measures were observed weeks after exposure. The results from the 10-kHz 1/3 OBN at 104 dB SPL (Figs. 10–12) showed some differences in CAP threshold one day postexposure, but not at two weeks postexposure, a TTS exposure condition. To obtain finer temporal information about the effects of damage on CAP and EEOAE, a slightly different variant of the experiment was conducted. The results in Figures 13–15 are from an animal that was anesthetized and exposed to 10 kHz 1/3 OBN at 110 dB SPL for 20 min under a closed-field condition (microphone sealed in the ear canal). Other than this, and the extended period of anesthesia for physiology collection postexposure, surgical and experimental conditions were identical to those used for the rest of the experiments presented in this article.
Fig. 15.
TDS and DFS plots for the unilateral brief sound exposure at the time points shown in Figure 14a,b. At 90 min postexposure (b), the LDC was largely eliminated, especially compared to baseline (a). Some recovery of the LDC was seen after two days (c), and the LDC had recovered to baseline configuration by one week postexposure (d). Contour lines (and shaded areas) indicate 0.00004 Pa changes in amplitude. Amplitudes in the short-delay region exceeding 0.00020 Pa are all in white, and can be distinguished by additional contour lines.
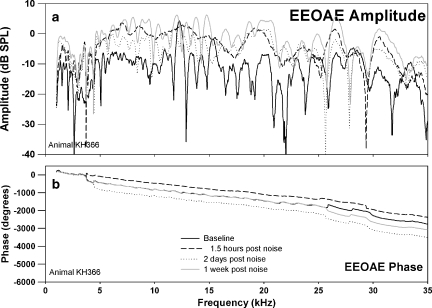
Figure 13 shows that the noise exposure (10 kHz 1/3 OBN at 110 dB SPL for 20 min) produced approximately 55–60 dB peak threshold shift in the CAP at 12 and 20 kHz (Fig. 14c) at 30 min postexposure. At two days postexposure, CAP thresholds were elevated approximately 20 dB from baseline over the same frequency region. One week postexposure, the threshold elevations were within 5 dB of baseline values (Fig. 13). There was an increase in EEOAE amplitude at each postexposure measurement (Fig. 14a). At 90 min postexposure, there was a clear disruption of the fine structure below 25 kHz. The fine structure returned at the two-day postexposure measurement. The phase (Fig. 14b) also showed minor changes in this region above 25 kHz. The TDS and DFS plots at 1.5 h postexposure showed clear differences compared to the baseline measure (Fig. 15a–c). The LDC was reduced above 0.5 ms (Fig. 15b, left) across the frequency spectrum (Fig. 15b, right). There was some return of both components at two days postexposure (Fig. 15c), and they both returned to near-baseline values at one week postexposure (Fig. 15d). Three of the eight animals exposed to TTS-inducing noise exposures (as in Figs. 10–15) showed some enhancements of the EEOAE after noise exposure. In one case, this enhancement was primarily evident in the LDC. In the other two cases, the enhancement was evident in both the SDC and the LDC.
Fig. 14.
EEOAE amplitude (a) and phase (b) for the animal shown in Figure 13. Fine structure was eliminated in the hours following exposure, but had largely returned by two days postexposure, although in a slightly different configuration from baseline. One week postnoise exposure, the fine structure was very similar to baseline, with larger overall amplitude.
The EEOAE response measure appears to be a useful tool in exploring the effects of acoustic trauma. The TDS and DFS plots reveal an SDC and an LDC. All of our noise exposure conditions primarily affected the LDC. Although there were minor changes to the SDC, it was relatively robust compared to the LDC. We attempted to produce an effect on the SDC (and LDC) by eliminating the outer hair cells through systemic application of kanamycin and ethacrynic acid.
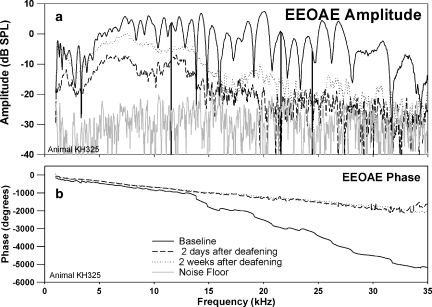
Figure 16 shows the physiological results from one of seven animals receiving the ototoxic chemicals. Kanamycin and ethacrynic acid completely eliminated the fine structure at two days and two weeks postdeafening. There was also an overall reduction in the EEOAE amplitude two days postdeafening. The EEOAE amplitude fell into the noise floor above 20 kHz at two days postdeafening. Two weeks postdeafening, there was a slight rise in the overall EEOAE amplitude compared to the two-day postdeafening measure. This “recovery” was observed in all animals tested chronically postdeafening. The TDS and DFS plots (data not shown) showed that LDC components were eliminated by kanamycin and ethacrynic acid at two days and two weeks. The SDC remained but was reduced in amplitude and in frequency range from the baseline value in all animals treated with kanamycin and ethacrynic acid (n = 7). Histology was performed for the animal in which the data in Figure 16 were collected. Epifluorescence of cochlear whole-mount showed extensive hair cell loss, with no surviving inner or outer hair cells in the first three cochlear turns. A few IHCs and OHCs remained in the fourth turn.
Fig. 16.
EEOAE (a) and phase (b) from an animal deafened with kanamycin (400 mg/kg) and ethacrynic acid (40 mg/kg). EEOAE fine structure was completely eliminated after drug administration, but some EEOAE was still present postdeafening, with some “recovery” of amplitude seen between two days after deafening and two weeks after deafening.
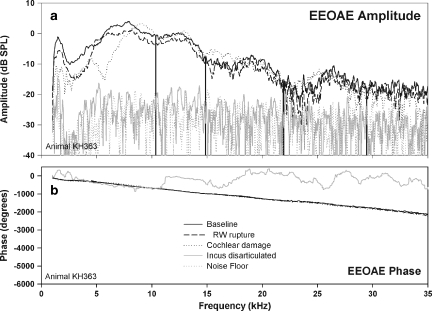
In similar experiments in which the OHCs were eliminated by kanamycin and ethacrynic acid, further attempts were made to eliminate the SDC. Again, chemical treatment eliminated the fine structure (Fig. 17, baseline). Manipulations such as round window rupture or gross mechanical disruption of the cochlea only had modest effects on the overall amplitude of the EEOAE (Fig. 17). Mechanical destruction of the fourth turn of the cochlea, likely destroying any remaining OHCs, and artificially induced paralysis (tubocurarine 0.3 mg/kg) had no effect as well (data not shown). However, in all three animals tested, disarticulation of the ossicular chain did reduce the EEOAE amplitude to the noise floor.
Fig. 17.
In an animal deafened with kanamycin (500 mg/kg) and ethacrynic acid (50 mg/kg), several attempts were made to eliminate the residual EEOAE (a) and phase (b). RW rupture and additional cochlear damage to first turn (insertion of a probe through the RW to disrupt cochlear structures) had only minor effects on the residual EEOAE. Additionally, in another animal (data not shown), removal of the apex and artificially paralyzing the animal (tubocurarine, 0.3 mg/kg) had no effect on the residual EEOAE. Removal of the apex should effectively eliminate any possible surviving OHCs or IHCs. The only manipulation that consistently eliminated the EEOAE was disruption of the ossicular chain, either by manual disarticulation of the joint between the incus and the stapes, or by removal of the tympanic membrane and malleous.
Discussion
In this study, animals were exposed to 1/3 OBN at varying levels and durations to measure the effect on CAP and EEOAE. The animals were chronically implanted with a scala tympani electrode, which allowed measurement of CAP and EEOAE prior to and for an extended period of time postexposure. This recording technique provided the opportunity to measure each response with reproducible results (Figs. 1–3) chronically. It thus allowed us the opportunity to characterize the response measures during the course of cellular change postexposure. For a given sound exposure, there were certain consistencies across the response measures. Sound exposures that produced PTS in CAP (Figs. 4 and 7) were correlated with EEOAE amplitude increases, frequency-specific elimination of the fine structure, and changes in the phase (Figs. 5a,b and 8a,b). In each case of PTS, the TDS plots (Figs. 6a–c and 9a–c) showed reduced LDC associated with reductions in energy in specific spectral regions of the DFS. In the case of Figures 6a–c, the noise exposure produced changes in the LDC and broad frequency changes in the spectral plots that were permanent, and consistent with the changes in CAP. When there was some recovery of the CAP (Fig. 7), there was also some recovery of LDC and energy in the spectral delay plots (Fig. 9a–c).
TTS noise exposures that produced large elevations in CAP thresholds (Figs. 10 and 13) that recovered over the measurement period caused changes in the EEOAE that differed from PTS exposures. EEOAE amplitude increases were seen in some, but not all, of these exposures. TTS noise exposures sometimes caused changes in fine structure depending on the measurement time postexposure. Return of fine structure was seen before CAP thresholds returned to baseline values (Figs. 10–14). For TTS, the postexposure fine structure of the EEOAE may have been different from baseline, but the fine structure, per se, remained. Absence of the EEOAE fine structure 24 h postexposure was always associated with PTS.
All of the noise exposures used in this study had a greater effect on the LDC than on the SDC. This was consistent with other studies (Nuttall and Ren 1995; Ren and Nuttall 1998; Ren and Nuttall 2000; Zheng et al. 2001; Nuttall et al. 2001) that showed various manipulations have a more profound effect on the LDC than on the SDC. A near-complete chemical elimination of IHCs and OHCs eliminated the fine structure (Fig. 16a–c) and LDC, but only reduced the amplitude and frequency composition of the SDC. The absence of hair cells eliminated the possible contribution of stereocilia mechanics to the remaining SDC (Liberman et al. 2004). We made various dramatic attempts to completely eliminate the SDC in a chemically deafened animal. The only manipulation that consistently eliminated the residual SDC was disarticulation of the ossicular chain.
Electrical stimulation of the cochlea has, in general, taken two forms. The first method used localized bipolar intracochlear stimulation, either through scala media (Hubbard and Mountain 1983; Hubbard and Mountain 1990; Murata et al. 1991; Xue et al. 1993, 1995a,b; Roddy et al. 1994; Kirk and Yates 1996; Nakajima et al. 1994; Nakajima et al. 1996; Nakajima et al. 1998; Nakajima et al. 2000) or through electrodes placed in scala vestibuli and tympani (Nuttall and Ren 1995; Nuttall et al. 2001). Intracochlear bipolar current stimulation is thought to pass through the transduction channels of the hair cells (Xue et al. 1993, 1995a; Yates and Kirk 1998). These studies all showed that intracochlear bipolar AC stimulation produced “discrete” otoacoustic emissions in the ear canal. The characterization of these otoacoustic emissions show that they likely derived from the location near the stimulating site. Several of these studies showed the vulnerability of the response to various manipulations (Nuttall and Ren 1995; Nakajima et al. 2000).
The second method, similar to the one used in this study, was pioneered by Ren and Nuttall (Ren and Nuttall 1995; Nuttall and Ren 1995; Ren et al. 1996). It should be noted that AC stimulation of the RW was used in an earlier study (Kiang and Moxon 1972) to characterize its effects on auditory nerve fibers in deafened cats. Ren et al. showed that RW monopolar stimulation in a sensitive preparation produced an emission in the ear canal which had multiple peaks referred to as the fine structure. The RW EEOAE spectrum could be decomposed into short delay components (SDC) and long delay components (LDC). The SDC (as hypothesized by Ren et al. 2000 and Ren and Nuttall 2000) could be attributed to stimulated OHCs near the electrode. In the present study, we show a residual EEOAE in the kanamycin, ethacrynic acid treated cochlea (see Figs. 16 and 17).
Such a residual emission indicates that a portion of the SDC is attributable to another less physiologically vulnerable source that our experiments strongly suggest as not being a result of OHC motility. We estimate that a 0.10 ms delay roughly corresponds to a delay from the stapes to the microphone. We surmise that the SDC arises from a direct excitation from the electrodes to some very basal source location. RW electrical stimulation is known to give rise to a forward traveling wave on the BM (Kirk and Yates 1996; Nuttall et al. 2001) that is very similar to an acoustically excited forward traveling wave. We speculate here, as others have previously done, that this forward traveling wave causes the LDC of the emission through interaction with the BM and organ of Corti. The LDC is physiologically vulnerable. Two mechanisms have been proposed for the LDC. One is a place-fixed mechanism that can be attributed to linear reflections resulting from perturbations in the impedance of the BM and organ of Corti structures (e.g., Shera 2004). The second source is a wave-fixed source attributable to reflections from the characteristic location for each frequency. In this article, no attempt is made to separate place-fixed and wave-fixed delays. Rather, we have correlated the presence or absence of fine structure seen in the EEOAE spectrum with changes in the CAP threshold. We have shown that the LDC (i.e., energy with delays greater than 0.5 ms) is vulnerable to sound-induced damage and drug-induced damage.
A frequent observation in this study (7 out of 12 animals) was an increase in EEOAE amplitude after noise exposure. All four of the loudest noise exposure conditions used in this study (116 and 110 dB SPL for 4 h) produced temporary or permanent elevation of the EEOAE. Enhancement of the EEOAE has been reported by Mountain and Hubbard (1989), Xue et al. (1993), Nakajima et al. (1996), Kirk and Yates (1998a, b), Zheng et al. (2001). Acoustic stimulation (Mountain and Hubbard 1989; Xue et al. 1993; Nakajima et al. 1996; Kirk and Yates 1998a; Yates and Kirk 1998), ATP (Kirk and Yates 1998b), and some concentrations of quinine can increase the EEOAE amplitude (Zheng et al. 2001). Zheng et al. (2001) addressed the enhancement of EEOAE with time–frequency analysis. They showed that the quinine-induced increase in the EEOAE was associated with a decrease in the LDC and increase in the SDC (Zheng et al. 2001), similar to our PTS results. In our data, some, but not all, TTS exposures resulted in an enhancement of the EEOAE amplitude as well. TTS-associated enhancements were not always permanent, and were associated with both SDC and LDC increases. A reduction in negative feedback has been proposed as the source acoustic enhancement of the EEOAE (Mountain and Hubbard 1989; Hubbard and Mountain 1990; Xue et al. 1993; Roddy et al. 1994; Nakajima et al. 1996), although arguments against negative feedback have also been discussed (Kirk and Yates 1996; Ren and Nuttall 1998). Germane to this study are two reports that show enhancement of the EEOAE through purported changes in either the mechanical gating of transduction channels of the OHCs (Yates and Kirk 1998) or the ATP-gated ion channels on the OHC. As suggested by Nakajima et al. (1996, 2000), a likely anatomical location for the effects of acoustic trauma is the mechanoelectric transduction channels and, in some cases, the electromechanical transduction process.
Although we cannot pinpoint the exact location within the transduction process affected by the noise exposures used here, the method may allow association of histological changes with changes in the fine structure of EEOAE. Chronic analysis of the EEOAE fine structure after acoustic trauma may provide new insights into the mechanisms associated with TTS and PTS. In addition, further investigations of the “residual” EEOAE after the chemical destruction of OHCs may provide insights into the source of this phenomenon.
Acknowledgments
This research was supported by NIH-NIDCD P30 DC05188, RO1 DC004194 (DFD), RO1 R01 DC01634 and DC05401 (YR), and R01-04084 (KG). We thank K. Haubenreich and T.L. Loh for software and hardware development, and L.A. Beyer for assistance with the histology. We thank Dr. T. Ren for his insightful comments on the manuscript.
References
- Borg E, Canlon B, Engstrom B. Noise-induced hearing loss. Literature review and experiments in rabbits. Morphological and electrophysiological features, exposure parameters and temporal factors, variability and interactions. Scand. Audiol., Suppl. 40:1–147, 1995. [PubMed]
- Brownell WE, Bader CR, Bertrand D, De Ribaupierre Y. Evoked mechanical responses of isolated cochlear outer hair cells. Science 227:194–196, 1985. [DOI] [PubMed]
- Davis H. An active process in cochlear mechanics. Hear. Res. 9:79–90, 1983. [DOI] [PubMed]
- Hubbard AE, Mountain DC. Alternating current delivered into the scala media alters sound pressure at the eardrum. Science 222:510–512, 1983. [DOI] [PubMed]
- Hubbard AE, Mountain DC. Hair cell forward and reverse transduction: differential suppression and enhancement. Hear. Res. 43:269–272, 1990. [DOI] [PubMed]
- Kachar B, Brownell WE, Altschuler RA, Fex J. Electrokinetic shape changes of cochlear outer hair cells. Nature 322:365–368, 1986. [DOI] [PubMed]
- Kanzaki S, Stover T, Kawamoto K, Prieskorn DM, Altschuler RA, Miller JM, Raphael Y. Glial cell line-derived neurotrophic factor and chronic electrical stimulation prevent VIII cranial nerve degeneration following denervation. J. Comp. Neurol. 454:350–360, 2002. [DOI] [PubMed]
- Kemp DT. Stimulated acoustic emissions from within the human auditory system. J. Acoust. Soc. Am. 64:1386–1391, 1978. [DOI] [PubMed]
- Kiang NYS, Moxon EC. Physiological considerations in artificial stimulation of the inner ear. Ann. Otol. 81:714–730, 1972. [DOI] [PubMed]
- Kim DO. Cochlear mechanics: implications of electrophysiological and acoustical observations. Hear. Res. 2:297–317, 1980. [DOI] [PubMed]
- Kirk DL. Effects of 4-aminopyridine on electrically evoked emissions and mechano-transduction in guinea pig outer hair cells. Hear. Res. 161:99–112, 2001. [DOI] [PubMed]
- Kirk DL, Yates GK. Frequency tuning and acoustic enhancement of electrically evoked otoacoustic emissions in the guinea pig cochlea. J. Acoust. Soc. Am. 100:3714–3725, 1996. [DOI] [PubMed]
- Kirk DL, Yates GK. Enhancement of electrically evoked oto-acoustic emissions associated with low-frequency stimulus bias of the basilar membrane towards scala vestibuli. J. Acoust. Soc. Am. 104:1544–1554, 1998a. [DOI] [PubMed]
- Kirk DL, Yates GK. ATP in endolymph enhances electrically-evoked oto-acoustic emissions from the guinea pig cochlea. Neurosci. Lett. 250:149–152, 1998b. [DOI] [PubMed]
- Liberman MC, Zuo J, Guinan JJ Jr. Otoacoustic emissions without somatic motility: can stereocilia mechanisms drive the cochlea? J. Acoust. Soc. Am. 116:1649–1655, 2004. [DOI] [PMC free article] [PubMed]
- Mauermann M, Uppenkamp S, van Hengel PW, Kollmeier B. Evidence for the distortion product frequency place as a source of distortion product otoacoustic emission (DPOAE) fine structure in humans. I. Fine structure and higher-order DPOAE as a function of the frequency ratio f2/f1. J. Acoust. Soc. Am. 106:3473–3483, 1999. [DOI] [PubMed]
- Mountain DC. Changes in endolymphatic potential and crossed olivocochlear bundle stimulation alter cochlear mechanics. Science 210:71–72, 1980. [DOI] [PubMed]
- Mountain DC, Hubbard AE. Rapid force production in the cochlea. Hear. Res. 42:195–202, 1989. [DOI] [PubMed]
- Murata K, Moriyama T, Hosokawa Y, Minami S. Alternating current induced otoacoustic emissions in the guinea pig. Hear. Res. 55:201–214, 1991. [DOI] [PubMed]
- Nakajima HH, Olson ES, Mountain DC, Hubbard AE. Electrically evoked otoacoustic emissions from the apical turns of the gerbil cochlea. J. Acoust. Soc. Am. 96:786–794, 1994. [DOI] [PubMed]
- Nakajima HH, Olson ES, Mountain DC, Hubbard AE. Acoustic overstimulation enhances low-frequency electrically-evoked otoacoustic emissions and reduces high-frequency emissions. Audit. Neurosci. 3:79–99, 1996.
- Nakajima HH, Mountain DC, Hubbard AE. Nonlinear characteristics of electrically evoked otoacoustic emissions. Hear. Res. 122:109–118, 1998. [DOI] [PubMed]
- Nakajima HH, Hubbard AE, Mountain DC. Effects of acoustic trauma on acoustic enhancement of electrically evoked otoacoustic emissions. J. Acoust. Soc. Am. 107:2603–2614, 2000. [DOI] [PubMed]
- Nuttall AL, Ren T. Electromotile hearing: evidence from basilar membrane motion and otoacoustic emissions. Hear. Res. 92:170–177, 1995. [DOI] [PubMed]
- Nuttall AL, Zheng J, Ren T, de Boer E. Electrically evoked otoacoustic emissions from apical and basal perilymphatic electrode positions in the guinea pig cochlea. Hear. Res. 152:77–89, 2001. [DOI] [PubMed]
- Ren T. Acoustic modulation of electrically evoked distortion product otoacoustic emissions in gerbil cochlea. Neurosci. Lett. 207:167–170, 1996. [DOI] [PubMed]
- Ren T, Nuttall AL. Extracochlear electrically evoked otoacoustic emissions: a model for in vivo assessment of outer hair cell electromotility. Hear. Res. 92:178–183, 1995. [DOI] [PubMed]
- Ren T, Nuttall AL. Acoustical modulation of electrically evoked otoacoustic emission in intact gerbil cochlea. Hear. Res. 120:7–16, 1998. [DOI] [PubMed]
- Ren T, Nuttall AL. Fine structure and multicomponents of the electrically evoked otoacoustic emission in gerbil. Hear. Res. 143:58–68, 2000. [DOI] [PubMed]
- Ren T, Nuttall AL, Miller JM. Electrically evoked cubic distortion product otoacoustic emissions from gerbil cochlea. Hear. Res. 102:43–50, 1996. [DOI] [PubMed]
- Ren T, Nuttall AL, Parthasarathi AA. Quantitative measure of multicomponents of otoacoustic emissions. J. Neurosci. Methods 96:97–104, 2000. [DOI] [PubMed]
- Reyes S, Ding D, Sun W, Salvi R. Effect of inner and outer hair cell lesions on electrically evoked otoacoustic emissions. Hear. Res. 158:139–150, 2001. [DOI] [PubMed]
- Roddy J, Hubbard AE, Mountain DC, Xue S. Effects of electrical biasing on electrically-evoked otoacoustic emissions. Hear. Res. 73:148–154, 1994. [DOI] [PubMed]
- Shera CA. Mechanisms of mammalian otoacoustic emission and their implications for the clinical utility of otoacoustic emissions. Ear Hear. 25:86–97, 2004. [DOI] [PubMed]
- Shera CA, Guinan JJ Jr. Evoked otoacoustic emissions arise by two fundamentally different mechanisms: a taxonomy for mammalian OAEs. J. Acoust. Soc. Am. 105:782–798, 1999. [DOI] [PubMed]
- West BA, Brummett RE, Himes DL. Interaction of kanamycin and ethacrynic acid. Severe cochlear damage in guinea pigs. Arch. Otolaryngol. 98:32–37, 1973. [DOI] [PubMed]
- Willott JR. Aging and the Auditory System: Anatomy, Physiology, and Psychophysics. Singular Publishing Group, San Diego, 1991.
- Xue S, Mountain DC, Hubbard AE. Acoustic enhancement of electrically-evoked otoacoustic emissions reflects basilar membrane tuning: experiment results. Hear. Res. 70:121–126, 1993. [DOI] [PubMed]
- Xue S, Mountain DC, Hubbard AE. Electrically evoked basilar membrane motion. J. Acoust. Soc. Am. 97:3030–3041, 1995a. [DOI] [PubMed]
- Xue S, Mountain DC, Hubbard AE. Acoustic enhancement of electrically evoked otoacoustic emissions reflects basilar membrane tuning: a model. Hear. Res. 91:93–100, 1995b. [DOI] [PubMed]
- Yates GK, Kirk DL. Cochlear electrically evoked emissions modulated by mechanical transduction channels. J. Neurosci. 18:1996–2003, 1998. [DOI] [PMC free article] [PubMed]
- Zheng J, Ren T, Parthasarathi A, Nuttall AL. Quinine-induced alterations of electrically evoked otoacoustic emissions and cochlear potentials in guinea pigs. Hear. Res. 154:124–134, 2001. [DOI] [PubMed]
- Zou Y, Zheng J, Nuttall AL, Ren T. The sources of electrically evoked otoacoustic emissions. Hear. Res. 180:91–100, 2003. [DOI] [PubMed]


