Abstract
The auditory midbrain implant (AMI) is a new treatment for hearing restoration in patients with neural deafness or surgically inaccessible cochleae who cannot benefit from cochlear implants (CI). This includes neurofibromatosis type II (NF2) patients who, due to development and/or removal of vestibular schwannomas, usually experience complete damage of their auditory nerves. Although the auditory brainstem implant (ABI) provides sound awareness and aids lip-reading capabilities for these NF2 patients, it generally only achieves hearing performance levels comparable with a single-channel CI. In collaboration with Cochlear Ltd. (Lane Cove, Australia), we developed a human prototype AMI, which is designed for electrical stimulation along the well-defined tonotopic gradient of the inferior colliculus central nucleus (ICC). Considering that better speech perception and hearing performance has been correlated with a greater number of discriminable frequency channels of information available, the ability of the AMI to effectively activate discrete frequency regions within the ICC may enable better hearing performance than achieved by the ABI. Therefore, the goal of this study was to investigate if our AMI array could achieve low-threshold, frequency-specific activation within the ICC, and whether the levels for ICC activation via AMI stimulation were within safe limits for human application. We electrically stimulated different frequency regions within the ICC via the AMI array and recorded the corresponding neural activity in the primary auditory cortex (A1) using a multisite silicon probe in ketamine-anesthetized guinea pigs. Based on our results, AMI stimulation achieves lower thresholds and more localized, frequency-specific activation than CI stimulation. Furthermore, AMI stimulation achieves cortical activation with current levels that are within safe limits for central nervous system stimulation. This study confirms that our AMI design is sufficient for ensuring safe and effective activation of the ICC, and warrants further studies to translate the AMI into clinical application.
Keywords: auditory prosthesis, inferior colliculus, auditory cortex, electrical stimulation, NF2, deep brain stimulation
Introduction
Neurofibromatosis type II (NF2) is a genetic disease that occurs in about 1 in 40,000 births (Evans et al. 1992). NF2 patients generally develop bilateral vestibular schwannomas. The growth and/or surgical removal of these tumors usually results in bilateral neural deafness and prevents use of a cochlear implant (CI) by NF2 patients. The current solution for these patients is the auditory brainstem implant (ABI), which is designed for implantation on the surface of the cochlear nucleus. Unfortunately, NF2 ABI patients generally only achieve performance levels comparable with a single-channel CI (Brackmann et al. 1993; Shannon et al. 1993; Lenarz et al. 2002; Otto et al. 2002; Schwartz et al. 2003). Out of about 500 NF2 ABI patients implanted worldwide, only a small percentage can achieve open-set speech recognition. Surprisingly, the performance levels in some nontumor ABI recipients are comparable with the top CI performers. Colletti and Shannon (2005) have proposed that the dramatic difference in performance between NF2 and nontumor ABI patients may be attributed to a tumor-related disruption of neural pathways in the cochlear nucleus that are essential for speech perception. An alternative implantation site that bypasses this damaged region may enable an auditory implant to achieve better hearing performance in NF2 patients compared with the ABI. We propose that the inferior colliculus central nucleus (ICC) has potential as an alternative site.
One of the main reasons for selecting the ICC as a site for an auditory implant is its well-defined tonotopic organization (Rose et al. 1963; Geniec and Morest 1971; Merzenich and Reid 1974; Serviere et al. 1984; Stiebler and Ehret 1985; Malmierca et al. 1995; Schreiner and Langner 1997). Based on CI studies, better speech perception performance has been correlated with the ability to selectively activate more frequency channels of information (Friesen et al. 2001). Thus, an electrode array aligned along the tonotopic axis of the ICC should be able to activate discrete frequency channels of information and potentially achieve higher levels of speech perception than the ABI.
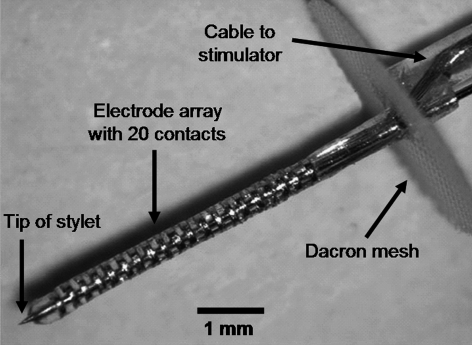
In collaboration with Cochlear, Ltd. (Lane Cove, Australia), we have designed and developed a human prototype auditory midbrain implant (AMI) electrode array based on implant technology approved for central nervous system (CNS) stimulation in humans (Fig. 1; Lenarz et al. 2003, 2006). The AMI system is similar to the Nucleus Freedom CI system (Cochlear Ltd., Lane Cove, Australia), except that the stimulating electrode array is designed for insertion into the ICC. The AMI array consists of 20 platinum ring sites mounted on a silicone carrier. The sites are spaced in intervals of 200 μm (center-to-center) where each site has a thickness of 100 μm and a surface area of about 126,000 μm2. The stiffness of the array is provided by a central stylet, which enables insertion of the electrode array into the inferior colliculus and is removed after placement. The Dacron mesh at the base of the array prevents overinsertion of the electrode into the inferior colliculus and leads to further stabilization of the implant in its final position. Based on Figure 7 in Geniec and Morest (1971), the human ICC is roughly 3.5 mm along its tonotopic dimension. It is not clear how thick the individual ICC laminae are because there do not appear to be any obvious boundaries between the layers. However, based on the similarities between human and cat with respect to the anatomical structure of the ICC and thicknesses of the disk-shaped neurons making up the laminae (Geniec and Morest 1971; Moore 1987; Schreiner and Langner 1997; Oliver 2005), it is not unlikely that the frequency laminae in human will span roughly 200 μm in thickness. Thus, our AMI array should span the entire tonotopic axis of the human ICC and stimulate discrete frequency regions. Furthermore, based on cadaver studies, the AMI array can be inserted along the tonotopic gradient of the ICC using a lateral supracerebellar infratentorial approach through a lateral suboccipital craniotomy (Lenarz et al. 2004). The lateral supracerebellar infratentorial approach is used as a routine approach to the human midbrain for tumor removal, treatment of vascular lesions (e.g., aneurysms, hemangionomas), and microvascular decompression (Stein 1979; Laborde et al. 1992; Samii et al. 1996; Ogata and Yonekawa 1997; Ammirati et al. 2002; Hitotsumatsu et al. 2003; Ulm et al. 2004). Details of this approach for AMI implantation will be presented in a future publication.
Fig. 1.
Image of the human prototype AMI array. The AMI system will consist of similar components (i.e., microphone, processor, telemetry interface, and current stimulator) as the Nucleus CI systems (Cochlear Ltd.). Image was reproduced from Lenarz et al. (2006) and used with permission from Lippincott Williams & Wilkins (Baltimore, MD).
Fig. 7.
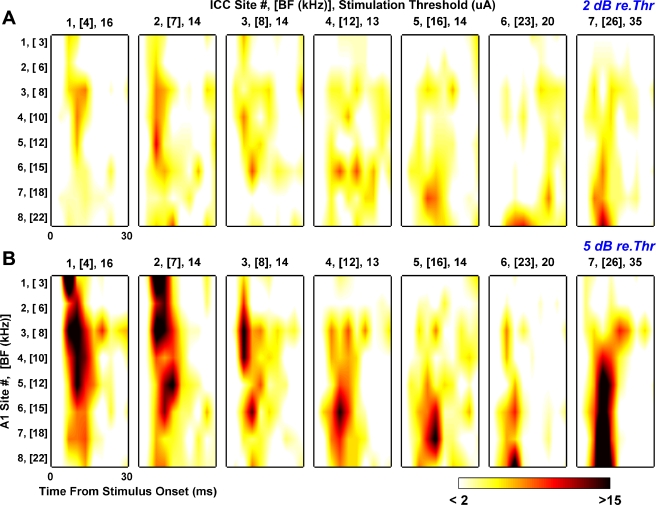
Interpolated multisite poststimulus time histograms (M-PSTH) for stimulus levels 2 dB (A) and 5 dB (B) above electrical threshold. For each stimulus level, 7 M-PSTHs are presented. Each M-PSTH represents one AMI site located along the array and is labeled on top with the site number and BF as well as the stimulation threshold (in μA) for that site. Site number corresponds to location along the AMI array where site 1 (lowest BF site) is furthest from the tip. For a given M-PSTH, ordinate corresponds to the recording site number (and BF) in A1 where site 1 is located in the lowest BF region. The abscissa corresponds to the time from stimulus onset that spike activity occurs on each A1 site. Colorscale corresponds to total spikes across 40 trials where <2 means any values ≤2 were set to white and >15 means any values ≥15 were set to black to allow for better visualization of the responses.
The question remains as to whether the AMI array can activate discrete frequency channels of information to higher processing centers. Using an experimental silicon-substrate electrode array (Michigan probe) in a guinea pig model, Lim and Anderson (2003, 2006) have demonstrated that low-threshold and localized, frequency-specific stimulation within the ICC of guinea pigs is achievable as shown by primary auditory cortex (A1) recordings. However, in that study, each stimulation site had an area of about 400 μm2, whereas the AMI sites have a larger area (∼126,000 μm2) as a result of limitations in electrode technology approved for CNS stimulation in humans and the need for ensuring safe charge densities. Therefore, the goal of this study was to determine if our AMI design would still enable low threshold (safe charge and charge density levels) and frequency-specific activation within the ICC. In ketamine-anesthetized guinea pigs, we electrically stimulated different frequency regions within the ICC via the AMI array and recorded the corresponding neural activity across the tonotopic gradient of A1 using a multisite silicon probe. In general, AMI stimulation achieved lower thresholds and more localized, frequency-specific activation in A1 compared with CI stimulation. Furthermore, the charge and charge density range for ICC activation was within safe limits for CNS stimulation. These findings demonstrate the ability of the AMI to achieve safe and effective stimulation within the ICC, and serve as a potential alternative to the ABI.
Methods
Anesthesia and surgery
Experiments were performed on young pigmented guinea pigs (329–440 g; Elm Hill Breeding Labs, Chelmsford, MA) in accordance with policies of the University of Michigan Committee on the Care and Use of Laboratory Animals. The animals were initially anesthetized with an intramuscular injection of ketamine hydrochloride (40 mg/kg) and xylazine (5 mg/kg) with additional supplements to maintain an areflexive state. Atropine sulfate (0.05 mg/kg) was administered periodically to reduce mucous secretions in the airway. Hair was removed from the incision area using animal clippers and each animal was placed into a stereotaxic device (David Kopf Instruments, Tujunga, CA). The animals were covered with a warm water heating blanket to maintain their rectal temperature at 38.0 ± 0.5°C.
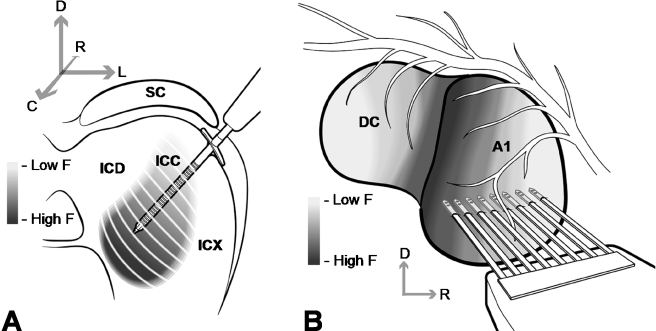
The skull was opened on the right side to expose the auditory cortex and occipital lobe, and the dura was removed. Using hydraulic manipulators, the AMI array and a multisite silicon-substrate Michigan probe (Center for Neural Communication Technology, University of Michigan, Ann Arbor, MI; Najafi et al. 1985; Drake et al. 1988; Anderson et al. 1989) were inserted into the ICC and A1, respectively (Fig. 2). The AMI array was inserted 45° off the sagittal plane through the occipital cortex (not shown in Fig. 2A) into the inferior colliculus and aligned along the tonotopic axis of the ICC (Merzenich and Reid 1974; Schreiner and Langner 1997; Snyder et al. 2004). Most of the Dacron mesh was removed to allow easier penetration through the occipital cortex. In these acute experiments, the stylet was not removed after AMI placement. The AMI sites had impedances between 10 and 20 kΩ (at 1 kHz). The A1 probe had eight shanks each separated by 200 μm, and each shank had two iridium (sputter-deposited) sites separated by 50 μm. Each shank was 15 μm thick, 1.6 mm long, and tapered in width from 50 μm to a few microns at the tip. Each site had an area of about 400 μm2 and an impedance of 1–2 MΩ (at 1 kHz). The A1 probe was inserted approximately perpendicular to the cortical surface where each shank was positioned into a different frequency region in A1 (Redies et al. 1989; Wallace et al. 2000). The sites were inserted to a depth of about 700–900 μm, which corresponded approximately to layer IV (Wallace et al. 2000) and where we observed the strongest acoustic-driven activity. Because both sites on each shank were located in a similar frequency region, we used the site eliciting greater acoustic-driven activity for data analysis resulting in a total of eight A1 sites for each animal. After placement of each electrode array, the brain was covered with agarose to reduce swelling, pulsations, and drying. In some animals, the AMI array was inserted into multiple locations along the isofrequency dimension of the ICC.
Fig. 2.
Drawings of the AMI array and the eight-shank silicon-substrate Michigan probe positioned along the tonotopic gradient of ICC (A) and A1 (B), respectively. Anatomy in A and B were derived from images presented in Malmierca et al. (1995) and Wallace et al. (2000), respectively (not drawn to scale). Drawing in B was reproduced from Lim and Anderson (2006) and used with permission from the American Physiological Society (Bethesda, MD). DC, dorsocaudal cortex; F, frequency; ICD, inferior colliculus dorsal cortex; ICX, inferior colliculus external cortex; SC, superior colliculus.
Stimulation and recording setup
Experiments were conducted in a sound-attenuating chamber and controlled by a computer interfaced with TDT hardware (Tucker-Davis Technology, Alachua, FL) using custom software written in MATLAB script (Mathworks, Natick, MA). The TDT-MATLAB system digitally generated both the acoustic and electrical stimuli at a 100 kHz D/A sampling rate (24-bit). For recording, all neural signals were passed through analog DC-blocking and anti-aliasing filters from 1.6 Hz to 7.5 kHz, and digitized at 25 kHz sampling rate (16-bit).
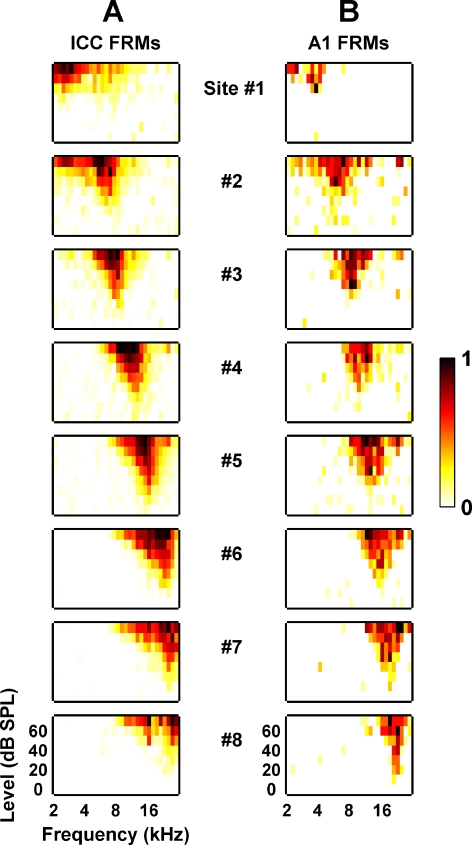
For acoustic stimulation, sound was presented via a speaker coupled to the left ear through a hollow ear bar. The speaker-ear bar system was calibrated using a 0.25-in. Brüel & Kjaer condenser microphone (Naerum, Denmark) where the tip of the ear bar was inserted into a short plastic tube with the microphone inserted into the other end. The tube represented the ear canal. To aid in the positioning of the electrode arrays, varying levels of pure tones and broadband noise that were 50 ms in duration, with 5 and 0.5 ms rise/fall ramp times, respectively, were presented to elicit acoustic-driven activity in the contralateral ICC and A1. Poststimulus time histograms (PSTH) and frequency response maps (FRM) were then plotted to confirm array placement in the ICC and A1 (for details, see Methods: Data analysis). Figure 3A and B show examples of FRMs recorded in the ICC and A1, respectively, from the same animal. Even with the large sites of the AMI, we were still able to record neural activity within the ICC to aid in placement of the AMI array. We were unable to span the entire guinea pig frequency range (∼0.05–45 kHz, roughly spanning 3.5 mm in A1) with the limited length spanned by our A1 probe sites (1.4 mm). Thus, we spanned a frequency range between about 2 and 30 kHz, which allowed us to simultaneously sample reasonably low and high frequencies.
Fig. 3.
Frequency response maps recorded on eight different sites linearly spaced (200 μm apart) along the tonotopic gradient of the ICC (A) and A1 (B) as shown in Figure 2. Site 1 corresponds to the lowest BF site for both the AMI array and A1 probe. The lowest BF site corresponds to the site furthest away from the tip along the AMI array and the site located on the most rostral shank of the A1 probe. For each FRM, the abscissa is frequency (2–30 kHz, 8 steps/octave) and the ordinate is stimulus intensity (0–70 dB SPL, 10 dB steps). The colorscale corresponds to normalized driven spike rate where all negative FRM values were set to zero to improve visualization (for more details, see Methods: Data analysis). Generally, due to the large sites of the AMI array, the ICC FRMs exhibited broad distribution patterns across the frequency axis (compared with what is usually reported in other studies; Snyder et al. 2004, Lim and Anderson 2006).
After placement of both arrays, the AMI was connected to an optically isolated current stimulator. Each selected AMI site was stimulated as an active electrode where the return was through a wire positioned in a neck muscle (monopolar configuration). Electrical stimuli consisted of single biphasic, charge-balanced pulses (200 μs/phase, cathodic-leading) ranging between 1 and 100 μA in dB steps (relative to 1 μA). The maximum current we could deliver with our stimulation setup was 100 μA. Forty trials of each stimulus, including 40 no-stimulus (spontaneous) trials, were presented at 2/s in a randomized sequence across all sites and levels to reduce adaptive effects. Neural data were recorded on all A1 sites in response to stimulation of each AMI site. The recording ground was positioned under the skin about 2 cm rostral to bregma.
Data analysis
We performed analysis on multiunit activity in response to acoustic and electrical stimulation. We also analyzed evoked potentials recorded in A1 in response to AMI stimulation, which will be discussed later. For multiunit analysis, the neural signal was bandpass-filtered between 0.3 and 3 kHz. Any value exceeding 3.5 times the standard deviation of the background (without spikes) neural signal was detected as a spike. The time occurrence of a spike (timestamp) corresponded to the largest peak (positive or negative) of that spike. Once a spike was detected, we waited 1 ms before detecting another spike on the same recording site to avoid selecting the same spike more than once. We then displayed the timestamps as PSTHs across 40 trials. For electrical stimulation in the ICC, we removed the stimulus artifact recorded on each A1 site, which resulted in the elimination of all spikes between 0 and 2 ms from stimulus onset. Based on visual inspection of the PSTHs, we did not observe stimulus-driven spike activity with latencies as short as 2 ms except at very high stimulus levels where spike latencies began to approach 2 ms.
Below, we present our methods for calculating the various parameters used in this article. Initially, we characterized the acoustic-driven spike activity recorded on our AMI and A1 sites to aid in placement of the arrays. We then recorded the neural activity on all A1 sites in response to electrical stimulation (single pulses) of each site along the AMI array. Out of 20 AMI sites, we only stimulated those that were located within the ICC (based on the FRMs) and coincided with the frequency regions of the A1 sites. In some animals, more than one AMI placement was made. For analysis, we used a total of eight A1 sites (one site from each shank) aligned along the tonotopic gradient of A1 for each animal.
Driven spike rate
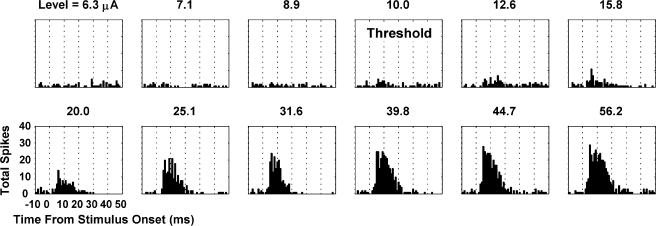
The driven spike rate was taken as the total spike rate minus the spontaneous spike rate and was calculated from the PSTHs for a set time window. This window was selected based on visual assessment of all the PSTHs (compared with the spontaneous PSTHs where no stimulus was presented) and what has been used for other ICC (Syka et al. 2000; Snyder et al. 2004) and A1 (Arenberg et al. 2000; Bierer and Middlebrooks 2002) recording studies. For acoustic stimulation where the stimulus duration was 50 ms, we used a time window from 5 to 65 ms after stimulus onset in the ICC (typically sustained responses) and 5 to 25 ms after stimulus onset in A1 (typically onset responses). For electrical stimulation, we used a time window from 2 (to avoid stimulus artifact) to 30 ms after stimulus onset. In general, AMI stimulation elicited cortical activity that lasted up to 20 to 30 ms across all levels (Fig. 4). Thus, our selected window was sufficient to capture the AMI-stimulated onset activity recorded in A1 and is consistent with what Bierer and Middlebrooks (2002) used for their CI stimulated A1 responses.
Fig. 4.
Poststimulus time histograms (1-ms bins) recorded on an A1 site (BF = 8 kHz) in response to varying levels of electrical stimulation of an AMI site (BF = 7 kHz). Threshold was determined using a visual method (for more details, see Methods: Data analysis).
Best frequency
Pure tones varying in frequency (2–30 kHz, 8 steps/octave) and level (0–70 dB SPL, 10 dB steps) were each presented for four trials all in a randomized sequence at 1/s. For each recording site, we calculated the driven spike rate in response to each stimulus and normalized it by the maximum spike rate across all stimuli. We then plotted all the normalized spike rates as a FRM (Fig. 3). The best frequency (BF) was calculated by taking the centroid of activity across a user-defined bandwidth 10 dB above visual threshold.
Electrical threshold
Threshold was visually selected from the PSTHs as the current level injected into the ICC that increased the across-trial spike activity in A1 just above spontaneous activity (Fig. 4).
Evoked-potential magnitude and latency
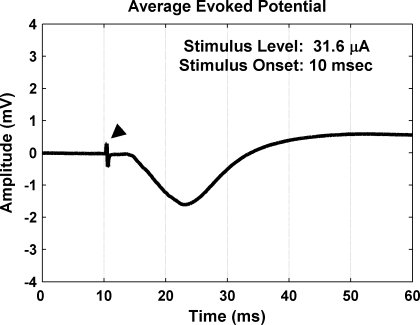
Evoked potentials were obtained by averaging (across 40 trials) the neural signals recorded on each A1 site for a stimulated AMI site and level. Figure 5 displays a typical example of an averaged evoked potential with the stimulus artifact present (arrowhead). The evoked potential consisted of a negative deflection that then increased above baseline for tens of milliseconds. The magnitude was taken as the voltage difference between the baseline and the negative peak. Because the baseline value could shift over time before stimulus onset, we used the baseline value at stimulus onset. The latency was taken as the difference between the time of stimulus onset and the negative peak.
Fig. 5.
Averaged evoked potential (40 trials) recorded in A1 in response to stimulation of an AMI site within the ICC. Arrowhead points to the stimulus artifact.
A1 image width
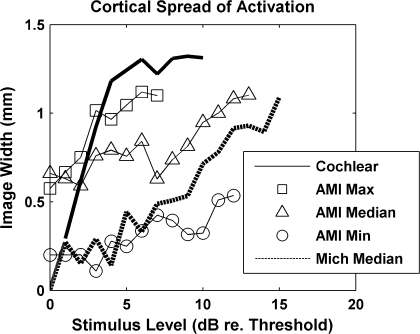
The method for computing the extent of activation spread along the tonotopic gradient of A1 in response to AMI stimulation was taken from Bierer and Middlebrooks (2002) to enable comparison of our AMI results with their CI results. We computed rate-level functions for all eight A1 recording sites in response to stimulation of a given AMI site. These eight sites were linearly spaced (0.2 mm intervals) along the tonotopic gradient of A1. For each A1 site, we normalized the rate-level function by the maximum driven spike rate obtained for that A1 site across all AMI stimulation sites and current levels to emphasize stimulus-driven activity relative to the maximum amount of activity that could be elicited on that A1 site. From the eight normalized rate-level functions that each corresponded to a different cortical place, we calculated the area under the plot of normalized spike rate versus cortical place (in mm) for a given stimulus level. We then divided this area by the maximum normalized spike rate for that stimulus level. The result was the width of a rectangle of unit height with area equal to the area under the normalized spike rate versus cortical place curve. We plotted these image widths versus stimulus level relative to the lowest threshold observed across all eight A1 sites (see Fig. 10 for examples).
Fig. 10.
Primary auditory cortex image width curves plotted as a function of stimulus level relative to threshold (in dB). AMI image width curves corresponding to the maximum, median, and minimum spreading observed in A1 are presented. The median curve for spreading in A1 in response to ICC stimulation via a Michigan silicon-substrate probe with 400 μm2 sites was calculated from data obtained in another study (Lim and Anderson 2006). A typical cochlear image width curve was taken from Bierer and Middlebrooks (2002) and scaled appropriately to match the ordinate and abscissa scales presented in this figure.
Results
All analyses are based on data obtained for 14 AMI array placements in 11 animals. For each AMI array placement, four to seven sites positioned within the ICC and spanning a similar BF range as the A1 sites were used for stimulation. Neural activity (multiunit and evoked potentials) was recorded on eight A1 sites (each in a different BF region) in response to each stimulated AMI site (75 total sites). Stimulus levels up to 56 μA were used for 42 sites, and up to 100 μA for 33 sites.
In general, electrical stimulation within the ICC elicited spike activity within A1 that lasted usually between 10 and 30 ms (Fig. 4). As the stimulus level was increased, A1 spike activity increased in rate and duration in a monotonic manner. Out of 75 AMI sites and even up to 100 μA, stimulation of only three sites elicited nonmonotonic rate-level functions for spike activity in A1. Nonmonotonicity corresponded to a rate-level function where the spike rate at the highest stimulus level (i.e., 56 or 100 μA) decreased to <0.75 times the maximum spike rate across all the levels. We also assessed the monotonic behavior of the evoked-potential magnitudes recorded in A1 in response to stimulation of our AMI sites. Nonmonotonicity corresponded to a magnitude-level function where the evoked-potential magnitude at the highest stimulus level decreased to <0.75 times the maximum magnitude across all the levels. Stimulation of all 75 AMI sites exhibited monotonically increasing evoked potentials in A1 even up to 100 μA. The three AMI sites that elicited nonmonotonic spike activity but monotonic evoked-potential behavior demonstrates the macroscopic scale of the evoked potential that does not always reflect the activity of individual neurons close to our recording sites. Overall, it appears that cortical neurons can code for AMI stimulus levels that exceed 100 μA. It is possible that if higher stimulus levels are used, nonmonotonic behavior may be more frequently observed for both spike and evoked-potential activity.
Stimulation thresholds
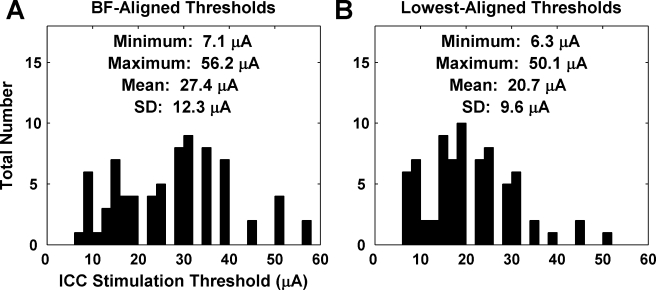
Thresholds were calculated from the responses recorded on the A1 sites with the closest BF to the stimulated AMI sites and are presented in Figure 6A. The mean threshold for this BF-aligned analysis was 27.4 μA (SD 12.3). The lowest and highest thresholds we observed were 7.1 and 56.2 μA, respectively. Ideally, if a perfect point-to-point tonotopic mapping between ICC to A1 exists, the A1 site with the closest BF to the stimulated AMI site should have the lowest threshold. However, this was not always the case (see next section). Some A1 sites with BFs different from the closest BF value exhibited the lowest threshold. The mean threshold for these lowest threshold sites was 20.7 μA (SD 9.6; Fig. 6B). The lowest and highest thresholds we observed were 6.3 and 50.1 μA, respectively.
Fig. 6.
(A) Electrical thresholds for neural activation on A1 sites with the closest BF to the stimulated AMI sites (n = 75). (B) Electrical thresholds for neural activation on A1 sites with the lowest threshold for the stimulated AMI sites (n = 75).
Lim and Anderson (2006) performed similar experiments (same stimulus parameters and guinea pig model) to those presented in this study, except they used an experimental silicon-substrate Michigan probe with stimulation sites (circular) exposed on only one side of the probe and each with an area of about 400 μm2. Their sites were significantly smaller than our AMI sites (126,000 μm2). Using the same threshold method presented in this study for their data, they obtained a mean threshold for the BF-aligned analysis of 14.0 μA (SD 7.3, n = 88) with a lowest and highest value of 3.2 and 40.0 μA, respectively (H. H. Lim, unpublished observation). For the lowest-aligned analysis, they obtained a mean threshold of 11.6 μA (SD 6.8, n = 88) with a lowest and highest value of 2.5 and 35.5 μA, respectively. These threshold values are about twofold lower than the AMI stimulation thresholds. Considering that the AMI sites are over 300 times larger than the Michigan probe sites but only require a twofold increase in thresholds (total charge), the charge densities for activation appear to be much better for the AMI sites. There are “edge effects” of higher charge density toward the contact edges that may be affecting the thresholds more than the overall surface area of the site and the total charge. However, even if all the charge is distributed along the perimeter of the sites, the AMI sites would still have a charge density roughly 20 times lower than the Michigan probe sites. This estimate uses the total circumference of an AMI site along both edges of the ring contact and only the circumference of a Michigan probe site along the exposed circular edge. Overall, the AMI sites provide better charge densities for activation but with higher total charge than the 400 μm2 Michigan probe sites.
We also compared our AMI stimulation thresholds with those obtained for CI stimulation. Using similar stimulation parameters (200 μs/phase single monopolar pulses) and A1 recordings in a guinea pig model, Bierer and Middlebrooks (2002) obtained a median threshold for CI stimulation of 67.2 μA (5th percentile: 37.8 μA, 25th: 53.3, 75th: 75.4, 95th: 119.4). We obtained a median threshold value of 20.0 μA (5th percentile: 6.3 μA, 25th: 14.1, 75th: 25.1, 95th: 35.5), which is about 10 dB lower. Different methods were used for threshold calculation. They calculated thresholds by taking the stimulus level corresponding to 0.25 of the saturated (maximum) driven spike rate for their lowest threshold A1 sites. We were not able to use this more conservative method for comparison because almost all of our rate-level functions were nonsaturating. However, Bierer and Middlebrooks (2002) demonstrated that CI stimulation results in steep rate-level functions for the elicited cortical activity. This results in narrow dynamic ranges, thus resulting to small dB variations across different threshold calculation methods. Based on a typical rate-level curve (Fig. 1) Bierer and Middlebrooks presented, thresholds should not decrease more than about 2 dB using our threshold method. Thus, AMI stimulation elicits lower thresholds for cortical activation than CI stimulation, which is expected due to the immediate vicinity of the AMI sites to the target neurons in the ICC.
Frequency-specific activation
As shown in Figure 7, frequency-specific stimulation was generally achievable in the ICC using the AMI array. Electrical stimulation of a low BF region in ICC elicited spike activity in a low BF region within A1, whereas stimulation of higher BF ICC regions elicited activity in higher BF A1 regions. However, spike activity was broadly elicited across the tonotopic gradient of A1, even at stimulus levels slightly above threshold. This activation spread was broader than what was observed by Lim and Anderson (2006) in response to stimulation of 400 μm2 sites (see next section).
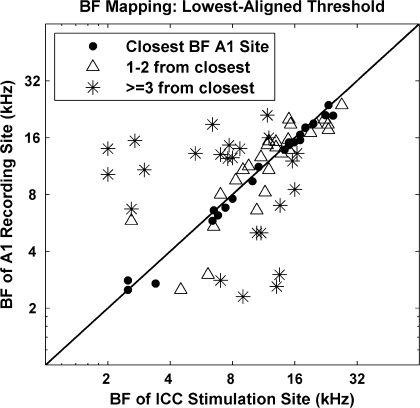
Although the large sites of the AMI array produced broad activation patterns along the tonotopic gradient of A1, we wanted to assess if frequency-specific information was still accurately transmitted to higher centers. To partially address this question, we plotted the BF of the A1 site with the lowest threshold for a stimulated AMI site against the BF of that AMI site (Fig. 8). Perfect mapping is depicted by the diagonal line in which stimulation of an AMI site causes activity with the lowest threshold for an A1 site with the same BF. However, because perfect BF alignment between the ICC and A1 sites was not always possible due to the set geometry of the electrode sites, we represented the closest possible BF alignment with dots. Stimulation of 31% (dots, n = 23) of the AMI sites elicited spike activity with the lowest threshold on A1 sites with the closest BF. Stimulation of 36% (triangles, n = 27) of the AMI sites elicited the lowest thresholds on A1 sites with BFs that were still only one to two sites away from the closest BF site. The fact that about 67% of all the stimulated AMI sites elicited the lowest threshold on A1 sites with approximately similar BFs (≤2 sites away) demonstrates that the AMI electrode array can achieve frequency-specific stimulation. However, there were cases (33%; asterisks, n = 25) where AMI stimulation caused the lowest threshold of activation on an A1 site that had a BF different (three or more sites away) from that of the stimulated AMI site.
Fig. 8.
Best frequency mapping plot demonstrating the tonotopic nature of ICC to A1 projections. The BF of the A1 site with the lowest threshold for a stimulated AMI site is plotted against the BF of that AMI site. Diagonal line depicts perfect mapping, which is not always possible due to the set geometry of the electrode sites, thus inherent BF misalignment. ●, closest BF site; △, 1 to 2 sites away from closest BF site; ✳, >2 sites away. Distribution of symbols: ●, n = 23; △, n = 27; ✳, n = 25.
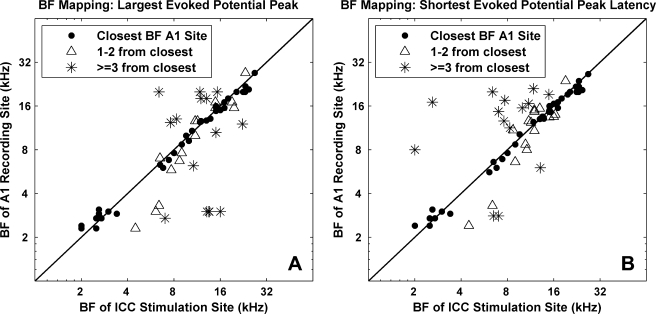
In addition to threshold levels, we wanted to assess if frequency-specific information was accurately transmitted for higher current levels. To achieve this, we assessed if stimulation of an ICC region elicited the largest amplitude and shortest latency-evoked potential in the closest-aligned BF A1 region for varying levels (Fig. 9). The advantage of analyzing evoked potentials is that we could assess a more global measure of activity elicited throughout A1 versus the few discrete regions where we recorded spike activity. Furthermore, the maximum spike activity could vary from site to site depending on the number and types of neurons recorded on each site, making it difficult to determine which A1 region actually exhibited the greatest relative activity. Evoked potentials were not used to assess frequency specificity at threshold levels because spike thresholds provided a more sensitive measure than evoked-potential thresholds. Figures 9 and 10 correspond to evoked potentials elicited with a stimulus level 5 dB above threshold (corresponding to the thresholds in Figure 6B) for each AMI site. Six sites were not included in this analysis because they were not stimulated with high enough levels.
Fig. 9.
Best frequency mapping plots for evoked-potential properties (magnitude and latency) at 5 dB above electrical threshold for each AMI site (n = 69). (A) The BF of the A1 site with the largest evoked-potential peak for a stimulated AMI site is plotted against the BF of that AMI site. Diagonal line depicts perfect mapping, which is not always possible due to the set geometry of the electrode sites, thus inherent BF misalignment. ●, closest BF site; △, 1 to 2 sites away from closest BF site; ✳, >2 sites away. Distribution of symbols: ●, n = 37; △, n = 16; ✳, n = 16. (B) The BF of the A1 site with the shortest latency evoked-potential peak for a stimulated AMI site is plotted against the BF of that AMI site. Distribution of symbols: ●, n = 39; △, n = 16; ✳, n = 14.
In Figure 9A, we plotted the BFs of the A1 sites with the largest evoked-potential peaks for the stimulated AMI sites against the BFs of those AMI sites. Stimulation of 54% (dots, n = 37 out of 69) of the AMI sites elicited the largest evoked potentials on A1 sites with the closest BF. Stimulation of 23% (triangles, n = 16) of the AMI sites elicited the largest evoked potentials on A1 sites with BFs that were still only one to two sites away from the closest BF sites. Thus, a total of 77% of the stimulated AMI sites elicited the largest evoked potentials on A1 sites with approximately similar BFs, whereas about 33% (asterisks, n = 16) had BFs different (three or more sites away) from those of the stimulated AMI sites. Similar trends were observed for evoked-potential peak latencies where stimulation of 80% (dots, n = 39; triangles, n = 16) of the AMI sites elicited the shortest latencies on A1 sites with approximately similar BFs, whereas only about 20% (asterisks, n = 14) had BFs that were different (Fig. 9B). In general, stimulation of an AMI site usually elicited the largest evoked potential with the shortest latency on an A1 site with an approximately similar BF for varying stimulus levels up to 100 μA. These findings demonstrate that electrical stimulation via the AMI array can elicit frequency-specific cortical activation at threshold and higher current levels.
Cortical spread of activation
Frequency-specific cortical activation was achievable via AMI stimulation. However, in comparison with the results presented by Lim and Anderson (2006) for the Michigan probe (400 μm2 sites), AMI stimulation elicited spatially broader and more discontinuous activation patterns. Figure 10 presents the image width curves for the maximum, median, and minimum activation spread we observed across all stimulated AMI sites. The median image width curve for stimulation across all the Michigan probe sites obtained by Lim and Anderson (2006) was calculated and plotted in Figure 10 (H. H. Lim, unpublished observation). In comparison with Michigan probe stimulation, AMI stimulation elicited less activation spread for only 12% (9 out of 75) of the sites. Figure 10 presents the AMI curve that exhibited the least activation spread (AMI Min) across all stimulated sites, which is still only slightly below the Michigan probe curve. Thus, AMI stimulation generally elicited broader activation patterns than Michigan probe stimulation.
To provide an idea of how broad AMI stimulation patterns are in comparison with CI stimulation, we also included a typical CI image width curve taken from Bierer and Middlebrooks (2002). Similar stimulation parameters (i.e., 200 μs/phase monopolar single pulses) in a guinea pig model were used. Out of all 75 stimulated AMI sites, none elicited spread of activity greater than that elicited by CI stimulation. For lower stimulus levels, the AMI curve values were usually larger than those of the CI curve. However, due to the rapid increase of activation spread and saturation (1.4 mm) of the CI curve within 5 dB, the AMI image width curves were always lower within a few dB above threshold. This is demonstrated by the AMI image width curve that elicited the greatest activation spread (AMI Max), which is approximately similar to or lower than the CI curve by about 2 dB above threshold. Furthermore, only when stimulus levels exceeded at least 12 dB above threshold did saturation occur for AMI stimulation. Although Bierer and Middlebrooks (2002) used a more conservative threshold calculation method, which would shift the CI curve to the right, unless the thresholds were affected by more than 5 dB, the CI curve would still exhibit greater spreading than the median AMI curve. As discussed previously, based on data presented by Bierer and Middlebrooks (2002), thresholds should not shift by more than about 2 dB. Furthermore, the AMI array was designed for human application. Considering that the human ICC (roughly 3.5 mm based on Figure 7 in Geniec and Morest 1971) is larger than the guinea pig ICC (roughly 3 mm based on Figure 1E in Malmierca et al. 1995) along its tonotopic axis, it suggests that AMI activation spread in humans may be even less than what was presented in this study in guinea pigs. Overall, AMI stimulation appears to elicit greater activation spread than observed for Michigan probe stimulation (with 400 μm2 sites), but still less activation spread than what is elicited by CI stimulation.
AMI placement effects
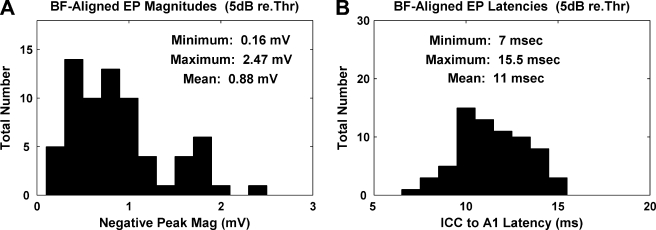
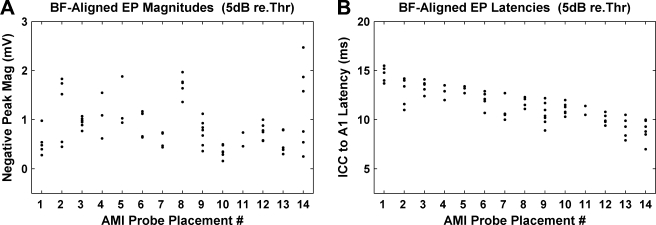
In Figure 11, we plotted the histograms for the evoked-potential peak magnitudes (A) and latencies (B) recorded in A1 in response to stimulation of the AMI sites with the closest BF at a stimulus level 5 dB above electrical threshold. The peak magnitudes varied between 0.16 and 2.47 mV and the latencies varied between 7 and 15.5 ms. One question that arises is why the magnitudes and latencies exhibited large variations for the same stimulus level (dB) above threshold. In an attempt to explain this variation, we plotted the evoked-potential magnitudes and latencies for each AMI array placement (Fig. 12). There were a total of 14 AMI array placements in 11 animals. The AMI probe placement number was reordered in the same way in Figure 12A and B with respect to decreasing latency values in Figure 12B for visualization purposes.
Fig. 11.
Magnitudes (A) and latencies (B) for evoked potentials recorded on A1 sites with the closest BF to the stimulated AMI sites at 5 dB above electrical threshold (n = 69).
Fig. 12.
Magnitudes (A) and latencies (B) presented in Figure 11 but plotted as a function of AMI array placement number reordered with respect to decreasing latencies in B for visualization purposes. Probe placements 1 and 10, 5 and 14, and 7 and 8 are each from the same animal. Placement no. (total number of sites, total magnitude range in mV, total latency range in ms): 1 (5, 0.70, 1.8); 2 (5, 1.29, 3.0); 3 (6, 0.30, 1.7); 4 (3, 0.93, 1.5); 5 (3, 0.94, 0.7); 6 (6, 0.52, 2.2); 7 (4, 0.30, 2.7); 8 (5, 0.61, 1.2); 9 (7, 0.75, 3.3); 10 (6, 0.34, 1.7); 11 (2, 0.28, 1.4); 12 (6, 0.43, 1.4); 13 (5, 0.50, 2.6); 14 (6, 1.93, 3.0). For some array placements, fewer points than listed are visible due to overlapping (similar) values.
One observation common to both Figure 12A and B is that for many of the AMI array placements, the magnitudes and latencies for each placement were clustered within a small range. For example, stimulation at 5 dB above threshold of all five sites on array placement 1 in Figure 12B elicited evoked-potential latencies that were between 13.7 and 15.5 ms. Although some of the array placements had larger latency ranges, in general, stimulation of sites on a given array placement elicited a significantly smaller range (≤3.3 ms) compared with the total range across all placements (8.5 ms). One hypothesis is that stimulation of different regions along the isofrequency laminae of the ICC elicits evoked potentials within A1 with different latencies. This is supported by the fact that array placement 1 and 10 in Figure 11B are from the same animal and correspond to recordings from the same A1 probe placement, yet they have different latency ranges (13.7–15.5 versus 10.3–12.0 ms, respectively). Both array placements were aligned along the tonotopic gradient of the ICC but in different isofrequency locations. Similarly, array placement 5 and 14 correspond to the same A1 probe placement and animal; yet, they also have different latency ranges (11.5–12.3 versus 7.0–10.0 ms, respectively). Thus, it appears that location of stimulation along the isofrequency dimension of the ICC can affect the evoked-potential latencies in A1. Probe placement 7 and 8 also correspond to the same A1 probe placement and animal, yet they do not have different latencies (10.0–12.7 versus 11.1–12.3 ms, respectively). This suggests that whereas stimulation of certain regions along the isofrequency dimension of the ICC produces cortical activation with different latencies, stimulation of other regions can result in similar latencies.
Although not as apparent as the results presented in Figure 12B, the evoked-potential magnitudes for many of the array placements (nos. 3, 6, 7, 8, 10, 11, 12, and 13) in Figure 12A were clustered together within a small range (≤0.61 mV) compared with the total range across all array placements (2.31 mV). This suggests that stimulation of sites aligned along a single tonotopic trajectory within the ICC can elicit evoked potentials with similar magnitudes within A1. It also appears that stimulation along different tonotopic trajectories within the ICC can elicit evoked potentials with different magnitudes. Probe placements 7 and 8 correspond to the same A1 probe placement and animal, yet they have different magnitude ranges (0.44–0.72 versus 1.36–1.97 mV, respectively). Probe placement 7 consists of a total of four sites where values for two sites are not visible due to similar magnitude values as the other sites. As for the array placements (nos. 2, 4, 5, 14) that resulted in broadly distributed magnitudes, it is not yet clear if they are caused by placement effects within the ICC or within A1. Future experiments aimed at stimulating multiple regions within an isofrequency lamina of the ICC and recordings from the same A1 probe placements will confirm if a systematic organization of A1 evoked-potential magnitudes and latencies exists as a function of stimulation location along the isofrequency dimension of the ICC.
Discussion
The goal of this study was to assess if electrical stimulation of the ICC via a human prototype AMI array would achieve low thresholds and frequency-specific activation. We electrically stimulated different regions along the tonotopic axis of the ICC using the AMI array and recorded the corresponding neural activity along the tonotopic gradient of A1 using a multisite Michigan probe. Based on our results, the AMI array achieves stimulation thresholds that are generally lower than those achieved by CI stimulation. Furthermore, frequency-specific cortical activation via AMI stimulation is achievable. Although AMI stimulation elicits broader spike activation patterns across the tonotopic gradient of A1 (and higher thresholds) compared with what is achieved using the experimental Michigan probe with 400 μm2 sites, it still elicits less activation spread than that of CI stimulation. Implications of these results for AMI implementation are discussed below.
Safe stimulation levels
In this study, we determined thresholds for AMI stimulation. Considering that the AMI sites are larger than the stimulation sites used by Lim and Anderson (2006), it is not surprising that the thresholds were higher (by about twofold). However, the thresholds appear to still be lower than what is achieved by CI stimulation. This is promising for the ability of the AMI to provide low current and effective stimulation of the central auditory pathways in humans. Furthermore, these low thresholds should enable activation with current levels that are safe for chronic CNS stimulation. The stimulation thresholds for the AMI sites ranged from about 6 to 60 μA, which for a 200 μs/phase pulse results in a total charge per phase of 1.2 to 12 nC. For 126,000 μm2 sites, this results in a charge density per phase ranging between about 1 and 10 μC/cm2. CNS stimulation studies (Agnew and McCreery 1990; McCreery et al. 1990) have shown that both charge per phase and charge density per phase affect the extent of neural damage induced by prolonged periods of electrical stimulation. In particular, greater charge per phase can be delivered if less charge density per phase is used and vice versa. Using a charge density per phase of about 10 μC/cm2 (7 hours of continuous stimulation at 50 Hz, anodic-leading biphasic pulses, 400 μs/phase) in cat parietal cortex, McCreery et al. (1990) demonstrated that safe neural stimulation up to 5000 nC/phase was possible. Even with differences in stimulation parameters and brain region, this charge per phase value is substantially higher than what was observed for our AMI thresholds (<12 nC/phase).
In terms of the maximum current level required for AMI stimulation, it is apparent from our results that levels above 100 μA using a 200 μs/phase pulse will be required. Stimulation of almost all our sites elicited nonsaturating activity in A1 up to 100 μA. Even if the maximum current level reaches up to 500 μA, the total charge per phase and charge density per phase will still only be about 100 nC and 80 μC/cm2, respectively. Considering that McCreery et al. (1990) also achieved safe neural stimulation within the cat parietal cortex with per phase pulse parameters of 100 nC and 1600 μC/cm2, AMI stimulation up to 500 μA should be safe for neural activation within the ICC. Even using the conservative equation presented by R. V. Shannon for safe levels of CNS stimulation (Shannon 1992), a charge per phase of 100 nC should allow for a charge density per phase of 316 μC/cm2, which is still significantly higher than what our AMI sites would produce. Therefore, these results demonstrate that our AMI electrode array should be able to chronically inject current levels up to several hundred microamperes without inducing neural damage within the ICC and warrant further studies to translate it into clinical application.
Frequency coding
Based on our results (Figs. 8 and 9), frequency-specific activation of the ICC via our AMI array is achievable at threshold as well as higher current levels. This is promising for an auditory prosthesis because it allows for activation of different frequency channels of information and the potential to elicit different frequency and pitch percepts. However, there were instances (33%) where stimulation of a certain BF region within the ICC elicited activity in an A1 region with a different BF. Considering that Lim and Anderson (2006) observed BF-misaligned activity for only about 10% of their stimulated 400 μm2 iridium sites (circular) using the same A1 recording setup, it suggests that the reduced frequency specificity for the AMI sites is partially due to their larger dimensions. Anatomical studies have shown that the ICC consists of a complicated network of incoming and outgoing projections that can traverse across multiple frequency laminae (Oliver 2005). Thus, it is also possible that stimulation of a certain BF region may have activated passing fibers that elicited spike activity in cortical regions with different BFs regardless of site size. In future AMI patients, we will need to assess if the extent of frequency-specific activation achieved by the current AMI array design is sufficient for achieving intelligible speech perception. If not, then it may be necessary to modify (decrease) the dimensions of the AMI sites to improve frequency-specific stimulation. It may also be possible to use different stimulation strategies to reduce BF-misaligned activation. McIntyre and Grill (2000) have shown that different electrical waveform parameters (i.e., polarity, biphasic asymmetry) can be used to activate cells more effectively than fibers. If BF-misaligned activation is predominantly caused by stimulation of passing fibers, then specific stimuli designed to activate cells (more than fibers) may improve frequency-specific stimulation. Different electrode configurations (i.e., bipolar, quadrupolar) may also be effective in steering current (Jolly et al. 1996; Kral et al. 1998) to activate ICC regions with better frequency coding characteristics (e.g., containing less passing fibers) or even minimize spread of current especially at higher levels. The latter will be important for ensuring that frequency and pitch coding is not compromised due to losses in level coding. If BF-misaligned activation is present but is not dramatically affected by level, then it may be possible to reorder electrodes according to their pitch rank, as is commonly carried out in ABI fittings.
In addition to BF-misaligned activity, we also observed broad cortical activation patterns in response to AMI stimulation (compared with Michigan probe 400 μm2 site stimulation). The question arises as to how such broadness will limit hearing performance. Studies in normal hearing and CI subjects have shown that the ability to stimulate a greater number of discriminable frequency channels of information correlates with improved speech perception performance, especially in noisy environments (Friesen et al. 2001), as well as enhanced processing of more complicated sounds associated with sound localization and melody recognition (Smith et al. 2002). Considering that AMI stimulation elicits more localized, frequency-specific cortical activation than CI stimulation, AMI patients should be able to achieve a greater number of frequency channels of information than current CI patients. This improvement may be somewhat limited for levels close to threshold where we usually observed greater activation spread for AMI stimulation compared with CI stimulation. However, we will need to assess in future AMI patients if this overall improvement in tonotopic selectivity will be sufficient for achieving high levels of speech and sound perception, or if more localized activation, such as that observed with 400 μm2 sites, is necessary. It is important to note that the AMI was designed for human application. Thus, the larger dimension along the tonotopic axis of the human ICC (roughly 3.5 mm based on Figure 7 in Geniec and Morest 1971) compared with that of the guinea pig ICC (roughly 3 mm based on Figure 1E in Malmierca et al. 1995) should result in more narrow activation patterns than was observed in this study.
Although frequency-specific stimulation is achievable via the AMI array, it is not yet clear how stimulation along the isofrequency dimension of the ICC will affect different frequency and sound percepts. Anatomically, the ICC consists of two-dimensional laminae (Rockel and Jones 1973; Morest and Oliver 1984; Oliver and Morest 1984; Malmierca et al. 1995), which have shown to correspond to different frequency regions (Rose et al. 1963; Merzenich and Reid 1974; Serviere et al. 1984; Stiebler and Ehret 1985; Schreiner and Langner 1997). Along these isofrequency laminae, studies have shown that discrete ICC regions receive projections from different brainstem nuclei (Roth et al. 1978; Brunso-Bechtold et al. 1981; Shneiderman and Henkel 1987; Oliver et al. 1997; Ramachandran and May 2002; Loftus et al. 2004; Cant and Benson 2006) and correspond to different features of sound (e.g., binaurality, latency, intensity, frequency tuning, periodicity; Aitkin et al. 1985; Stiebler 1986; Langner and Schreiner 1987; Schreiner and Langner 1988; Ehret 1997). As a result, stimulation of different regions within an ICC lamina may elicit percepts corresponding to different sound features. This is consistent with Figure 12, which suggests that location of stimulation along the isofrequency dimension of the ICC affects the extent of cortical activity and latencies. Furthermore, it is not clear how stimulation of different regions within an ICC lamina will even affect frequency percepts. Neurons located across an entire ICC lamina respond to pure tone stimulation, suggesting that multiple ICC neurons with similar BFs are involved with coding frequency (Stiebler 1986). It has also been shown that different spectral (and temporal) components of sound are coded by a population of neurons within the ICC rather individual units (Suta et al. 2003). Thus, it is possible that activation of multiple regions along an ICC lamina may be necessary to elicit the desired frequency or pitch percepts. This will require the development of a three-dimensional electrode array that spans multiple isofrequency locations.
Other considerations
In this study, we demonstrated that electrical stimulation of the ICC via our AMI array elicits frequency-specific activation that may allow for a frequency-place coding scheme for stimulation. Although the ability to transmit spectral information is important for speech perception, the ability to faithfully code for the temporal structure of sound is essential (Shannon et al. 1995). For CIs, temporal information is transmitted by amplitude-modulated pulses. However, unlike auditory nerve fibers, neurons located higher along the auditory pathway, such as in the ICC or A1, are less capable of phase locking to the stimuli (Langner 1992; Langner and Schreiner 1988; Lu et al. 2001; Lu and Wang 2004). This has been attributed to the hypothesis that temporal coding becomes partially transformed into a spatial representation of sound within higher auditory centers. As a result, temporal coding in AMI patients may not only involve temporal patterns of activation but may also depend on spatial activation along and within different isofrequency ICC laminae. Therefore, studies assessing the effects of different temporal stimulation patterns (e.g., pulse duration, pulse rate, amplitude modulation rate, and modulation depth) within multiple regions of the ICC will need to be investigated. This will provide insight as to how to transmit temporal information, in addition to spectral information, to higher perceptual centers, and achieve intelligible speech perception via AMI stimulation.
Not only must we determine what stimulation strategies to use, but also where to implant the AMI within the ICC. The ICC is a three-dimensional structure consisting of two-dimensional, inhomogeneous isofrequency laminae (Oliver 2005). Therefore, location of implantation and stimulation may affect performance. Currently, we are investigating different surgical approaches in cadavers as well as assessing different stimulation location effects within the ICC in animal models to provide insight as to where the AMI should be implanted. In the first AMI patients, we will implant the AMI into an ICC region that has provided positive results in animal experiments. Depending on how well these AMI implantees perform, we will then implant the AMI into different ICC regions and assess how location (based on CT/MRI of the array) affects performance in future AMI patients. Ultimately, we hope that an appropriate region within the ICC can be identified for AMI implantation, and that simple stimulation strategies will be sufficient for achieving intelligible speech perception.
Acknowledgments
We thank James Wiler for surgical assistance; Jamille Hetke for assistance in the A1 probe design and development; Frank Risi for assistance in the AMI design and development; and Chris Ellinger, Jack Briggs, and Dwayne Vailliencourt for technical support. We also thank Drs. Guenter Reuter, Gerrit Paasche, and Uta Reich for their technical assistance. The multisite A1 probes were provided by the University of Michigan Center for Neural Communication Technology, which was supported by NIH P41 EB2030. The AMI array was provided by Cochlear Ltd. (Lane Cove, Australia). This research was funded by the NIH through P41 EB2030, P30 DC05188, T32 DC00011, and F31 DC007009; Cochlear Ltd.; and the University of Michigan Center for Wireless Integrated MicroSystems (NSF Engineering Research Center). Experiments were performed at Kresge Hearing Research Institute (University of Michigan).
Footnotes
Minoo Lenarz and Hubert H. Lim contributed equally as first authors.
References
- Agnew WF, McCreery DB. Effects of prolonged electrical stimulation of the central nervous system. In: Agnew WF and McCreery DB (eds) Neural Prostheses: Fundamental Studies. Englewood Cliffs, Prentice-Hall, Inc., pp. 225–252, 1990.
- Aitkin LM, Pettigrew JD, Calford MB, Phillips SC, Wise LZ. Representation of stimulus azimuth by low-frequency neurons in inferior colliculus of the cat. J. Neurophysiol. 53:43–59, 1985. [DOI] [PubMed]
- Ammirati M, Bernardo A, Musumeci A, Bricolo A. Comparison of different infratentorial–supracerebellar approaches to the posterior and middle incisural space: A cadaveric study. J. Neurosurg. 97:922–928, 2002. [DOI] [PubMed]
- Anderson DJ, Najafi K, Tanghe SJ, Evans DA, Levy KL, Hetke JF, Xue XL, Zappia JJ, Wise KD. Batch-fabricated thin-film electrodes for stimulation of the central auditory system. IEEE Trans. Biomed. Eng. 36:693–704, 1989. [DOI] [PubMed]
- Arenberg JG, Furukawa S, Middlebrooks JC. Auditory cortical images of tones and noise bands. J. Assoc. Res. Otolaryngol. 1:183–194, 2000. [DOI] [PMC free article] [PubMed]
- Bierer JA, Middlebrooks JC. Auditory cortical images of cochlear-implant stimuli: Dependence on electrode configuration. J. Neurophysiol. 87:478–492, 2002. [DOI] [PubMed]
- Brackmann DE, Hitselberger WE, Nelson RA, Moore J, Waring MD, Portillo F, Shannon RV, Telischi FF. Auditory brainstem implant: I. Issues in surgical implantation. Otolaryngol. Head Neck Surg. 108:624–633, 1993. [DOI] [PubMed]
- Brunso-Bechtold JK, Thompson GC, Masterton RB. HRP study of the organization of auditory afferents ascending to central nucleus of inferior colliculus in cat. J. Comp. Neurol. 197:705–722, 1981. [DOI] [PubMed]
- Cant NB, Benson CG. Organization of the inferior colliculus of the gerbil (Meriones unguiculatus): Differences in distribution of projections from the cochlear nuclei and the superior olivary complex. J. Comp. Neurol. 495:511–528, 2006. [DOI] [PMC free article] [PubMed]
- Colletti V, Shannon RV. Open set speech perception with auditory brainstem implant? Laryngoscope 115:1974–1978, 2005. [DOI] [PubMed]
- Drake KL, Wise KD, Farraye J, Anderson DJ, BeMent SL. Performance of planar multisite microprobes in recording extracellular single-unit intracortical activity. IEEE Trans. Biomed. Eng. 35:719–732, 1988. [DOI] [PubMed]
- Ehret G. The auditory midbrain, a “shunting yard” of acoustical information processing. In: Ehret G and Romand R (eds) The Central Auditory System. New York, Oxford University Press, Inc., pp. 259–316, 1997.
- Evans DG, Huson SM, Donnai D, Neary W, Blair V, Teare D, Newton V, Strachan T, Ramsden R, Harris R. A genetic study of type 2 neurofibromatosis in the United Kingdom. I. Prevalence, mutation rate, fitness, and confirmation of maternal transmission effect on severity. J. Med. Genet. 29:841–846, 1992. [DOI] [PMC free article] [PubMed]
- Friesen LM, Shannon RV, Baskent D, Wang X. Speech recognition in noise as a function of the number of spectral channels: comparison of acoustic hearing and cochlear implants. J. Acoust. Soc. Am. 110:1150–1163, 2001. [DOI] [PubMed]
- Geniec P, Morest DK. The neuronal architecture of the human posterior colliculus. A study with the Golgi method. Acta. Otolaryngol. Suppl. 295:1–33, 1971. [PubMed]
- Hitotsumatsu T, Matsushima T, Inoue T. Microvascular decompression for treatment of trigeminal neuralgia, hemifacial spasm, and glossopharyngeal neuralgia: three surgical approach variations: technical note. Neurosurgery 53:1436–1441; discussion 1442–1433, 2003. [DOI] [PubMed]
- Jolly CN, Spelman FA, Clopton BM. Quadrupolar stimulation for cochlear prostheses: Modeling and experimental data. IEEE Trans. Biomed. Eng. 43:857–865, 1996. [DOI] [PubMed]
- Kral A, Hartmann R, Mortazavi D, Klinke R. Spatial resolution of cochlear implants: The electrical field and excitation of auditory afferents. Hear. Res. 121:11–28, 1998. [DOI] [PubMed]
- Laborde G, Gilsbach JM, Harders A, Seeger W. Experience with the infratentorial supracerebellar approach in lesions of the quadrigeminal region, posterior third ventricle, culmen cerebelli, and cerebellar peduncle. Acta. Neurochir. (Wien) 114:135–138, 1992. [DOI] [PubMed]
- Langner G. Periodicity coding in the auditory system. Hear. Res. 60:115–142, 1992. [DOI] [PubMed]
- Langner G, Schreiner CE. Topology of functional parameters in the inferior colliculus of the cat. In: Elsner N and Creutzfeldt OD (eds) New Frontiers in Brain Research. Stuttgart, Thieme, p. 122, 1987.
- Langner G, Schreiner CE. Periodicity coding in the inferior colliculus of the cat. I. Neuronal mechanisms. J. Neurophysiol. 60:1799–1822, 1988. [DOI] [PubMed]
- Lenarz M, Matthies C, Lesinski-Schiedat A, Frohne C, Rost U, Illg A, Battmer RD, Samii M, Lenarz T. Auditory brainstem implant part II: Subjective assessment of functional outcome. Otol. Neurotol. 23:694–697, 2002. [DOI] [PubMed]
- Lenarz T, Reuter G, Paasche G, Lenarz M, Gibson P, Mackiewicz M. Auditory midbrain implant (AMI)—Ein neues therapiekonzept fur neurale taubheit. HNO Info. 28:146, 2003.
- Lenarz M, Reuter G, Patrick JF, Lenarz T. Auditory midbrain implant—design and evaluation. Assoc. Res. Otolaryngol. Abstr. 27:160, 2004.
- Lenarz T, Lim HH, Reuter G, Patrick JF, Lenarz M. The auditory midbrain implant: A new auditory prosthesis for neural deafness—concept and device description. Otol. Neurotol. 27:840–845, 2006. [DOI] [PubMed]
- Lim HH, Anderson DJ. Feasibility experiments for the development of a midbrain auditory prosthesis. Proc 1st Internat IEEE EMBS Conf Neural Eng, Capri Island, Italy, pp. 193–196, 2003.
- Lim HH, Anderson DJ. Auditory cortical responses to electrical stimulation of the inferior colliculus: Implications for an auditory midbrain implant. J. Neurophysiol. 96:975–988, 2006. [DOI] [PubMed]
- Loftus WC, Bishop DC, Saint Marie RL, Oliver DL. Organization of binaural excitatory and inhibitory inputs to the inferior colliculus from the superior olive. J. Comp. Neurol. 472:330–344, 2004. [DOI] [PubMed]
- Lu T, Wang X. Information content of auditory cortical responses to time-varying acoustic stimuli. J. Neurophysiol. 91:301–313, 2004. [DOI] [PubMed]
- Lu T, Liang L, Wang X. Temporal and rate representations of time-varying signals in the auditory cortex of awake primates. Nat. Neurosci. 4:1131–1138, 2001. [DOI] [PubMed]
- Malmierca MS, Rees A, Le Beau FE, Bjaalie JG. Laminar organization of frequency-defined local axons within and between the inferior colliculi of the guinea pig. J. Comp. Neurol. 357:124–144, 1995. [DOI] [PubMed]
- McCreery DB, Agnew WF, Yuen TG, Bullara L. Charge density and charge per phase as cofactors in neural injury induced by electrical stimulation. IEEE Trans. Biomed. Eng. 37:996–1001, 1990. [DOI] [PubMed]
- McIntyre CC, Grill WM. Selective microstimulation of central nervous system neurons. Ann. Biomed. Eng. 28:219–233, 2000. [DOI] [PubMed]
- Merzenich MM, Reid MD. Representation of the cochlea within the inferior colliculus of the cat. Brain Res. 77:397–415, 1974. [DOI] [PubMed]
- Moore JK. The human auditory brain stem: A comparative view. Hear. Res. 29:1–32, 1987. [DOI] [PubMed]
- Morest DK, Oliver DL. The neuronal architecture of the inferior colliculus in the cat: Defining the functional anatomy of the auditory midbrain. J. Comp. Neurol. 222:209–236, 1984. [DOI] [PubMed]
- Najafi K, Wise KD, Mochizuki T. A high-yield IC-compatible multichannel recording array. IEEE Trans. Electron. Dev. 32:1206–1211, 1985.
- Ogata N, Yonekawa Y. Paramedian supracerebellar approach to the upper brain stem and peduncular lesions. Neurosurgery 40:101–104; discussion 104–105, 1997. [DOI] [PubMed]
- Oliver DL. Neuronal organization in the inferior colliculus. In: Winer JA and Schreiner CE (eds) The Inferior Colliculus. New York, Springer Science+Business Media, Inc., pp. 69–114, 2005.
- Oliver DL, Morest DK. The central nucleus of the inferior colliculus in the cat. J. Comp. Neurol. 222:237–264, 1984. [DOI] [PubMed]
- Oliver DL, Beckius GE, Bishop DC, Kuwada S. Simultaneous anterograde labeling of axonal layers from lateral superior olive and dorsal cochlear nucleus in the inferior colliculus of cat. J. Comp. Neurol. 382:215–229, 1997. [DOI] [PubMed]
- Otto SR, Brackmann DE, Hitselberger WE, Shannon RV, Kuchta J. Multichannel auditory brainstem implant: Update on performance in 61 patients. J. Neurosurg. 96:1063–1071, 2002. [DOI] [PubMed]
- Ramachandran R, May BJ. Functional segregation of ITD sensitivity in the inferior colliculus of decerebrate cats. J. Neurophysiol. 88:2251–2261, 2002. [DOI] [PubMed]
- Redies H, Sieben U, Creutzfeldt OD. Functional subdivisions in the auditory cortex of the guinea pig. J. Comp. Neurol. 282:473–488, 1989. [DOI] [PubMed]
- Rockel AJ, Jones EG. The neuronal organization of the inferior colliculus of the adult cat. I. The central nucleus. J. Comp. Neurol. 147:11–60, 1973. [DOI] [PubMed]
- Rose JE, Greenwood DD, Goldberg JM, Hind JE. Some discharge characteristics of single neurons in the inferior colliculus of the cat. I. Tonotopical organization, relation of spike-counts to tone intensity, and firing patterns of single elements. J. Neurophysiol. 26:294–320, 1963. [DOI] [PubMed]
- Roth GL, Aitkin LM, Andersen RA, Merzenich MM. Some features of the spatial organization of the central nucleus of the inferior colliculus of the cat. J. Comp. Neurol. 182:661–680, 1978. [DOI] [PubMed]
- Samii M, Carvalho GA, Tatagiba M, Matthies C, Vorkapic P. Meningiomas of the tentorial notch: Surgical anatomy and management. J. Neurosurg. 84:375–381, 1996. [DOI] [PubMed]
- Schreiner CE, Langner G. Periodicity coding in the inferior colliculus of the cat. II. Topographical organization. J. Neurophysiol. 60:1823–1840, 1988. [DOI] [PubMed]
- Schreiner CE, Langner G. Laminar fine structure of frequency organization in auditory midbrain. Nature 388:383–386, 1997. [DOI] [PubMed]
- Schwartz MS, Otto SR, Brackmann DE, Hitselberger WE, Shannon RV. Use of a multichannel auditory brainstem implant for neurofibromatosis type 2. Stereotact. Funct. Neurosurg. 81:110–114, 2003. [DOI] [PubMed]
- Serviere J, Webster WR, Calford MB. Isofrequency labelling revealed by a combined [14C]-2-deoxyglucose, electrophysiological, and horseradish peroxidase study of the inferior colliculus of the cat. J. Comp. Neurol. 228:463–477, 1984. [DOI] [PubMed]
- Shannon RV. A model of safe levels for electrical stimulation. IEEE Trans. Biomed. Eng. 39:424–426, 1992. [DOI] [PubMed]
- Shannon RV, Fayad J, Moore J, Lo WW, Otto S, Nelson RA, O’Leary M. Auditory brainstem implant: II. Postsurgical issues and performance. Otolaryngol. Head Neck Surg. 108:634–642, 1993. [DOI] [PubMed]
- Shannon RV, Zeng FG, Kamath V, Wygonski J, Ekelid M. Speech recognition with primarily temporal cues. Science 270:303–304, 1995. [DOI] [PubMed]
- Shneiderman A, Henkel CK. Banding of lateral superior olivary nucleus afferents in the inferior colliculus: A possible substrate for sensory integration. J. Comp. Neurol. 266:519–534, 1987. [DOI] [PubMed]
- Smith ZM, Delgutte B, Oxenham AJ. Chimaeric sounds reveal dichotomies in auditory perception. Nature 416:87–90, 2002. [DOI] [PMC free article] [PubMed]
- Snyder RL, Bierer JA, Middlebrooks JC. Topographic spread of inferior colliculus activation in response to acoustic and intracochlear electric stimulation. J. Assoc. Res. Otolaryngol. 5:305–322, 2004. [DOI] [PMC free article] [PubMed]
- Stein BM. Supracerebellar–infratentorial approach to pineal tumors. Surg. Neurol. 11:331–337, 1979. [PubMed]
- Stiebler I. Tone-threshold mapping in the inferior colliculus of the house mouse. Neurosci. Lett. 65:336–340, 1986. [DOI] [PubMed]
- Stiebler I, Ehret G. Inferior colliculus of the house mouse. I. A quantitative study of tonotopic organization, frequency representation, and tone-threshold distribution. J. Comp. Neurol. 238:65–76, 1985. [DOI] [PubMed]
- Suta D, Kvasnak E, Popelar J, Syka J. Representation of species-specific vocalizations in the inferior colliculus of the guinea pig. J. Neurophysiol. 90:3794–3808, 2003. [DOI] [PubMed]
- Syka J, Popelar J, Kvasnak E, Astl J. Response properties of neurons in the central nucleus and external and dorsal cortices of the inferior colliculus in guinea pig. Exp. Brain Res. 133:254–266, 2000. [DOI] [PubMed]
- Ulm AJ, Tanriover N, Kawashima M, Campero A, Bova FJ, Rhoton A, Jr. Microsurgical approaches to the perimesencephalic cisterns and related segments of the posterior cerebral artery: comparison using a novel application of image guidance. Neurosurgery 54:1313–1327; discussion 1327–1318, 2004. [DOI] [PubMed]
- Wallace MN, Rutkowski RG, Palmer AR. Identification and localisation of auditory areas in guinea pig cortex. Exp. Brain Res. 132:445–456, 2000. [DOI] [PubMed]


