Abstract
We have performed molecular dynamics (MD) simulations of multiple copies of un-acetylated G5 and G7, and acetylated G5 dendrimers in dimyristoylphosphatidylcholine (DMPC) bilayers with explicit water using the coarse-grained (CG) model developed by Marrink et al. (J. Phys. Chem. B. 2007, 111, 7812) with inclusion of long-range electrostatics. When initially clustered together near the bilayer, neutral acetylated dendrimers aggregate, whereas cationic un-acetylated dendrimers do not aggregate, but separate from each other, similar to observations from atomic force microscopy by Mecke et al. (Chem. Phys. Lipids. 2004, 132, 3). The bilayers interacting with un-acetylated dendrimers of higher concentration are significantly deformed and show pore formation on the positively curved portions, while acetylated dendrimers are unable to form pores. Un-acetylated G7 dendrimers bring more water molecules into the pores than do un-acetylated G5 dendrimers. These results agree qualitatively with experimental results showing that significant cytoplasmic-protein leakage is produced by un-acetylated G7 dendrimers at concentrations as low as 10 nM, but only at a much higher concentration of 400 nM for un-acetylated G5 dendrimers (Bioconj. Chem. 2004, 15, 774). This good qualitative agreement indicates that the effect on pore formation of the concentration and size of large nanoparticles can be studied through coarse-grained MD simulations, provided that long-range electrostatic interactions are included.
INTRODUCTION
Due to their controlled mass, water solubility, and surface functionality, polyamidoamine (PAMAM) dendrimers have many potential biomedical applications, such as antitumor therapeutics and drug delivery.1–5 These applications require interaction of the dendrimers with cell membranes, which motivated the group of Banaszak Holl, Orr, Baker, and coworkers to carry out in vitro enzyme assays and atomic force microscopy (AFM) studies of the interactions of PAMAM dendrimers with supported dimyristoylphosphatidylcholine (DMPC) lipid bilayers. They found that un-acetylated G7 PAMAM dendrimers can initiate hole formation in the dendrimer-concentration range of 10–100 nM, but un-acetylated G5 dendrimers did not create holes but only expanded existing ones.6–9 Acetylated G5 dendrimers did not cause hole formation or expansion in this concentration range. These results indicate that dendrimer size and terminal-acetylation play an important role in the dendrimer-induced pore formation in lipid bilayers. Furthermore, AFM studies showed that higher concentrations of un-acetylated G7 dendrimers caused much larger holes in the supported lipid bilayer than did lower concentrations.10 Moreover, significant cytoplasmic-protein leakage was observed in KB and Rat2 cell lines with un-acetylated G7 concentrations of 10–500 nM, and the leakage was proportional to the dendrimer concentration.6,9 The same trend was shown for un-acetylated G5 dendrimers, but only at higher dendrimer concentration (400–500 nM). These results indicate that the concentration of the dendrimer also significantly affects pore formation.
Atomistic molecular dynamics (MD) simulations of PAMAM dendrimers have provided atomic-scale insights into their structure and dynamics. The Goddard group has performed MD simulations of PAMAM dendrimers in explicit water, revealing the structure of the dendrimer and the thermodynamic and dynamic properties of water near the dendrimer.11,12 We also simulated un-acetylated and acetylated G5 PAMAM dendrimers in explicit water and methanol, and found that their size, shape, and internal structure compare favorably with experimental observations.13 However, due to system size and timescale limitations, atomistic models have difficulty encompassing the combination of a G5 (or G7) dendrimer, a lipid bilayer, and explicit solvent. To overcome these limitations, several coarse-grained (CG) models have been proposed, but they have been overly simplified for example using identical beads to represent the interior of the dendrimer, which may not properly capture hydrogen bonding interactions between branches in the dendrimer interior.14–18 To distinguish nodes and branches in the dendrimer interior, in earlier work we applied the CG lipid model of Marrink et al.19 to PAMAM dendrimers, and simulated their interactions with lipid bilayers, including the effects of long-range electrostatic interactions using particle mesh Ewald summation. We showed that dendrimer size, extent of terminal-acetylation, temperature, and salt concentration significantly affect pore formation,17 in qualitative agreement with experimental observations of Hong et al.6 However, the simulated system consisted of only a single CG dendrimer, 512 CG lipids and ~5800 CG water beads in a box of size 13 × 13 × 14 nm3, which is too small to simulate multiple dendrimer molecules interacting with the bilayer, and hence the effect of the dendrimer concentration on pore formation has not been considered yet. Leontiadou et al. recently used atomistic simulations to show a concentration dependence of antimicrobial peptide-induced pore formation.20 The mechanism in this case apparently involves aggregation of the small peptides, which seems to differ somewhat from the mechanism for dendrimers, as we discuss below. We also note that our system containing multiple dendrimers is too large to simulate atomistically. Here, using the CG dendrimer force field parameterized in our previous work,17 we perform MD simulations of multiple copies of G5 and G7 PAMAM dendrimers interacting with DMPC lipid bilayers. This allows us to investigate the effect of the dendrimer concentration and size on the dendrimer behavior and pore formation in the lipid bilayer and to test the CG model by comparing its predictions to the experimentally measured behavior. Initial configurations include cases with four dendrimers either spaced widely or clustered together to investigate the interactions between dendrimers. For the systems forming pores, the numbers of the dendrimer and water beads inside each pore are computed.
METHODS
All simulations and analyses were performed with the GROMACS3.3.1 simulation package21 with the coarse-grained (CG) force field, “MARTINI”, developed by Marrink et al.,22 which was downloaded from http://md.chem.rug.nl/~marrink/coarsegrain.html. The MARTINI force field was used for DMPC, water, and ions. For the dendrimer, the force constants of the harmonic bonding potential and the angle potential were increased above the MARTINI values to produce radii of gyration of dendrimers close to experimental values, and realistic masses for each chemical moiety were assigned to the CG beads, as described in our previous work.17
The temperature was maintained at 310 K by applying a Berendsen thermostat in the NPT ensemble.23 A cutoff of 12 Å was used for van der Waals interactions, and electrostatic interactions were modeled using a combination of a short-range electrostatic interaction with a cutoff of 12 Å and particle mesh Ewald summation (PME).24 With use of the standard shift function of GROMACS21 in which both the energy and force vanish at the cutoff distance, the LJ potential was smoothly shifted to zero between 0.9 and 1.2 nm to reduce the cutoff noise. A time step of 25–40 fs was used, and the coordinates were saved every 20 ps for analysis. Note that because of the smoothing of the potentials in the CG model, diffusive motion is faster than in atomistic simulations and so the effective time sampled using CG is 3–6 times larger than in atomistic simulations,19 and hence the effective time step is approximately 100–160 fs. All other times reported in this paper are effective times.
Equilibration of a coarse-grained DMPC bilayer
The simulated bilayer consists of 8192 CG DMPC molecules and ~204000 CG water (816000 real water) molecules in a periodic box of size 50 × 50 × 13 nm3, leading to a lipid:real water ratio of 1:100. Note that in the MARTINI CG model, four real water molecules are represented by a single water bead. Bilayers were simulated with and without inclusion of PME. Runs were performed for 200 ns, the first 160 ns of which was used only for equilibration. The center of mass motion of each monolayer in the bilayer was subtracted every time step for correct calculation of the lipid lateral diffusion coefficient. Using the last 40 ns of each trajectory, areas per lipid and lateral diffusion coefficients were calculated to investigate the effect of inclusion of long-range electrostatics (via PME) on bilayer properties. The final configurations were used as the starting states for simulations of dendrimers interacting with bilayers.
Equilibration of a coarse-grained dendrimer
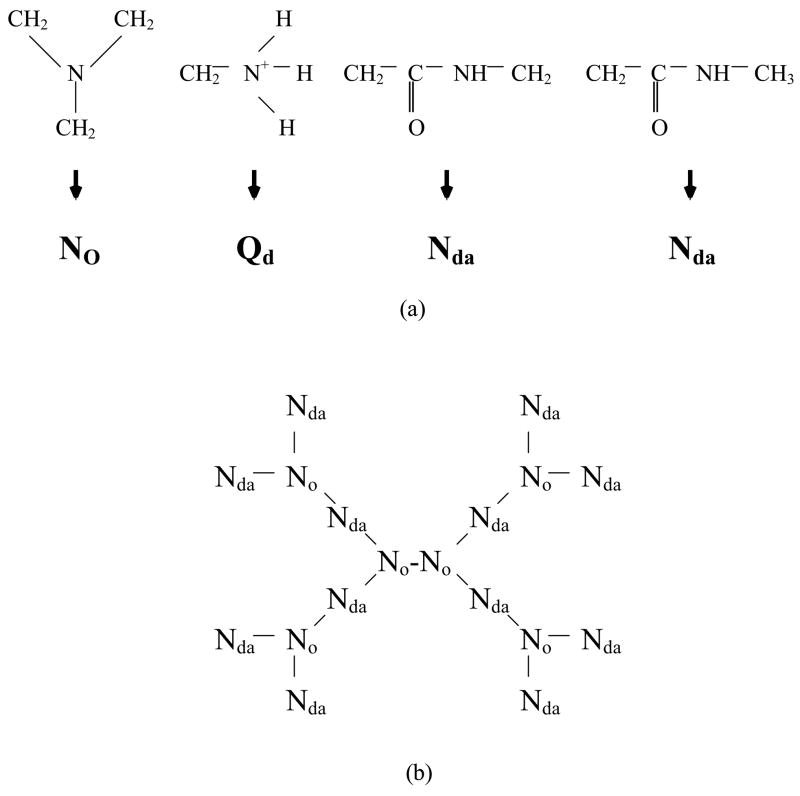
Acetylated (neutral) and un-acetylated (cationic) G5, and un-acetylated G7 PAMAM dendrimers were modeled using the MARTINI CG force field developed by Marrink et al.22 Our previous work describes the mapping of dendrimer chemical moieties onto four different CG bead types, the initial expanded configuration used for the dendrimer, and the parameterization of force constants of the harmonic bonding potential and angle potential of the dendrimer, which are chosen to match the equilibrated radius of gyration to that determined experimentally.17 Briefly, Figure 1 shows our CG model and a schematic picture of a coarse-grained G1 PAMAM dendrimer. CG G5 and G7 dendrimers are obtained by repeating these same bonding interactions. Using this mapping, and the CG dendrimer force field re-parameterized from the MARTINI CG force field, CG G5 and G7 dendrimers consist of 506 and 2042 CG beads, respectively, representing ~4500 and ~18000 atoms including hydrogens. The simulated system consists of a G5 or G7 dendrimer, ~20000 water molecules, and enough Cl− ions to neutralize the system. Radii of gyration measured by using electron densities from SAXS and SANS are compared to those calculated from the simulations using the equation for Rg with number of electrons per bead used instead of mass per bead. (Here , where ei is the number of electrons and ri is the position of bead i with respect to the center of mass of the molecule).
Figure 1.
(a) Mapping of dendrimer chemical moieties onto coarse grained dendrimer beads. The dendrimer is composed of four different types of chemical moiety, each represented by a single bead type. N0 stands for a neutrally-charged group; Qd represents a charged group with hydrogen-bond donors; Nda indicates a neutrally-charged group with a hydrogen-bond donor and an acceptor. (b) Schematic illustration of the topology of the G1 dendrimer. The interior portion consists of N0 and Nda moieties, respectively, for nodes and branches, and the surface consists of Nda and Qd groups, respectively, for acetylated and un-acetylated surface terminals. Higher generations can be described by extending this topology. The harmonic bonding and angle potentials are used to connect these beads.
Equilibration of dendrimers with a DMPC bilayer
Multiple copies (one, four, and 16 for G5; one, and four for G7) of equilibrated dendrimers were added to the bilayer systems obtained from previous equilibration runs. The center of mass of each dendrimer was positioned a distance of 6 nm and 8 nm above the center of bilayer for G5 and G7, respectively. For the systems with four dendrimers, one of the two different initial positions of dendrimers (widely spaced or clustered) was assigned (Table 1 and Figure 2). For G5 dendrimers, the final system included multiple G5 dendrimers (one, four, or 16), 8192 DMPC molecules, ~290000 water molecules, and enough Cl− ions to neutralize the system in a box of size 50 × 50 × 18 nm3. For G7 dendrimers, the system included multiple G7 dendrimers (one or four), 8192 DMPC molecules, ~370000 water molecules, and enough Cl− ions to neutralize the system in a box of size 50 × 50 × 22 nm3. Note that un-acetylated G5 contains 128 cationic charges while G7 contains four times as many, 512. After several steps of energy minimization, the dendrimers and bilayer were position-restrained with a force constant of 1000 kJ mol−1nm−2, and an equilibration run of 400 ps was performed. After the restrained equilibration, an unrestrained equilibration run was performed for 160 ns, and the last 40 ns of the trajectory was used for analysis.
Table 1.
List of simulations.
| Generation | No. of dendrimer surface groups
|
No. of molecules
|
Initial distribution of dendrimers | Effective simulation time (ns) | |||
|---|---|---|---|---|---|---|---|
| NH3+ | Acetylation (NHCOCH3) | dendrimer | DMPC | ||||
| G5-1 | 5 | 128 | - | 1 | 8192 | - | 160 |
| G5-4 | 5 | 128 | - | 4 | 8192 | Separated | 160 |
| G5-4c | 5 | 128 | - | 4 | 8192 | Clustered | 160 |
| AG5-4c | 5 | - | 128 | 4 | 8192 | Clustered | 160 |
| G5-16 | 5 | 128 | - | 16 | 8192 | Separated | 160 |
| AG5-16 | 5 | - | 128 | 16 | 8192 | Separated | 160 |
| G7-1 | 7 | 512 | - | 1 | 8192 | - | 160 |
| G7-4 | 7 | 512 | - | 4 | 8192 | Separated | 160 |
| G7-4c | 7 | 512 | - | 4 | 8192 | Clustered | 160 |
Figure 2.
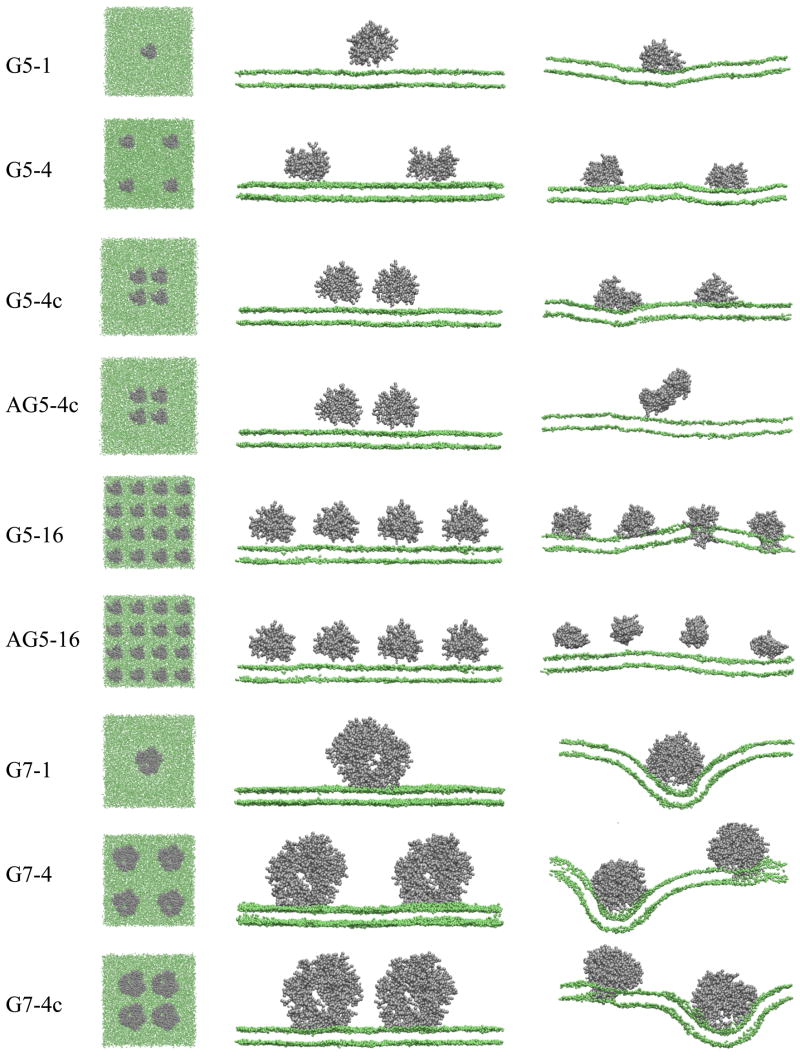
Snapshots of the top view (left image) and the side view (middle image) at the beginning (0 ns) and the side view at the end (160 ns, right image) of all simulations. Gray dots represent dendrimers, and green dots represent headgroups of the DMPC bilayer. The explicit water, DMPC tails, and ions are omitted for clarity. Note that side views show only one cross section of the system and cannot capture all dendrimers. The images were created with VMD.31
RESULTS AND DISCUSSION
Simulations of the coarse-grained G5 and G7 dendrimers
The radii of gyration for CG G5 and G7 dendrimers were calculated using electron numbers instead of mass, and compared with those measured using electron densities from SAXS and SANS.25–27 Figure 3 shows that Rg values drastically decrease as functions of time near the beginning of the simulations, and then reach apparent steady-state values at 120–200 ns. In Table 2, the differences in Rg between either CG or atomistic simulations12,13 and experiments25–27 are less than 10%.
Figure 3.
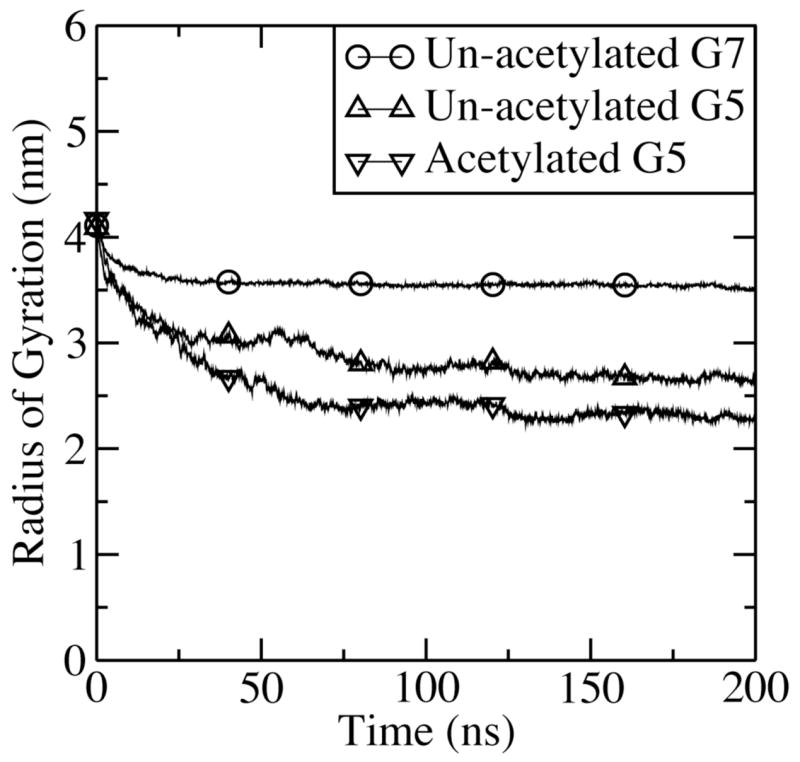
Radii of gyration (Rg) versus time after start of simulations for G5 and G7 PAMAM dendrimers.
Table 2.
Radii of Gyration (Rg) of G5 and G7 dendrimers, averaged over the last 40 ns of the simulations. Atomistic simulations with explicit water and experiments are compared. The errors are estimated using block averaging.
Area per lipid and diffusion coefficients of DMPC bilayer with long-range electrostatics
Our previous work showed that long-range electrostatics (PME) needs to be included to simulate dendrimer-induced pore formation in lipid bilayers,17 although the CG lipid models (MARTINI) have been parameterized for short-range electrostatic interactions by using a cutoff of 1.2 nm with a shift function from 0 to 1.2 nm.22 However, we showed that PME does not significantly affect the area per lipid and dynamics of dendrimer-free DPPC bilayers with x,y-dimensions of 12 nm. Since we simulated much larger DMPC bilayer (x,y-dimensions of 50 nm) in this study, we also examined the area per lipid and dynamics for this DMPC bilayer.
In Table 3, the areas per lipid and lateral diffusion coefficients for CG DMPC bilayers with and without PME are compared with experimental data. The area per lipid calculated from the simulation with PME is 0.608 nm2, and difference in the area per lipid between simulations with a cutoff and those with both PME and a cutoff is only 0.3%. Also, this area per lipid is almost same as the experimental value (0.596 nm2 at 303 K),28 showing that PME does not affect the area per lipid. Also, the lipid lateral diffusion coefficients calculated from the slope of the mean-squared displacement, with and without PME, are both 2.6–2.7 × 10⁻⁷ cm2/s, after dividing by a factor of four to account for the speed-up in diffusion in CG simulations mentioned earlier. After this correction, these values are about three times larger than experimentally measured (1 × 10⁻⁷ cm2/s),29,30 indicating as shown elsewhere that rates of diffusion predicted by the CG model are only qualitative.19 However, these results do indicate that using PME in the MARTINI CG model does not affect the lipid bilayer structure and dynamics.
Table 3.
Areas per lipid and lateral diffusion coefficients in CG DMPC bilayers with and without long-range electrostatics interactions, compared with experimental results.
The effect of dendrimer concentration on pore formation
We performed 160 ns-long CG-molecular dynamics simulations of un-acetylated G5 and G7, and acetylated G5 PAMAM dendrimers near a DMPC bilayer with different numbers of dendrimers. These dendrimer-bilayer systems are named “G5-1”, “G5-4”, “G5-4c”, “AG5-4c”, “G5-16”, “AG5-16”, “G7-1”, “G7-4”, and “G7-4c”, where the first and second number describe the dendrimer generation and number of dendrimers, respectively. The initial “A” designates acetylation, while the terminal “c” designates dendrimers that are initially clustered; see Table 1. Figure 2 shows snapshots from the beginning (left and middle image) and end of all the simulations (right image). One, four, and 16 copies of the G5 dendrimer, and one and four copies of the G7 dendrimer were simulated with a DMPC bilayer. The four dendrimers were either spaced widely or clustered together to investigate the effect of initial configuration. Initially clustered un-acetylated dendrimers (G5-4c and G7-4c) do not aggregate but quickly become more uniformly distributed, similar to the initially more widely distributed dendrimers in G5-4 and G7-4, whereas initially clustered acetylated dendrimers (AG5-4c) aggregate, although they do not interact with the bilayer. The un-acetylated dendrimers strongly repel each other presumably because of their positively charged terminal groups. The AFM experiments also showed a uniform distribution of adsorbed cationic dendrimers over the entire surface with only few aggregates.10 In the simulations, final configurations (right images in Fig. 2) show that a single un-acetylated G5 or G7 dendrimer does not insert into the bilayer, although it does induce significant bending of the bilayer, presumably to bring more lipid head groups into proximity with the dendrimer cations. For the system with four un-acetylated G7 dendrimers, significant bending of the bilayer is also observed, and one and two dendrimers insert into the bilayer, respectively for G7-4c and G7-4, whereas for un-acetylated G5 dendrimers, only in the system with 16 dendrimers did some (six) of the dendrimers insert. It is interesting to note that the dendrimers that significantly indent the bilayer reside in regions of negative bilayer curvature and do not themselves insert into the bilayer, but neighboring dendrimers on the positively curved regions bordering the indentation tend to form pores, implying that this positive curvature helps pore formation. Examples of this can be seen in Fig. 2. The region of positive curvature is likely to increase the tension on the upper bilayer leaflet, perhaps making insertion of the dendrimer easier.
This insertion in the system with 16 un-acetylated dendrimers, but not in the systems with only one or four un-acetylated dendrimers, might not seem to be consistent with our previous work17 for a small system that showed insertion of a single un-acetylated G5 dendrimer into a membrane containing only 512 lipids. However, our new simulations with 16 dendrimers and 8192 lipids have the same dendrimer:lipid ratio of 1:512 as in the small single-dendrimer system simulated in our previous work. Thus, in both the earlier work using a small system, and in the present work, insertion occurs at the same ratio of dendrimer to lipid. Note in Fig. 2 that the high dendrimer concentration required for insertion does not result from a need for dendrimer aggregation, but is apparently related to a long-range interaction among them. Thus, a single dendrimer, interacting with its periodic images in a periodic box, inserts into the membrane just as do multiple dendrimers spaced a similar distance apart on a larger lipid patch. The nature of the interaction between neighboring, but non-aggregated, dendrimers, that facilitates pore formation is not clear at this point. For the large systems, the indentation created by one dendrimer seems to make it easier for neighboring dendrimers to insert, perhaps by creating regions of positive bilayer curvature, as noted above. However, such an effect is not possible for a small system containing only a single dendrimer that interacts only with its periodic images. For these small systems, bilayer bending is not particularly evident; see Fig. 2 of ref. 17. Thus, it is possible that there are long-range electrostatic interactions between dendrimers that also promote dendrimer insertion.
In any event, these results indicate that concentration, but not aggregation, is important for insertion. For acetylated G5 dendrimers, not one of even 16 dendrimers insert, and bending of the bilayer does not occur, indicating that terminal-acetylation (i.e., neutralization) suppresses bilayer bending and dendrimer insertion. Simulations G5-1, G5-16, G7-1, and G7-4 were repeated for 160 ns but with only short-range, and not long-range PME electrostatic interactions. All failed to show any bending of the bilayer or insertion of dendrimer into the bilayer, indicating that inclusion of long-range electrostatic interactions is essential for prediction of dendrimer-induced hole formation. This result was seen in our earlier simulations, which showed that the long-range electrostatics generates a force pulling the dendrimer into contact with the opposite leaflet, leading to pore formation in the bilayer.17
To analyze the effect of dendrimer concentration on bilayer disruption, the order parameters of the DMPC tails were calculated within 2 nm of the center of mass of the dendrimer in the x,y-direction. Figure 4 shows that with four G7 dendrimers the bilayer tails are more disordered than they are with only one G7 dendrimer. G5 dendrimers show qualitatively the same concentration dependence, although the extent of disorder is smaller for G5 than for G7 dendrimers. These results indicate that the dendrimer significantly disrupts the lipid bilayer, which is consistent with the enhanced insertion we see at higher dendrimer concentration.
Figure 4.
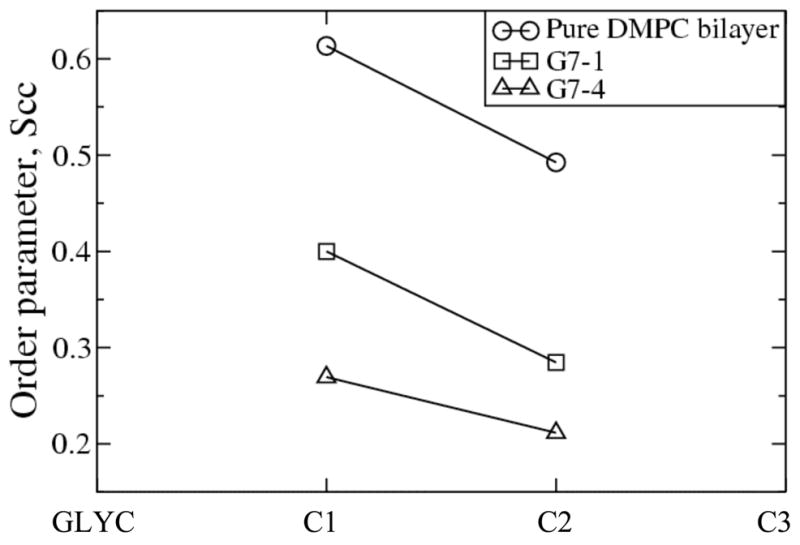
Order parameters of DMPC tails in the pure bilayers and in G7 dendrimer-bilayer systems, averaged over the last 40 ns. GLYC designates the bead for glycerol in DMPC, and C1 through C3 are beads for the tail.
Experimentally, the groups of Baker, Banaszak Holl, and Orr measured the leakage of lactate dehydrogenase (LDH) from KB and Rat2 cell lines on exposure to un-acetylated G5 and G7, and acetylated G5 dendrimers. These results showed that un-acetylated G7 dendrimers induce significant leakage of LDH in the dendrimer concentration range 10–500 nM, whereas un-acetylated G5 dendrimers cause leakage of LDH only at higher concentrations of 400–500 nM, and acetylated G5 dendrimers do not cause leakage for any concentration investigated.6 Using AFM, they also studied dendrimer-induced pore formation in aqueous supported DMPC lipid bilayers at low concentrations of 10–100 nM, and showed that un-acetylated G7 dendrimers can initiate hole formation in bilayers. However, un-acetylated G5 dendrimers cannot initiate holes and can only expand already existing holes, mostly from their edges, and acetylated G5 dendrimers cannot even expand hole formation. These results are consistent with their observations of dendrimer-induced LDH leakage in cell lines.6 These experimental results indicate that the concentration of dendrimer significantly affects pore formation in the lipid bilayer.
Figure 5 (a) shows top views of the DMPC bilayer at the end of simulations G5-16, G7-4, and G7-4c, respectively, in which dendrimers insert into the bilayer. Holes are clearly visible, showing that the insertion of charged dendrimers leads to pore formation in the DMPC bilayer. Note that the simulation and experimental environments and mass transport conditions are different, and hence the dendrimer concentrations in simulations cannot be directly compared with those in experiments. However, our simulations show that at high concentrations dendrimers can cause hole formation in the bilayer, which qualitatively agrees with experimental observations. Especially for the system with four dendrimers, un-acetylated G7 dendrimers cause pores, but un-acetylated G5 dendrimers do not. For G5, only the system with sixteen dendrimers showed pore formation, which is qualitatively similar to experimental observations of significant LDH leakage in the concentration of 10–500 nM for G7 dendrimers, but only at high concentrations of 400–500 nM for G5 dendrimers. Note that each hole contains only one dendrimer, indicating that the higher dendrimer concentration makes it easier for the one dendrimer to perforate the bilayer.
Figure 5.
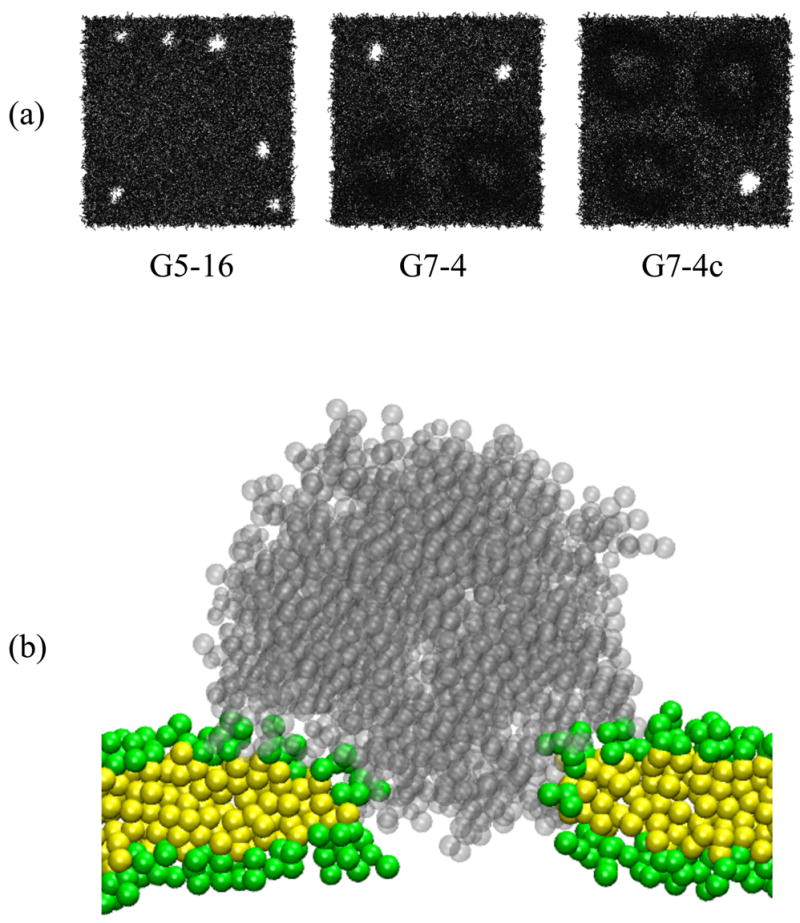
(a) Top view of the DMPC bilayer at the end (160 ns) of simulations G5-16, G7-4, and G7-4c. The dendrimer, water, and ions are omitted for clarity. (b) A snapshot of the dendrimer-induced pore in a DMPC bilayer at the end (160 ns) of the simulation G7-4c. Transparent gray dots represent a G7 dendrimer. Green and yellow dots represent head and tail groups of DMPC, respectively. Water and ions are omitted for clarity.
Dendrimer and water inside the pore
Figure 5 (b) shows a snapshot of the dendrimer-induced pore at the end of the simulation of the system G7-4c. Note that many DMPC head groups become positioned between the dendrimer and DMPC tail regions, producing a structure similar to a toroidal pore. This final configuration is presumably induced by strong interactions between the dendrimer and DMPC head group. Figure 6 (a) shows the radial distribution function (RDF) of DMPC head and tail groups of all lipids of both leaflets of the bilayer around terminals of the pore-inducing G7 dendrimer in G7-4c. The RDF of the phosphate groups of DMPC around the dendrimer terminals has a much higher peak at ~0.5 nm than do choline, glycerol, or tail groups, indicating that electrostatic interactions between positively charged dendrimer terminals and negatively charged phosphates play an important role in pore formation, consistent with our previous work with the G5 dendrimer.17 In Figure 6 (b), the RDF of counterions (Cl−) around the dendrimer terminals has a very high peak at ~0.5 nm, suggesting that anionic counterions strongly interact with the cationic dendrimer terminals.
Figure 6.
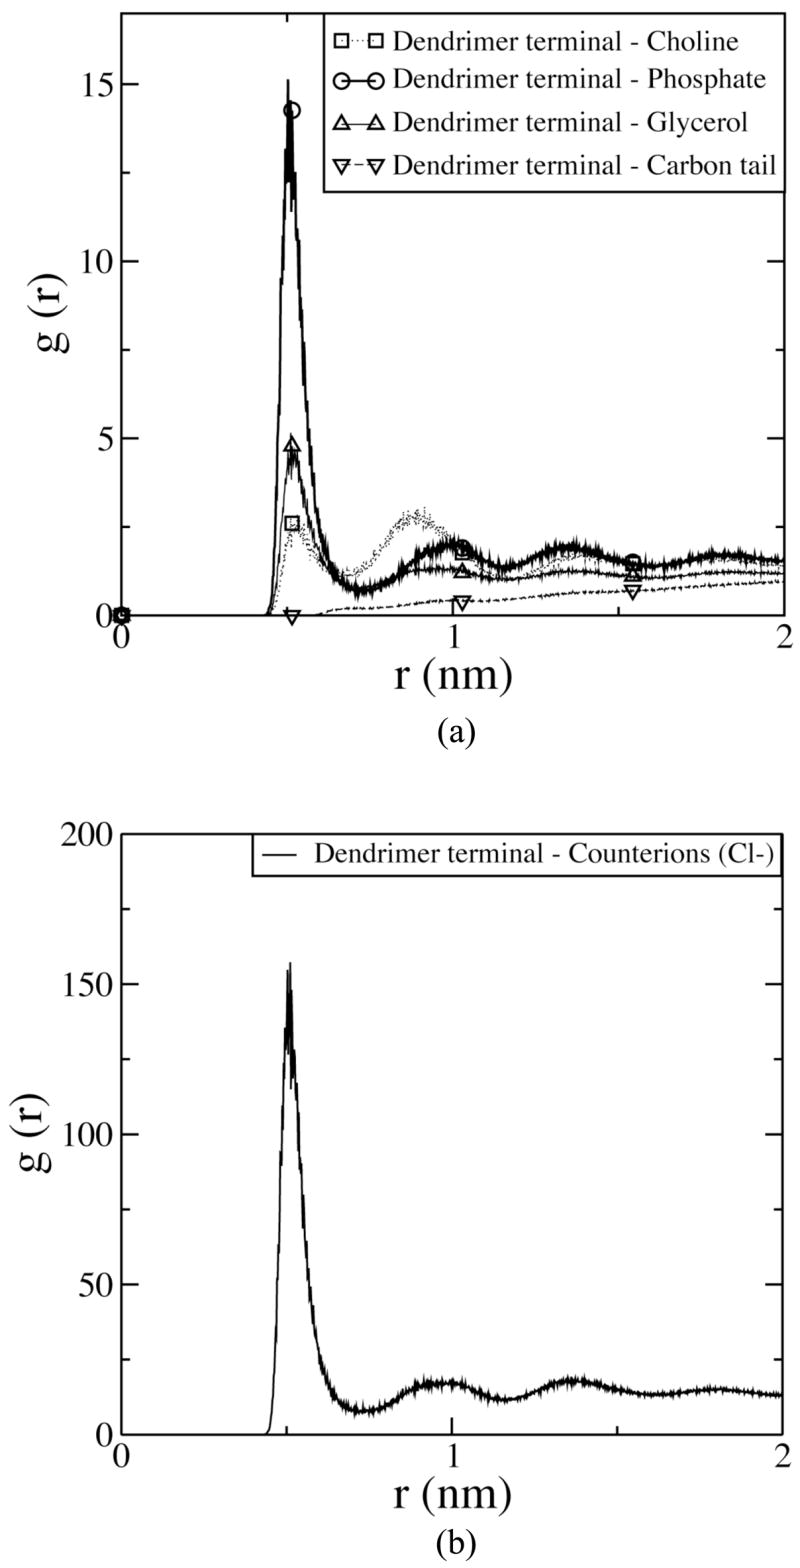
Radial distribution functions for (a) DMPC head and tail groups, and (b) counterions with respect to terminals of the pore-inducing dendrimer in G7-4c, averaged over the last 40 ns.
To compare the compositions of pores in the systems G5-16, G7-4, and G7-4c, the numbers of CG dendrimers, water, and ions in the pore were calculated. Since the dendrimer produces significant distortions of the bilayer (Figure 2), the x,y-plane parallel to the bilayer surface in the dendrimer-bilayer system was equally divided into 225 voxels by using a grid (15 × 15 grid), leading to an x,y area of approximately 3 × 3 nm2 for each voxel, where the voxel height was that of the box, i.e., 20 nm. For each voxel, the z-component (normal to the bilayer) of the center of mass of the glycerols was averaged over both leaflets of the bilayer, and the z coordinate of this was taken to be the bilayer center for that voxel. The dendrimer, water, and ion beads “inside the bilayer” are taken to be those that are within 5 Å in the z direction of the bilayer center for the voxel in which the bead is located.
Figure 7 (a) and (b) show the numbers of dendrimer, water, and ion beads in the pore as functions of time for G5-16 and G7-4c, respectively. The numbers of beads increase rapidly for 40 ns, and then decrease. The rapid formation of pores for these systems indicates that the lack of pore formation for systems with fewer dendrimers, such as G5-4 and G7-1, cannot be attributed entirely to a statistical effect arising from small numbers of dendrimers and inadequate run times. I.e., for a fixed probability of insertion per unit time, fewer dendrimers implies a lower probability, per unit time, that any one of them will insert. However, the rapid insertion of dendrimers in G5-16 and G7-4c would seem to rule out such an explanation for the lack of dendrimer insertion for G5-4 and G7-1.
Figure 7.
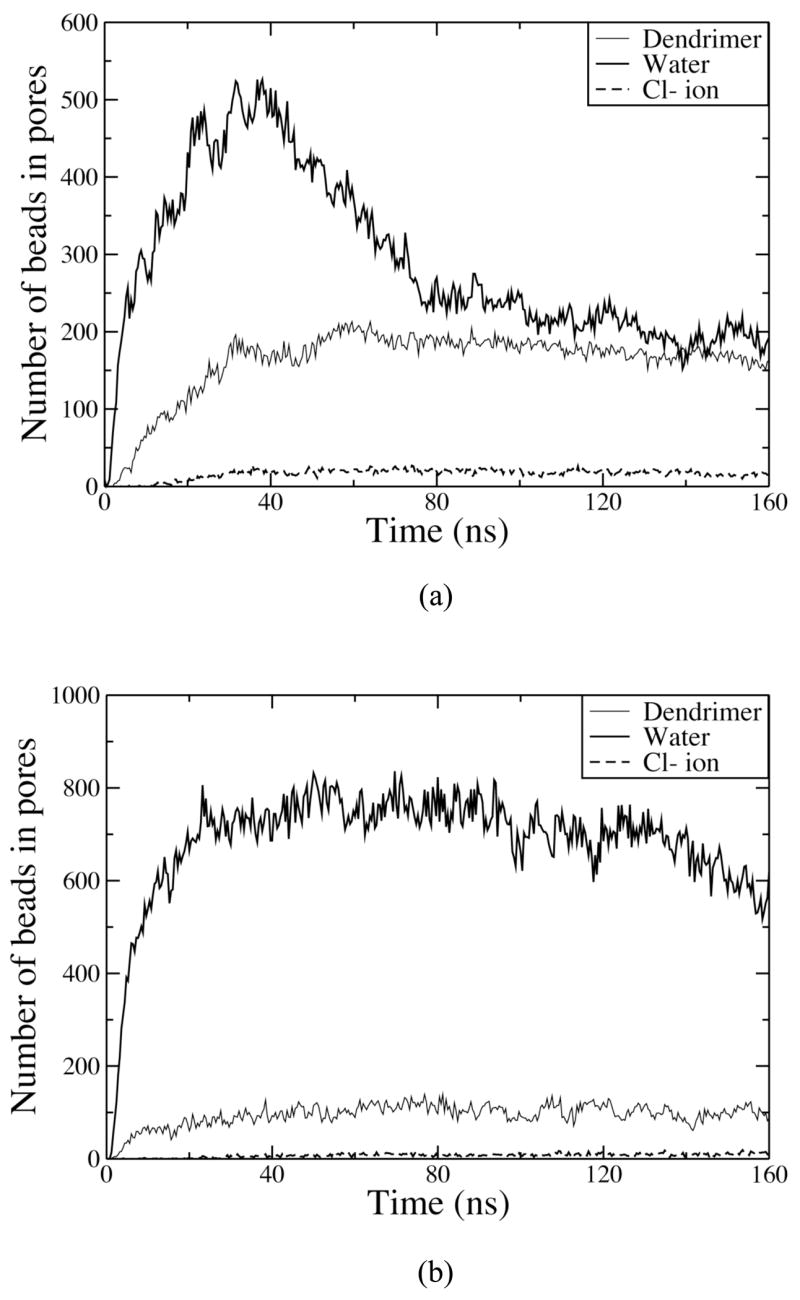
Numbers of dendrimer, water, and ion beads in pores for (a) G5-16 and (b) G7-4c.
Table 4 shows the average numbers of CG dendrimer, water, and ion beads in pores over the time period 120–160 ns for simulations that showed insertion of the dendrimer and pore formation. Although the G5 dendrimer is smaller than the G7 dendrimer, the system G5-16 shows more dendrimer beads inside the pore than do G7-4 and G7-4c because there are more pores in G5-16. However, the average numbers of dendrimer beads per pore are 28, 48, and 98, respectively, for G5-16, G7-4, and G7-4c. The average numbers of water beads per pore are 33, 171, and 655, respectively, for G5-16, G7-4, and G7-4c. Also, although there are more pores in G5-16, the total numbers of dendrimer, water, and ion beads inside pores for G5-16 are lower than for G7-4 and G7-4c. These results indicate that larger dendrimers induce larger pores. This trend was also observed in experiments of LDH leakage, which showed that charged G5 dendrimers at a concentration of 500 nM cause less leakage of LDH than do charged G7 dendrimers with a concentration of 100 nM.6 In the AFM experiments, holes with diameter 15–40 nm were observed within 5–60 minutes after injecting the dendrimer into the supported DMPC lipid bilayer.10 Such large holes were not observed in the simulations, presumably because of the limitation of simulation size and timescale. Also, due to the short simulation time of 160 ns, it cannot be ruled out that aggregation and pore formation might eventually occur in dendrimer-bilayer systems that do not show it for the short runs described here. However, we were able to observe small pores (diameters of 1–5 nm) affected by the dendrimer concentration, indicating that our CG dendrimer model captures the experimentally observed concentration and size dependence of pore formation.
Table 4.
Number of pores, and number of beads in pores for each simulation, averaged over the last 40 ns. In other systems (G5-1, G5-4, G5-4c, AG5-16, and G7-1), the numbers of dendrimer and water beads in pores are ~0 and 0–15, respectively.
| Number of pores | Number of beads in pores
|
|||
|---|---|---|---|---|
| Dendrimer | Water | Cl− ion | ||
| G5-16 | 6 | 168 ± 3 | 197 ± 10 | 17 ± 1 |
| G7-4 | 2 | 96 ± 4 | 343 ± 74 | 12 ± 1 |
| G7-4c | 1 | 98 ± 4 | 655 ±118 | 10 ± 1 |
CONCLUSIONS
Coarse-grained molecular dynamics simulations of multiple copies of G5 and G7 dendrimers in DMPC bilayers were performed with different numbers of dendrimers and initial configurations to investigate the effects of the dendrimer concentration and size on pore formation and to test the ability of CG models to predict experimental observations. The CG model used is an extension of the MARTINI model developed by Marrink and coworkers. Simulations of pure DMPC bilayers with and without long-range electrostatics (via particle mesh Ewald summation, or PME) show that PME does not affect the calculated area per lipid and lateral diffusion coefficients of the DMPC bilayer, although the CG model was parameterized based on the cutoff method. Radii of gyration of the equilibrated G5 and G7 dendrimers were found to be, respectively, 2.32–2.66 nm and 3.54 nm, close to the experimental values. G5 or G7 dendrimers that were initially clustered together near the bilayer did not aggregate, but separated from each other, presumably because of strong repulsive interactions between charged terminals. For un-acetylated G7 dendrimers, significant bending of the bilayer and pore formation on the positively curved bilayer portions were observed in systems with four dendrimers, but not only one dendrimer was present. For un-acetylated G5 dendrimers, pores are observed in the system with sixteen dendrimers, but not in the systems with one or four dendrimers. When acetylated, even the presence of 16 G5 dendrimers does not lead to pore formation. These results are qualitatively similar to those observed in the experiment of the LDH-leakage measurement from KB and Rat2 cell lines, which showed that un-acetylated G7 dendrimers induce LDH leakage in 10–500 nM, un-acetylated G5 dendrimers cause leakage only in higher concentration 400–500 nM, and acetylated G5 does not induce any leakage up to 500 nM.6 More dendrimer and water molecules exist inside pores in the four-G7 dendrimer system than in the sixteen-G5 dendrimer system, consistent with the greater LDH leakage for the G7 dendrimer.6 These results indicate that simulations with the CG dendrimer capture qualitatively the experimental observations of the size and concentration dependence of the dendrimer on pore formation in the bilayer. Computed pair distribution functions show that the strongest interactions are between the cationic surface groups of the dendrimer and the negatively charged phosphates of the lipids.
Acknowledgments
This study utilized the high-performance computational capabilities of the CIT Biowulf/LoBoS3 and NHLBI LOBOS clusters at the National Institutes of Health, Bethesda, MD.
References
- 1.Malik N, Evagorou EG, Duncan R. Anti-Cancer Drugs. 1999;10:767. [PubMed] [Google Scholar]
- 2.Naylor AM, Goddard WA, Kiefer GE, Tomalia DA. Journal of the American Chemical Society. 1989;111:2339. [Google Scholar]
- 3.Patri AK, Kukowska-Latallo JF, Baker JR. Advanced Drug Delivery Reviews. 2005;57:2203. doi: 10.1016/j.addr.2005.09.014. [DOI] [PubMed] [Google Scholar]
- 4.Patri AK, Majoros IJ, Baker JR. Current Opinion in Chemical Biology. 2002;6:466. doi: 10.1016/s1367-5931(02)00347-2. [DOI] [PubMed] [Google Scholar]
- 5.Tomalia DA, Naylor AM, Goddard WA. Angewandte Chemie-International Edition in English. 1990;29:138. [Google Scholar]
- 6.Hong SP, Bielinska AU, Mecke A, Keszler B, Beals JL, Shi XY, Balogh L, Orr BG, Baker JR, Holl MMB. Bioconjugate Chemistry. 2004;15:774. doi: 10.1021/bc049962b. [DOI] [PubMed] [Google Scholar]
- 7.Mecke A, Majoros IJ, Patri AK, Baker JR, Holl MMB, Orr BG. Langmuir. 2005;21:10348. doi: 10.1021/la050629l. [DOI] [PubMed] [Google Scholar]
- 8.Leroueil PR, Hong SY, Mecke A, Baker JR, Orr BG, Holl MMB. Accounts of Chemical Research. 2007;40:335. doi: 10.1021/ar600012y. [DOI] [PMC free article] [PubMed] [Google Scholar]
- 9.Hong SP, Leroueil PR, Janus EK, Peters JL, Kober MM, Islam MT, Orr BG, Baker JR, Holl MMB. Bioconjugate Chemistry. 2006;17:728. doi: 10.1021/bc060077y. [DOI] [PubMed] [Google Scholar]
- 10.Mecke A, Uppuluri S, Sassanella TM, Lee DK, Ramamoorthy A, Baker JR, Orr BG, Holl MMB. Chemistry and Physics of Lipids. 2004;132:3. doi: 10.1016/j.chemphyslip.2004.09.001. [DOI] [PubMed] [Google Scholar]
- 11.Lin ST, Maiti PK, Goddard WA. Journal of Physical Chemistry B. 2005;109:8663. doi: 10.1021/jp0471958. [DOI] [PubMed] [Google Scholar]
- 12.Maiti PK, Cagin T, Lin ST, Goddard WA. Macromolecules. 2005;38:979. [Google Scholar]
- 13.Lee H, Baker JR, Larson RG. Journal of Physical Chemistry B. 2006;110:4014. doi: 10.1021/jp056148s. [DOI] [PMC free article] [PubMed] [Google Scholar]
- 14.Freire JJ, Rodriguez E, Rubio AM. Journal of Chemical Physics. 2005;123 doi: 10.1063/1.2056546. [DOI] [PubMed] [Google Scholar]
- 15.Gotze IO, Likos CN. Macromolecules. 2003;36:8189. [Google Scholar]
- 16.Gurtovenko AA, Lyulin SV, Karttunen M, Vattulainen I. Journal of Chemical Physics. 2006;124 doi: 10.1063/1.2166396. [DOI] [PubMed] [Google Scholar]
- 17.Lee H, Larson RG. Journal of Physical Chemistry B. 2006;110:18204. doi: 10.1021/jp0630830. [DOI] [PubMed] [Google Scholar]
- 18.Timoshenko EG, Kuznetsov YA, Connolly R. Journal of Chemical Physics. 2002;117:9050. [Google Scholar]
- 19.Marrink SJ, de Vries AH, Mark AE. Journal of Physical Chemistry B. 2004;108:750. [Google Scholar]
- 20.Leontiadou H, Mark AE, Marrink SJ. Journal of the American Chemical Society. 2006;128:12156. doi: 10.1021/ja062927q. [DOI] [PubMed] [Google Scholar]
- 21.Lindahl E, Hess B, van der Spoel D. Journal of Molecular Modeling. 2001;7:306. [Google Scholar]
- 22.Marrink SJ, Risselada HJ, Yefimov S, Tieleman DP, de Vries AH. Journal of Physical Chemistry B. 2007;111:7812. doi: 10.1021/jp071097f. [DOI] [PubMed] [Google Scholar]
- 23.Berendsen HJC, Postma JPM, Vangunsteren WF, Dinola A, Haak JR. Journal of Chemical Physics. 1984;81:3684. [Google Scholar]
- 24.Essmann U, Perera L, Berkowitz ML, Darden T, Lee H, Pedersen LG. Journal of Chemical Physics. 1995;103:8577. [Google Scholar]
- 25.Prosa TJ, Bauer BJ, Amis EJ, Tomalia DA, Scherrenberg R. Journal of Polymer Science Part B-Polymer Physics. 1997;35:2913. [Google Scholar]
- 26.Topp A, Bauer BJ, Klimash JW, Spindler R, Tomalia DA, Amis EJ. Macromolecules. 1999;32:7226. [Google Scholar]
- 27.Topp A, Bauer BJ, Tomalia DA, Amis EJ. Macromolecules. 1999;32:7232. [Google Scholar]
- 28.Nagle JF, Tristram-Nagle S. Biochimica Et Biophysica Acta-Reviews on Biomembranes. 2000;1469:159. doi: 10.1016/s0304-4157(00)00016-2. [DOI] [PMC free article] [PubMed] [Google Scholar]
- 29.Almeida PFF, Vaz WLC, Thompson TE. Biochemistry. 1992;31:6739. doi: 10.1021/bi00144a013. [DOI] [PubMed] [Google Scholar]
- 30.Oradd G, Lindblom G. Biophysical Journal. 2004;87:980. doi: 10.1529/biophysj.103.038828. [DOI] [PMC free article] [PubMed] [Google Scholar]
- 31.Humphrey W, Dalke A, Schulten K. Journal of Molecular Graphics. 1996;14:33. doi: 10.1016/0263-7855(96)00018-5. [DOI] [PubMed] [Google Scholar]


