Abstract
This study introduces a charge coupled device (CCD) area detector based optical-computed tomography (optical-CT) scanner for comprehensive verification of radiation dose distributions recorded in nonscattering radiochromic dosimeters. Defining characteristics include: (i) a very fast scanning time of ~5 min to acquire a complete three-dimensional (3D) dataset, (ii) improved image formation through the use of custom telecentric optics, which ensures accurate projection images and minimizes artifacts from scattered and stray-light sources, and (iii) high resolution (potentially 50 μm) isotropic 3D dose readout. The performance of the CCD scanner for 3D dose readout was evaluated by comparison with independent 3D readout from the single laser beam OCTOPUS™-scanner for the same PRESAGE™ dosimeters. The OCTOPUS™ scanner was considered the “gold standard” technique in light of prior studies demonstrating its accuracy. Additional comparisons were made against calculated dose distributions from the ECLIPSE treatment-planning system. Dose readout for the following treatments were investigated: (i) a single rectangular beam irradiation to investigate small field and very steep dose gradient dosimetry away from edge effects, (ii) a 2-field open beam parallel-opposed irradiation to investigate dosimetry along steep dose gradients, and (iii) a 7-field intensity modulated radiation therapy (IMRT) irradiation to investigate dosimetry for complex treatment delivery involving modulation of fluence and for dosimetry along moderate dose gradients. Dose profiles, dose-difference plots, and gamma maps were employed to evaluate quantitative estimates of agreement between independently measured and calculated dose distributions. Results indicated that dose readout from the CCD scanner was in agreement with independent gold-standard readout from the OCTOPUS™-scanner as well as the calculated ECLIPSE dose distribution for all treatments, except in regions within a few millimeters of the edge of the dosimeter, where edge artifact is predominant. Agreement of line profiles was observed, even along steep dose gradients. Dose difference plots indicated that the CCD scanner dose readout differed from the OCTOPUS™ scanner readout and ECLIPSE calculations by ~10% along steep dose gradients and by ~5% along moderate dose gradients. Gamma maps (3% dose-difference and 3 mm distance-toagreement acceptance criteria) revealed agreement, except for regions within 5 mm of the edge of the dosimeter where the edge artifact occurs. In summary, the data demonstrate feasibility of using the fast, high-resolution CCD scanner for comprehensive 3D dosimetry in all applications, except where dose readout is required close to the edges of the dosimeter. Further work is ongoing to reduce this artifact.
Keywords: 3D dosimetry, optical-CT, PRESAGE™, radiation, quality assurance, telecentric
I. INTRODUCTION
Contemporary radiation therapy techniques [e.g., intensity modulated radiation therapy (IMRT), image-guided radiation therapy, and radiosurgery] continue to be progressively complex. To enhance treatment quality and accuracy, a clinically relevant requirement for an efficient, reliable, and comprehensive three dimensional (3D) dosimetry system exists and is acknowledged elsewhere.1,2
Various 3D dosimetry systems have been proposed. Broadly, 3D dosimetry systems consist of two essential components of a 3D dosimeter [e.g., polymer gels,3–7 Fricke gels,8,9 or PRESAGE™ (Ref. 10)] and a dose-readout modality [e.g., magnetic resonance imaging (MRI),4,11,12 ultrasound,13x-ray computed tomography [x-ray CT]14and optical-CT.1515–18 While several dose-readout modalities have been proposed for gel based dosimeters (polymer and Fricke gels), MRI and optical-CT (an optical equivalent of x-ray CT) remain predominant. Optical-CT was proposed as a cost effective alternative to MRI.4,16,17,19 Detailed characterization studies16,17 have revealed that optical-CT dose-readout in gel based 3D dosimeters can be hampered by scatter artifacts (caused by high scatter fraction of visible light), edge artifacts (caused by refractive index mismatch between the gel, container, and matching fluid) and other artifacts, including ring artifacts, digitization artifacts, and artifacts due to low transmission of visible light.
Adamovics et al.20–23 described the verification of dosimetric properties of a 3D solid polyurethane dosimeter called PRESAGE™, which is designed for use with optical-CT. PRESAGE™ has many favorable characteristics, including nonrequirement of an external container, predominantly absorptive and linear radiochromic response, and postirradiation spatial stability of the radiochromic response. PRESAGE™ is also amenable to machining to different sizes and is generally robust in a lab environment. These characteristics present PRESAGE™ as a clinically viable 3D dosimeter with increased convenience.
Recently, Guo et al.24demonstrated accurate 3D dosimetry using the PRESAGE™/optical-CT dosimetry system incorporating a commercial, laser-based, optical-CT dosereadout scanner (OCTOPUS™, MGS Research Inc.). A 16 cm diam PRESAGE™ dosimeter was irradiated with a coplanar isocentric treatment of five identical open rectangular fields. The treatment planning system calculations were known to be accurate in this simple open-beam plan. The 3D dose readout from the OCTOPUS™-scanner was accurate to within 4% dose-difference and 4 mm distance-to-agreement as compared to both GAFCHROMIC® EBT film measurement (2D) and ECLIPSE calculations (3D). The OCTOPUS™-scanner dose readout agreed more closely with the independent EBT film measurement than with planning system calculations in the regions of steep dose falloff.
The OCTOPUS™-scanner utilizes a rastering single laser beam to acquire slice-by-slice projections (maps of laser attenuation ) through the dosimeter. Single laser beam readout has many advantages for accurate optical-CT, most importantly, lack of sensitivity to scattered light. Although the PRESAGE™/OCTOPUS™ dosimetry system is highly accurate, it is rather slow for comprehensive 3D dosimetry. Currently, the length of time required to scan a single slice of data is ~7 min, which translates to a scanning time of more than 5 h to acquire 150 projections over 180° at an interslice spacing of 2.5 mm for a modestly sized (10 cm diam) 3D dosimeter.
Attempts to reduce scanning time have led to investigations into optical-CT scanners that incorporate uniform broad-beam sources, customized image forming optics, and charge coupled device (CCD) chipsets.25–28 These scanners acquire 2D projections at each acquisition step (without the need for raster scanning), thereby affording significant speed advantage. This article introduces a novel in-house optical-CT scanner, which incorporates CCD imaging and customized image-forming (telecentric) lens technology. The scanner can achieve an increase in speed with a modest loss of signal-to-noise ratio and has the potential to achieve an imaging resolution of close to 50 μm.29
In this study, the performance and feasibility of the CCD-scanner for 3D dosimetry in radiochromic dosimeters is evaluated by comparative scanning against the “gold standard” OCTOPUS™-scanner.24,30 The OCTOPUS™-scanner is considered the gold standard because of its demonstrated ability of accurate dose readout, even along regions of steep dose gradients where the planning system calculations are susceptible to inaccuracies. The readout from the OCTOPUS™-scanner also provides an independent 3D optical-CT measurement to compare the CCD-scanner. Scanswere compared for three different PRESAGE™ dosimeters irradiated with different external beam treatment plans of progressive delivery and dosimetric complexity.
II. MATERIALS AND METHODS
II.A. PRESAGE™ 3D dosimeters
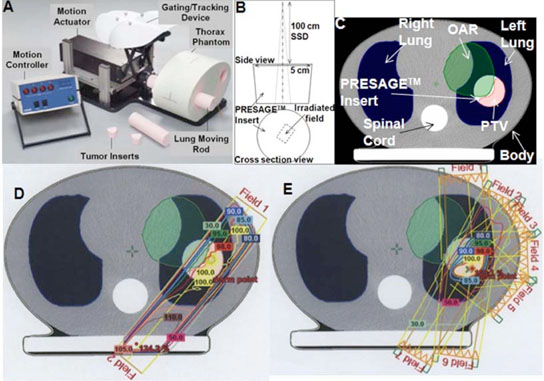
The PRESAGE™ dosimeters used in this study were designed to fit as tumor inserts inside the “CIRS” dynamic thorax phantom [Fig. 1(A)]and are henceforth referred to as PRESAGE™ inserts. Key features of the CIRS dynamic phantom are listed at http://www.cirsinc.com/index.html. The combination of the CIRS phantom and PRESAGE™ inserts represents a model for 3D dose verification in complex external beam radiation therapy techniques [e.g., 3D conformal, IMRT and respiratory gated IMRT] for lung lesions. While the CIRS phantom is designed to simulate complex motion of the tumor insert (e.g., simulated breathing), for the purpose of this study, irradiations were implemented in “static” mode such that there was no motion of the PRESAGE™ inserts when the treatment was being delivered.
FIG. 1.
Treatments of progressive delivery complexity. (A) Picture of the CIRS dynamic thorax phantom. (B) Experimental setup for the single rectangular beam (1.6 cm×1.2 cm) irradiation. (C) A single slice from the x-ray CT scan of the CIRS phantom in A showing predominant anatomy. (D) Treatment fields and isodose lines in the two field parallel-opposed plan with left anterior and right posterior fields. (D) Treatment fields and isodose lines in the 7-field IMRT plan.
PRESAGE™ inserts (Heuris Pharma LLC, Skillman, NJ 08558) were prepared according to the methods outlined in Adamovics et al.21,22 The 5 cm diam cylindrical inserts were made with an effective Z number of 8.3, a physical density of 1.07 g/cm3, a CT number of ~20010 and uniform (<1% standard deviation) attenuation. The effective Z of PRESAGE™ is similar to that required for tissue equivalent dosimetry but the density (physical and electron) is greater. This means that the energy response will be similar to the energy response of tissues, although the shape of the dose distribution might differ. Irradiation of these inserts leads to an optically detectable radiochromic response from yellow to green with maximum absorption occurring at the wavelength of 633 nm.10,24 Postirradiation stability of this batch of PRESAGE™ formulation was evaluated in a preliminary experiment where PRESAGE™ set in a scintillation vial was irradiated to 6 Gy and the irradiation induced radiochromic response (change in OD) was tracked as a function of time using a spectrophotometer. The irradiation induced OD change was observed to change by >5% within the first six hours postirradiation. After this, the response stabilized to ~2% for two days. All postirradiation scans were hence performed after overnight (12 h) storage in the refrigerator. During the course of an experiment, the inserts were always handled and stored in low light levels (preferably dark rooms with air conditioning) to prevent exposure to fluorescent room light, which may cause OD change.10
Prior to irradiation, marks were identified on the inserts such that they are visible in the reconstructions. After prescans, the inserts were irradiated with the treatment plans described next followed by postscans.
II.B. Treatment plans for the PRESAGE™ inserts
The three PRESAGE™ inserts were irradiated with the following plans of progressive complexity: (i) a single, 102 H. S. Sakhalkar and M. Oldham: Area detector based optical-CT scanner for 3D dosimetry 102small-field rectangular beam irradiation [experimental setup shown in Fig. 1(B)], (ii) a two-field open beam parallel-opposed (henceforth termed “parallel-opposed” treatment) plan [Fig. 1(D)] and (iii) a 7-field IMRT plan [Fig. 1(E)]. The rationale and details of the treatments is provided in the following subsections. The CIRS phantom was used in the parallel-opposed and IMRT treatment, whereas the single rectangular beam treatment was delivered without the use of the CIRS phantom.
II.B.1. Single rectangular beam treatment
The PRESAGE™ insert was irradiated with a single rectangular beam (1.6 cm × 1.2 cm, 6 MV external photon beam, SSD 100 cm) on a Varian 21EX linear accelerator (LINAC, Varian Corporation, Palo Alto, CA) as shown in Fig. 1(B). The irradiation field was along the long axis of the PRESAGE™ insert and slightly off center without extending to the edge. The single rectangular beam treatment was used because it represents a simple verification experiment where the potential for edge artifacts during optical-CT scanning is minimized. Also, this treatment presents a dosimetric scenario of very steep dose gradients in two dimensions for small fields, which requires high resolution optical-CT scanning.
II.B.2. Parallel-opposed and IMRT treatments
The rationale for the parallel-opposed and IMRT treatments was to add progressive delivery complexity (including fluence modulation) of the radiation therapy technique used, to test for dose readout of steep to moderate dose gradients, and to extend the radiation fields to the edge of the PRESAGE™ insert.
The CIRS phantom, containing an unirradiated PRESAGE™ insert, was taken through the entire treatment planning procedure. Isocentric alignment marks were created on the surface of the CIRS phantom using the lasers in the CT-sim room and x-ray CT scan was performed. Treatment plans were created in the ECLIPSE® treatment planning system.
Figure 1(C) shows a CT slice through the CIRS phantom with relevant anatomical information, including the PRESAGE™ tumor insert. The anatomical features of body contour, right and left lungs, and spinal cord are clearly apparent. The tumor (PRESAGE™) insert within the left lung is representative of a tumor lesion that needs to be treated with radiation therapy. The shaded green contour was manually added and represents a hypothetical organ at risk (OAR) and extends into the tumor lesion from the body and left lung. The planning treatment volume (PTV) was contoured to include most of the tumor mass that does not overlap with the OAR. Treatment planning for the parallel-opposed and IMRT plans was optimized to maximize dose coverage to PTV while minimizing dose coverage to OAR and healthy tissue (e.g., lungs and spinal cord) within prescription constraints. A dose of 8 Gy was prescribed at the treatment isocenter positioned central to the PTV based on results from preliminary experiments aimed at investigating the sensitivity (OD change/Gy) of this PRESAGE™ formulation.
Figures 1(D) and 1(E) show the same CT slice with isodose lines for the parallel-opposed and IMRT plans, respectively. Treatment fields for the parallel-opposed (left anterior and right posterior) plan were 6 MV rectangular (4.9 × 4.5 cm2) open photon beams (gantry angles of 36.2° and 219.9°, respectively). This plan simulates a conventional plan for lung lesion treatments and exhibits steep dose gradient at beam edges. Treatment fields for the IMRT plan were 6 MV photon beams (gantry angles of 356°, 26°, 51°, 88°, 131°, 188°, and 211°, respectively), with varying fluence controlled by the dynamic motion of the leaves of the multileaf collimator. This treatment plan exhibits moderate dose gradient as compared to the parallel-opposed plan.
After x-ray CT scan and treatment planning, the CIRS phantom containing the unirradiated PRESAGE™ insert was positioned on the treatment couch of the LINAC to match the setup in the treatment plan for delivery. The phantom was then irradiated with the parallel-opposed plan. The irradiated PRESAGE™ insert was then removed and replaced with another insert. The CIRS phantom was re-setup on the treatment couch and the IMRT plan was delivered. The delivered dose distribution was calculated by the commissioned pencil beam algorithm in ECLIPSE, with a spatial resolution of 1.25 mm.
II.C. Optical-CT scanning of PRESAGE™ inserts
Inserts were first scanned using the OCTOPUS™-scanner followed by the CCD-scanner.
II.C.1. OCTOPUS™-scanner
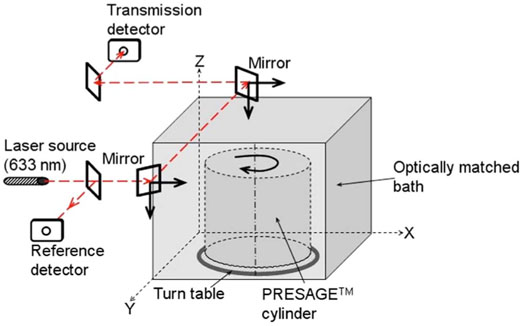
A simplified light-ray schematic of the OCTOPUS™-scanner is shown in Fig. 2. The scanner is an optical equivalent of first generation x-ray CT scanners,19 which employ parallel x-ray beams for diagnostic imaging. The OCTOPUS™-scanner has been described in detail elsewhere24 and only the operating parameters relevant to this study are presented here. The refractive index matching fluid was a mixture of octyl salicylate and methoxy octyl cinnamate, which has an index of 1.504. A small amount (3–4 drops) of a green oil-based dye is added to the matching fluid to equalize the light attenuation through the fluid and the unirradiated PRESAGE™ insert and, hence, optimize the dynamic range of measurement. The dose readout data consisted of 15 slice scans, where each slice was reconstructed from 100 projections, acquired at angular increments of 1.8°. In-plane pixel size for the linear projection scan was 0.5 mm and each pixel value was an average of 100 ADC reads. Each projection scan was comprised of 397 pixels. Interslice separation was 3 mm. Data acquisition had a precision of 16 bit. The 3D distribution of linear attenuation coefficients was reconstructed using an in-house MATLAB code (Mathworks, Natic, MA), which uses filtered backprojection (FBP) algorithm.
FIG. 2.
Schematic of the OCTOPUS™-scanner. A single laser beam scans the dosimeter in rastering fashion. A one-dimensional projection (attenuation of the laser light in the horizontal direction) is acquired at each step. The dosimeter is then incrementally rotated and another one-dimensional projection is acquired. The data from multiple such one-dimensional projections over a 360° scan are used to reconstruct attenuation coefficients of the dosimeter for one slice. Data for multiple such slices are obtained for 3D dose-readout.
II.C.2. CCD-scanner
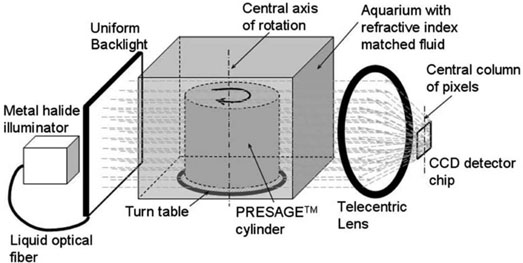
A simplified schematic of light ray paths through the CCD-scanner is shown in Fig. 3. The design and configuration of the CCD-scanner is similar to the optical-CT scanner described for 3D imaging of biological samples29 and is adapted for 3D dosimetry.
FIG. 3.
Schematic of the CCD-scanner. Simplified light paths through the in-house, bench-top, CCD based optical-CT scanner are shown. Projection images through the PRESAGE™ dosimeter are focused on the CCD camera chip using a tertiary telecentric lens system (acceptance angle <0.1°). The telecentric lens system ensured image formation from parallel light-ray geometry. A 2D projection image is acquired at each rotation step rendering significant speed advantage.
The PRESAGE™ insert is mounted on a turn plate in an aquarium (8×6×5 cm), constructed from antireflection coated glass. The aquarium was filled with the same fluid that was used in the OCTOPUS™-scanner. Incident illumination is provided by a PHLOX-LEDR-BL-100 × 100-S-Q-1R-CUR red (633 nm) LED backlight (Leutron Vision Inc., Burlington, MA) for the single rectangular beam irradiation experiment and a FiberLite MH100 metal halide illuminator (Dolan Jenner Industries Inc., Lawrence, MA) for the 3D conformal and IMRT irradiation experiments. A backlight diffuser (Dolan Jenner Industries Inc., Lawrence, MA) was connected to the metal halide light source using a liquid optical fiber to provide uniform diffuse background illumination. The source light was red filtered (bandpass filtration) to match the peak sensitivity of the radiochromic response of PRESAGE™ at 633 nm.10,24
Individual 2D projection images were acquired using a 12 bit, monochrome CCD (2/3 in.) camera from Basler Vision Technologies (1392 × 1040 pixel resolution), mounted on an optical rail and coupled with specialized lens optics. Image formation on the CCD detector was facilitated by the use of high depth of field image forming optics, such that features at all depths in the dosimeter remain sharp and in focus. Custom telecentric lens optics (TECHSPEC™ Gold Series Telecentric Lenses, Edmund Optics) was used to ensure image formation dominated by light paths that traverse parallel to the optical axis (acceptance angle <0.1°) through the dosimeter. The telecentric specifications for the lens system are (i) a working distance of 132–182 mm, (ii) a horizontal field of view 70.4 mm, (iii) a primary magnification of 0.125×, and (iv) a depth of field of 38.4 mm.
To obtain 3D data, 2D projection images for different orientations (view angles) of the dosimeter were acquired by stepwise rotation of the dosimeter. The central axis of rotation of the PRESAGE™ dosimeter was aligned to be coincident with the central column of pixels in the camera image frame to ensure consistent projection data for reconstruction. The exposure time of the CCD detector was held constant between all projections and was set as high as possible without incurring overexposure of the detector. Coordination of step-motion and image acquisition was achieved using an integrated National Instruments PXI chassis, containing a 1042 controller card (National Instruments) and an MID7604 motor driver (National Instruments). An in-house LABVIEW code instigated an incremental rotation whenever an image was written to disk by the camera. The NI image acquisition software represented the pixel values from the 12 bit camera as 16 bit integers.
Multiple 2D projections were acquired over 360° at small angular increments (e.g., 1°) and subsequently reconstructed to yield a 3D map of linear attenuation coefficients. After acquisition of a complete projection dataset, flood-field (image without the PRESAGE™ insert) images were also acquired and used for correcting the projection images for background inhomogeneities. Care was taken to maintain the same image acquisition parameters that were used to acquire the projection images with the PRESAGE™ insert in the field of view. Commercially available, tomographic reconstruction software (COBRA, Exxim Corp), which uses FBP (Shepp-Logan) algorithm, was used for reconstruction. For all acquisitions, raw projection images were of dimensions 1392 × 1040 pixels and were processed as necessary before feeding into the reconstruction algorithm.
II.D. Comparative analysis
The irradiation-induced OD change and hence dose (linear relation between OD change and dose10) was determined by subtracting average prescans from the postscans. For the parallel-opposed and IMRT irradiations, dose readout from the CCD-scanner was compared with independent readout from the OCTOPUS™-scanner, as well as computed dose from ECLIPSE. For the single rectangular beam irradiation, the dose readout from the CCD-scanner was compared with OCTOPUS™-scanner readout only. Since the single rectangular beam plan was delivered without prior x-ray CT scan and subsequent treatment planning on ECLIPSE, calculated dose distribution was not available for this plan.
Independent datasets from the OCTOPUS™-scanner, the CCD-scanner, and ECLIPSE were loaded into DOSEQA software (www.3cognition.com) for 3D dose registration and analysis. Comparison between the coregistered datasets was carried out using dose profiles, dose-difference plots and gamma maps31,32 (3% dose difference and 3 mm distance to agreement). For all evaluations, equivalent datasets were normalized to convert to relative dose distribution. For the single rectangular beam treatment, the normalization point was within the central rectangular beam. For the parallelopposed and IMRT treatments, the normalization point was central to the PTV.
III. RESULTS AND DISCUSSION
III.A. Imaging performance of the CCD-scanner
III.A.1. Projection images
III.A.1.a. Telecentric collimation
Projection images in area detector based scanners might be susceptible to detection of contaminant scattered light, which has the potential to introduce scatter artifacts.29 The contribution of scattered light in projection images is greatly reduced here because of the use of customized telecentric optics that is used to focus the images onto the CCD. Telecentric lenses have two advantages for accurate 3D optical imaging: they ensure negligible distortion across field of view and the image magnification does not vary with object depth.29
Preliminary experiments showed that projection images acquired using the telecentric lens exhibited <0.5% distortion and change in magnification over a depth of 0 mm–30 mm from focus as compared to images from a pseudotelecentric lens (TEC-M55 computer, Edmund Optics ), which exhibited as much as 5% distortion and magnification change at a depth of 30 mm. Telecentric optical collimation is analogous to the physical collimation and elimination of scatter of gamma rays in SPECT (single photon emission computed tomography) and improves the approximation to the ideal parallel-ray transmission paths assumed in the filtered backprojection reconstruction algorithms, and hence yields improvements in image quality.29Although the use of telecentric optics for parallel beam, CCD-based dose readout in polymer gels has been described before,33 their implementation of telecentricity is different than the implementation described here.
III.A.1.b. Scan time
A complete set of 360 projection images from the CCD-scanner was acquired in 5–6 minutes. The time for acquiring similar datasets for larger dosimeters (e.g., 10 cm diameter) is still expected to be 5–6 min, although larger telecentric lenses will be required. This represents an improvement in speed of >100× as compared to the OCTOPUS™-scanner in its present form. The increase in speed arises because an entire 2D projection-image is acquired in a single acquisition of the CCD camera. However, upgrades to laser CT scanners to improve speed and resolution are in progress.34,35
III.A.1.c. Spatial resolution
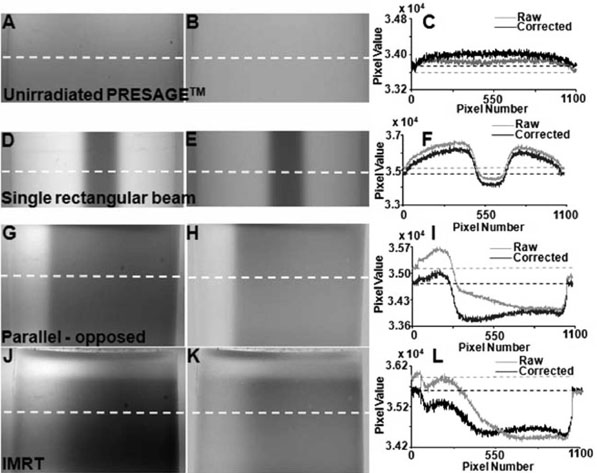
Representative raw projection images from the CCD-scanner for an unirradiated PRESAGE™ insert and inserts irradiated with the single rectangular beam treatment, parallel-opposed treatment and IMRT treatment are shown in Figs. 4(A), 4(D), 4(G), and 4(J), respectively. These particular projection views were chosen because they show the gradient of attenuation from the region of the dosimeter that received the highest dose to the region with lowest dose. Each projection image represents a 2D parallel projection map of linear attenuation through the PRESAGE™ insert. The pixel resolution is close to 50 μm, which theoretically allows reconstruction of attenuation coefficients at an equally high spatial resolution. For this to occur, Nyquist angular sampling criteria must be satisfied such that the number of angular projections required should not be lesser than π times the projection image matrix size. This implies that more than 3000 (1040× π) projections would be required for adequate angular sampling. Handling of so many projections is unfeasible at this time because of limitations of processing software and computer memory. For clinical dosimetry (e.g., IMRT QA), an in-plane resolution of 1 mm2 is adequate. Moreover, the 1D projection scan from the OCTOPUS™-scanner had an in-plane spatial resolution of 0.5 mm. The raw projection images were therefore adequately processed before reconstruction to match the resolution from the OCTOPUS™-scanner.
FIG. 4.
Projection images and corrections. Raw projection images (A, D, G, and J), flood field corrected projection images (B, E, H, and K), and line profiles (C, F, I, and L) along dotted lines in raw and flood field corrected images from the CCD scanner for the unirradiated PRESAGE™ insert (top panel), single rectangular beam treatment (second panel), parallel-opposed treatment (third panel) and IMRT treatment (bottom panel). Background inhomogeneities and light attenuating static impurity specs were eliminated by flood field correction of raw images.
III.A.1.d. Flood-field corrections
Flood-field correction of raw images is essential to minimize inconsistencies because of light attenuating static impurity specs and spatial nonuniformities in background illumination, which might result in reconstruction artifacts. Images in Figs. 4(B), 4(E), 4(H), and 4(K)illustrate the effect of flood-field correction for the raw images of Figs. 4(A), 4(D), 4(G), and 4(J), respectively. Occasional impurity specs are visible in raw images, the origin of which can be smudges on the surface of the aquarium, dust on the lens and CCD chip as well as dead pixels of the CCD chip. Flood-field correction resulted in elimination of some specs but not others. Figures 4(C), 4(F), 4(I), and 4(L) show line profiles across the raw and flood- field corrected images along the dotted lines. In the profile across the raw images (gray), it was noted that the pixel values in the RI matched fluid just outside the two edges of the insert are different, although the fluid has similar attenuation. This discrepancy was due to spatial nonuniformity of the background illumination and was eliminated by flood- field correction as seen in the profile across flood-field corrected images (black), where similar pixel values are noticed for the RI matched fluid just outside either of the two edges of the insert.
III.A.1.e. Noise
Analysis of profiles across flood-field images indicated that the pixel values exhibited a variation of <3% about the mean, whereas the OCTOPUS™-scanner exhibited a variation of <1%. Noise-to-signal ratio, defined as the ratio of the standard deviation of pixel values to the mean pixel value of the signal, was ~5% for the CCD-scanner and ~1.8% for the OCTOPUS™-scanner. Sources of noise in the CCD-scanner may include inherent noise associated with the response of the CCD electronics, suspended impurity specs in the RI matching fluid and insert, nonuniform transmittance of the wall of the water-bath, and other imperfections in the lens-camera optical chain. Better noise characteristics of the OCTOPUS™-scanner are mainly attributed to the large-area photodiode detector, which has lower noise.
III.A.2. Reconstructions
III.A.2.a. Geometrical accuracy and linearity of reconstructed attenuation coefficients
The geometrical accuracy of reconstruction and linearity of reconstructed attenuation coefficients for the CCD-scanner and the OCTOPUS™-scanner have been discussed in Oldham et al.29 and Guo et al.,24 respectively. For both scanners, accurate geometrical reconstruction has been demonstrated to within an experimental error of 0.5 mm, indicating little geometrical distortion due to effective elimination of stray and scattered light. For the CCD-scanner and the OCTOPUS™-scanner, the relationship between the optical-CT attenuation coefficients and true attenuation coefficients (measured by spectrophotometer) was linear with equations of y=83.109x+1331.6 (R2=0.978) and y=0.97x (R2=0.9979), respectively.
III.A.2.b. Resolution
The modulation transfer function (MTF) is a measure of the imaging resolution of a system.16,17 The MTF for the CCD-scanner was evaluated in Oldham et al.29 using a 70 μm object located at the center of the field of view. The MTF at a resolution of 20 lines/mm (50 μm) was 0.05, at 10 lines/mm (100 μm) was ~0.5 and at 5 lines/mm (200 μm) is ~0.8, which indicates potential to image features at submillimeter resolution. In this study, the CCD-scanner data was reconstructed with an isotropic resolution of 0.4 mm. Reconstructions at isotropic resolution of 0.5 mm, to exactly match the in-plane reconstruction resolution of the OCTOPUS™-scanner were not possible because of the limitations of the reconstruction software. The ability to reconstruct an entire 3D volume at an isotropic resolution of 0.4 mm for dose verification represents a substantial achievement.
III.A.2.c. Artifacts
Reconstructed central slices and 3D orthogonal views of the reconstructed attenuation coefficients from the CCD-scanner for the unirradiated PRESAGE™ insert, single rectangular beam treatment, parallel-opposed treatment and IMRT treatments are shown in Fig. 5. The outline of the single rectangular pencil beam and the detail of dosimetric gradients in the parallel-opposed and IMRT treatments are clearly seen in the 3D orthogonal views. Repeated scanning of the inserts did not appear to perturb the distribution of attenuation coefficients. Two predominant types of artifacts were observed in reconstructed slices, namely concentric ring artifacts and edge artifacts.
FIG. 5.
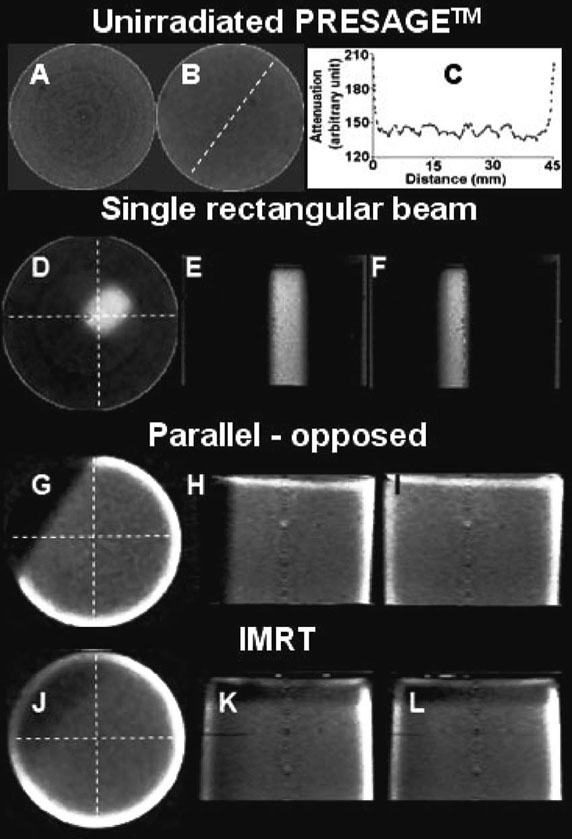
Reconstructions and corrections. Reconstructions of unirradiated PRESAGE™ insert (A–C) and inserts irradiated with a single rectangular beam (D–F), parallel-opposed treatment (G–I) and IMRT treatment (J–L). A shows a slice before median filtration whereas B shows the same slice after median filtration to minimize ring artifacts. C shows profile of reconstructed attenuation coefficients for unirradiated PRESAGE™ insert in B along the dotted line. D–F, G–I, and J–L show 3D orthogonal views of attenuation coefficients for the single rectangular beam, 3D conformal, and IMRT treatments, respectively. Detail of dosimetric distribution is available at an isotropic resolution of 0.4 mm in 3D.
Figure 5(A) shows a representative slice for unirradiated PRESAGE™ insert where ring artifacts are shown. These can be attributed to noise in projection images because of imperfect flood-field corrections. Ring artifacts were minimized by applying a median pass filter with a radius of 2 pixels [example shown in Fig. 5(B)]. The median pass filter replaced a particular pixel with the median value of pixels around it. Most slices from the OCTOPUS™-scanner did not exhibit ring artifacts.
Figure 5(C) shows the profile along the dotted line in the reconstructed slice of the unirradiated PRESAGE™ of Fig. 5(B). In general, the noise in the reconstructed profiles from the CCD-scanner appears higher than that in the OCTOPUS™-scanner because of higher noise in the projection images. The spikes at the region close to the wall of the insert are due to the edge artifact, which is attributed to refraction and reflection due to imperfect RI matching between the fluid and the insert resulting in inaccurate optical-CT scan (hence distorted reconstruction). The profile is essentially flat over the central 80% of the diameter of the insert. For the OCTOPUS™-scanner, the useful reconstruction region is ~90%, indicating that reflection and refraction effects are more predominant in the CCD-scanner, probably because of large area light source and detector.
III.B. Evaluation of feasibility of CCD-scanner for 3D dosimetry
III.B.1. Single rectangular beam treatment
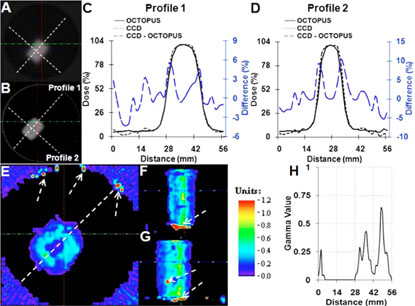
Comparison of dose readout from the CCD-scanner with coregistered readout from the gold-standard OCTOPUS™-scanner for the single rectangular beam treatment is shown in Fig. 6.Reconstructed central slices from the OCTOPUS™- and CCD-scanner are shown in Figs. 6(A) and 6(B),respectively. Dose profiles along the dotted lines in Figs. 6(A) and 6(B) are plotted in Figs. 6(C) and 6(D). In general, good agreement was observed between the independently measured dose distributions as seen by close match (<2.5 mm difference) of dose profiles at full width and half maximum. Similar close agreement was observed for all slices along the length of the insert.
FIG. 6.
Comparison of dose readout from CCD-scanner with gold-standard OCTOPUS™-scanner for single rectangular beam treatment. Coregistered axial slices form OCTOPUS™ (A) and CCD-scanner (B) are shown. Line profiles and dose-difference profiles between the CCD-scanner dose readout and OCTOPUS™-scanner dose readout are shown in C and D. Profiles from the CCD-scanner and OCTOPUS™-scanner show close agreement (<10% dose difference even along very steep dose gradient of >13% dose fall-off/mm). Gamma comparison (E–H) in all three planes revealed agreement to within 3% dose-difference and 3 mm distance-toagreement.
Further analysis was performed using the gamma comparison tool31,32 and dose-difference plots. The sophisticated gamma comparison tool combines dose-difference and distance-to-agreement criteria into a single index and is often used for comparing independent dose distributions. In the analysis presented in this study, the acceptance criterion was set to 3% dose-difference and 3 mm distance-to-agreement. This acceptance criterion is more stringent than the criterion presently used at Duke Clinics for MAPCHECK-based quality assurance for IMRT, which is 4% dose-difference and 4 mm distance-to-agreement. Gamma plots between dose readouts from the CCD- and OCTOPUS™-scanner in the central axial, sagittal, and coronal planes are shown in Figs. 6(E)–6(G). The gamma profile along the dotted line in the gamma map of Fig. 6(E) is plotted in Fig. 6(H). In general, the gamma value is <1, which demonstrates that the independent dose readouts from the CCD-scanner and the goldstandard OCTOPUS™-scanner are in agreement to within the 3%/3 mm criteria. Similar agreement was observed in the coronal and sagittal planes, except for a few points highlighted by arrows indicating comprehensive verification in 3D. Relatively high gamma values were observed in the penumbral (steep dose gradient) regions as compared to gamma values at the center and outside of the pencil beam.
Although the CCD-scanner readout passed the 3%/3 mm gamma criteria as compared to readout from the OCTOPUS™-scanner, the very steep dose fall-off from 100% to 3% over few millimeters at the edges of the rectangular pencil beam (regions with high gamma value), warrants scrupulous investigation. For regions with such steep dose-gradients, dose-difference plots between independent datasets might be more insightful. The blue dotted curve in Figs. 6(C) and 6(D) shows dose-difference between each individual data point from the CCD-scanner profile (dotted black) and the OCTOPUS™-scanner profile (solid black). Encouragingly, the dose-difference plot shows that the CCD-scanner and OCTOPUS™-scanner readout did not vary by more than 5% in the high-dose (center of the rectangular beam) and low-dose (outside of the rectangular beam) region and was <10%, even in the very steep dose gradient regions near the edges of the rectangular pencil beam.
Encouraging agreement between the CCD-scanner readout with the independent OCTOPUS™-scanner readout indicates that the CCD-scanner can accurately measure dose in 3D along very steep dose gradients in small pencil beam fields.
III.B.2. Parallel-opposed and IMRT treatments
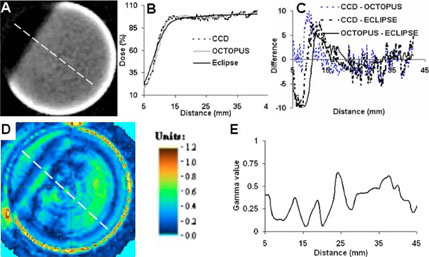
Comparison of dose readout from the CCD-scanner with coregistered independent readout from the OCTOPUS™- scanner and ECLIPSE calculations for the parallel-opposed treatment is shown in Fig. 7, where (A) is the central reconstructed slice from CCD-scanner and (B) is a plot of the CCD, OCTOPUS™, and ECLIPSE dose profile along the dotted line in (A). Encouraging visual agreement is observed between the CCD, OCTOPUS and ECLIPSE dose profiles. However, close inspection reveals that the dose gradient in the measured (CCD-and OCTOPUS™-scanner) readout has a systematically larger slope than the slope of the dose gradient calculated by ECLIPSE. This is expected because the dose calculation algorithms used by ECLIPSE employ commissioning data acquired using an IC-10 ion chamber. Since the IC-10 ion chamber has a finite size (diameter ~6 mm), the inherently lower resolution of the commissioning data translates into a known blurring of the calculated distribution in steep dose gradient regions where modeling errors lead to inaccuracies.24
FIG. 7.
Comparison of dose readout from CCD-scanner with readout from OCTOPUS™-scanner and ECLIPSE calculation for the 2-field open parallelopposed treatment. (A) Axial slice form CCD-scanner is shown. (B) Dose profile along dotted line in A was compared with profile across co-registered readout from the gold-standard OCTOPUS™-scanner and calculated ECLIPSE distribution. (C) Dose-difference plots at each point along profiles in B. Dosedifference was <10% even along the steep dose gradient at the beam edge of the parallel-opposed fields. Dose difference was <5% in high dose region. (D and E) Gamma comparison revealed agreement to within 3% dose-difference and 3 mm distance-to-agreement.
Gamma plots [Fig. 7(D) and 7(E)] and dose-difference plot [Fig. 7(C)] were further employed as quantitative comparison tools. The gamma comparison plot (3% /3 mm criteria ) between the central slice from the CCD-scanner and the OCTOPUS™-scanner is shown in Fig. 7(D) and a profile along the dotted line in the gamma map of Fig. 7(D) is shown in Fig. 7(E). The gamma value is <1 for most regions of the slice (indicating agreement to within 3%−3 mm) except certain regions near the edge of the insert, which are prone to edge artifact-associated inaccuracies. In this treatment, the dose gradient at the beam edges had a steep slope of ~7.2%/mm and the dose-difference plot provides a straightforward tool to assess discrepancies in dose measurement. Fig. 7(C) shows the dose-difference plot between the readout from the CCD-scanner and OCTOPUS™-scanner (blue dotted curve), the readout from the CCD-scanner and ECLIPSE calculations (black dotted curve) and the readout from the OCTOPUS™-scanner and ECLIPSE calculations (solid black curve) for all points in the dose plot of Fig. 7(B). The dose-difference plot shows that the CCD-scanner dose readout did not differ by more than 10% with either the independent OCTOPUS™-scanner readout or with ECLIPSE calculations along the region of steep dose gradient, whereas the difference was <5% in the high dose region. The dose-difference between the gold-standard OCTOPUS™-scanner readout and ECLIPSE calculations also shows similar values. Collectively, these results indicate that the CCD-scanner can accurately measure steep dose gradients that exist at the beam edges of parallel-opposed fields.
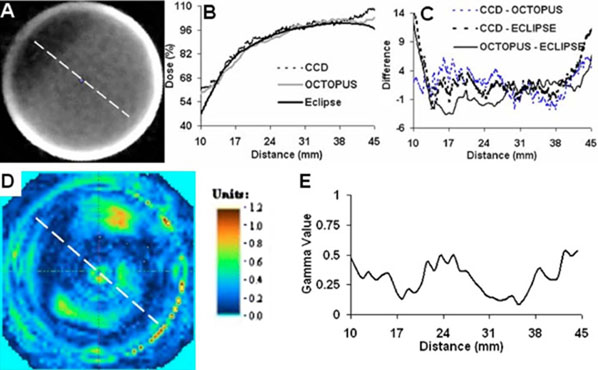
A similar comparison for the IMRT treatment is shown in Fig. 8. The dose profile plot in Fig. 8(B) is along the dotted line in the central slice of (A), and includes coregistered profiles from the CCD-scanner, OCTOPUS™scanner, and ECLIPSE calculations. Close agreement between the CCD-scanner dose-profile is observed as compared with independent measurement by the OCTOPUS™-scanner and ECLIPSE calculations except when approaching the edge of the PRESAGE™-insert where differences are observed because of inaccuracies due to edge artifacts in optical-CT measurements. The IMRT treatment created a moderate dose gradient of 1.8%/mm in the insert and the ECLIPSE calculation is expected to be accurate. Dose-difference plots and the gamma comparison provided further insight into the extent of agreement. The dose difference [Fig. 8(C)] between the measured readout from the CCD-scanner and ECLIPSE calculation was <5% except when approaching the edge. The dose difference between the gold-standard independent OCTOPUS™-readout and ECLIPSE calculation also showed a similar trend. The gamma analysis (3% /3 mm criteria) between the central slice from the CCD-scanner and the OCTOPUS™-scanner [Figs. 8(C) and 8(E)] shows that the gamma value is <1 in most regions of the slice except at some points near the edge. Collectively, these results indicate that the CCD-scanner can accurately measure moderate dose gradients in IMRT treatments where conformal dose is delivered by complicated modulation of dose fluence.
FIG. 8.
Comparison of dose readout from CCD-scanner with readout from OCTOPUS™-scanner and ECLIPSE calculation for the 7-field IMRT treatment. (A) Axial slice form CCD-scanner is shown. (B) Dose profile along dotted line in A was compared with profile across co-registered readout from the gold-standard OCTOPUS™-scanner and calculated ECLIPSE distribution. (C) Dose-difference plots at each point along profiles in B. Dose-difference was <5% along the moderate dose gradient except near the edge of the insert because of edge artefacts. (D and E) Gamma comparison revealed agreement to within 3%/3 mm acceptance criteria.
IV. CONCLUSIONS
This work demonstrates the feasibility of a novel CCD-based optical-CT scanner utilizing customized telecentric lens optics for comprehensive 3D dosimetry in ~5 cm diameter radiochromic dosimeters. The CCD-scanner can acquire a complete set of very high resolution projection images inonly five minutes with a modest (~3×) loss of noise-to-signal ratio. Performance of CCD-scanner for 3D dosimetry was evaluated by comparing its dose readout with the goldstandard OCTOPUS™-scanner and the calculated dose distribution from ECLIPSE for progressively complex single rectangular beam, parallel-opposed, and IMRT treatments delivered to PRESAGE™ inserts customized for the CIRS dynamic thorax phantom. Dose readout from the CCD-scanner for all treatments was found to be in good agreement (~10% dose-difference along steep dose gradients and ~5% dose-difference along moderate dose gradients) with independent readout from gold-standard OCTOPUS™-scanner and ECLIPSE calculations except near the edge of the inserts where edge artifacts were predominant. Gamma maps, used for quantitative estimate of the extent of agreement, revealed dose readout agreement between CCD-scanner and the OCTOPUS™-scanner to within 3% dose-difference and 3 mm distance-to-agreement for all treatments. The main limitation of the CCD-scanner was the predominant edge artifacts, which limited the useful region of the insert to within 80% of its diameter. While the results are encouraging, the image quality (noise and edge artefact) from the CCD-scanner can be further improved by enhancing the components in the optical chain (e.g., cooled CCD chip and higher precision of data acquisition). In summary, the combination of lower cost compared to other modalities (e.g., MRI) and potential for high resolution, presents the novel CCD scanner as a practical and attractive tool for comprehensive 3D dosimetry.
ACKNOWLEDGMENT
We are grateful to Dr. John Adamovics for providing the PRESAGE™ inserts used in this study. This work was made possible by NIH through Grant No. R01 CA 100835.
References
- 1.Letourneau D, Gulam M, Yan D, Oldham M, Wong JW. Evaluation of a 2D diode array for IMRT quality assurance. Radiother. Oncol. 2004;70:199–206. doi: 10.1016/j.radonc.2003.10.014. [DOI] [PubMed] [Google Scholar]
- 2.Vatnitsky SM, Schulte RW, Galindo R, Meinass HJ, Miller DW. Radiochromic film dosimetry for verification of dose distributions delivered with proton-beam radiosurgery. Phys. Med. Biol. 1997;42:1887–1898. doi: 10.1088/0031-9155/42/10/003. [DOI] [PubMed] [Google Scholar]
- 3.Oldham M, et al. An investigation into the dosimetry of a nine-field tomotherapy irradiation using BANG-gel dosimetry. Phys. Med. Biol. 1998;43:1113–1132. doi: 10.1088/0031-9155/43/5/005. [DOI] [PubMed] [Google Scholar]
- 4.Oldham M, Siewerdsen JH, Shetty A, Jaffray DA. High resolution gel-dosimetry by optical-CT and MR scanning. Med. Phys. 2001;28:1436–1445. doi: 10.1118/1.1380430. [DOI] [PubMed] [Google Scholar]
- 5.Heufelder J, et al. Use of BANG polymer gel for dose measurements in a 68 MeV proton beam. Med. Phys. 2003;30:1235–1240. doi: 10.1118/1.1575557. [DOI] [PubMed] [Google Scholar]
- 6.Maryanski MJ, Zastavker YZ, Gore JC. Radiation dose distributions in three dimensions from tomographic optical density scanning of polymer gels: II. Optical properties of the BANG polymer gel. Phys. Med. Biol. 1996;41:2705–2717. doi: 10.1088/0031-9155/41/12/010. [DOI] [PubMed] [Google Scholar]
- 7.McJury M, et al. Radiation dosimetry using polymer gels: Methods and applications. Br. J. Radiol. 2000;73:919–929. doi: 10.1259/bjr.73.873.11064643. [DOI] [PubMed] [Google Scholar]
- 8.Chu KC, Jordan KJ, Battista JJ, Van Dyk J, Rutt BK. Polyvinyl alcohol-Fricke hydrogel and cryogel: Two new gel dosimetry systems with low Fe3+ diffusion. Phys. Med. Biol. 2000;45:955–969. doi: 10.1088/0031-9155/45/4/311. [DOI] [PubMed] [Google Scholar]
- 9.Kelly RG, Jordan KJ, Battista JJ. Optical CT reconstruction of 3D dose distributions using the ferrous-benzoic-xylenol (FBX) gel dosimeter. Med. Phys. 1998;25:1741–1750. doi: 10.1118/1.598356. [DOI] [PubMed] [Google Scholar]
- 10.Guo PY, Adamovics JA, Oldham M. Characterization of a new radiochromic three-dimensional dosimeter. Med. Phys. 2006;33:1338–1345. doi: 10.1118/1.2192888. [DOI] [PMC free article] [PubMed] [Google Scholar]
- 11.Maryanski MJ, et al. Magnetic resonance imaging of radiation dose distributions using a polymer-gel dosimeter. Phys. Med. Biol. 1994;39:1437–1455. doi: 10.1088/0031-9155/39/9/010. [DOI] [PubMed] [Google Scholar]
- 12.Schulz RJ, Maryanski MJ, Ibbott GS, Bond JE. Assessment of the accuracy of stereotactic radiosurgery using Fricke-infused gels and MRI. Med. Phys. 1993;20:1731–1734. doi: 10.1118/1.597126. [DOI] [PubMed] [Google Scholar]
- 13.Mather ML, Whittaker AK, Baldock C. Ultrasound evaluation of polymer gel dosimeters. Phys. Med. Biol. 2002;47:1449–1458. doi: 10.1088/0031-9155/47/9/302. [DOI] [PubMed] [Google Scholar]
- 14.Hilts M, Jirasek A, Duzenli C. Technical considerations for implementation of x-ray CT polymer gel dosimetry. Phys. Med. Biol. 2005;50:1727–1745. doi: 10.1088/0031-9155/50/8/008. [DOI] [PubMed] [Google Scholar]
- 15.Oldham M. Optical-CT scanning of polymer gels. J. Phys. 2004;3:122–135. doi: 10.1088/1742-6596/3/1/011. [DOI] [PMC free article] [PubMed] [Google Scholar]
- 16.Oldham M, Kim L. Optical-CT gel-dosimetry. II: Optical artifacts and geometrical distortion. Med. Phys. 2004;31:1093–1104. doi: 10.1118/1.1655710. [DOI] [PMC free article] [PubMed] [Google Scholar]
- 17.Oldham M, Siewerdsen JH, Kumar S, Wong J, Jaffray DA. Optical-CT gel-dosimetry I: Basic investigations. Med. Phys. 2003;30:623–634. doi: 10.1118/1.1559835. [DOI] [PMC free article] [PubMed] [Google Scholar]
- 18.Xu Y, Wuu CS, Maryanski MJ. Performance of a commercial optical CT scanner and polymer gel dosimeters for 3-D dose verification. Med. Phys. 2004;31:3024–3033. doi: 10.1118/1.1803674. [DOI] [PubMed] [Google Scholar]
- 19.Gore JC, Ranade M, Maryanski MJ, Schulz RJ. Radiation dose distributions in three dimensions from tomographic optical density scanning of polymer gels: I. Development of an optical scanner. Phys. Med. Biol. 1996;41:2695–2704. doi: 10.1088/0031-9155/41/12/009. [DOI] [PubMed] [Google Scholar]
- 20.Adamovics J, Dietrich J, Jordan K. Enhanced performance of PRESAGE—sensitivity and post-irradiation stability. Med. Phys. 2005;32:2005. [Google Scholar]
- 21.Adamovics J, Maryanski M. New 3D radiochromic solid polymer dosimeter from leuco dyes and a transparent polymeric matrix. Med. Phys. 2003;30:1349. [Google Scholar]
- 22.Adamovics J, Maryanski M. OCT scanning properties of PRESAGE—A 3D radiochromic solid polymer dosimeter. Med. Phys. 2004;31:1906. [Google Scholar]
- 23.Adamovics J, Maryanski MJ. Characterisation of PRESAGE: A new 3-D radiochromic solid polymer dosemeter for ionising radiation. Radiat. Prot. Dosim. 2006;120:107–112. doi: 10.1093/rpd/nci555. [DOI] [PubMed] [Google Scholar]
- 24.Guo P, Adamovics J, Oldham M. A practical three-dimensional dosimetry system for radiation therapy. Med. Phys. 2006;33:3962–3972. doi: 10.1118/1.2349686. [DOI] [PMC free article] [PubMed] [Google Scholar]
- 25.Doran SJ, et al. A CCD-based optical CT scanner for high-resolution 3D imaging of radiation dose distributions: Equipment specifications, optical simulations and preliminary results. Phys. Med. Biol. 2001;46:3191–3213. doi: 10.1088/0031-9155/46/12/309. [DOI] [PubMed] [Google Scholar]
- 26.Wolodzko JG, Marsden C, Appleby A. CCD imaging for optical tomography of gel radiation dosimeters. Med. Phys. 1999;26:2508–2513. doi: 10.1118/1.598772. [DOI] [PubMed] [Google Scholar]
- 27.DeJean P, Senden R, McAuley K, Rogers M, Schreiner LJ. Initial experience with a commercial cone beam optical CT unit for polymer gel dosimetry I: Optical dosimetry issues. J. Phys.: Conf. Ser. 2006;56:179–182. [Google Scholar]
- 28.Jordan K, Battista J. Linearity and image uniformity of the Vista™ optical cone beam scanner. J. Phys.: Conf. Ser. 2006;56:217–220. [Google Scholar]
- 29.Oldham M, et al. Three-dimensional imaging of whole rodent organs using optical computed and emission tomography. J. Biomed. Opt. 7;12:014009. doi: 10.1117/1.2709858. [DOI] [PubMed] [Google Scholar]
- 30.Islam KT, Dempsey JF, Ranade MK, Maryanski MJ, Low DA. Initial evaluation of commercial optical CT-based 3D gel dosimeter. Med. Phys. 2003;30:2159–2168. doi: 10.1118/1.1593636. [DOI] [PubMed] [Google Scholar]
- 31.Low DA, Dempsey JF. Evaluation of the gamma dose distribution comparison method. Med. Phys. 2003;30:2455–2464. doi: 10.1118/1.1598711. [DOI] [PubMed] [Google Scholar]
- 32.Low DA, Harms WB, Mutic S, Purdy JA. A technique for the quantitative evaluation of dose distributions. Med. Phys. 1998;25:656–661. doi: 10.1118/1.598248. [DOI] [PubMed] [Google Scholar]
- 33.Krstajic N, Doran SJ. Focusing optics of a parallel beam CCD optical tomography apparatus for 3D radiation gel dosimetry. Phys. Med. Biol. 2006;51:2055–2075. doi: 10.1088/0031-9155/51/8/007. [DOI] [PubMed] [Google Scholar]
- 34.Conklin J, Deshpande R, Battista J, Jordan K. Fast laser optical CT scanner with rotating mirror and Fresnel lenses. J. Phys.: Conf. Ser. 2006;56:211–213. [Google Scholar]
- 35.Krstajic N, Doran SJ. Fast laser scanning optical-CT apparatus for 3D radiation dosimetry. Phys. Med. Biol. 2007;52:N257–263. doi: 10.1088/0031-9155/52/11/N01. [DOI] [PubMed] [Google Scholar]


