

Abstract
Molecular interactions and mechanical properties that contribute to the stability and function of proteins are complex and of fundamental importance. In this study, we used single-molecule dynamic force spectroscopy (DFS) to explore the interactions and the unfolding energy landscape of bovine rhodopsin and bacteriorhodopsin. An analysis of the experimental data enabled the extraction of parameters that provided insights into the kinetic stability and mechanical properties of these membrane proteins. Individual structural segments of rhodopsin and bacteriorhodopsin have different properties. A core of rigid structural segments was observed in rhodopsin but not in bacteriorhodopsin. This core may reflect differences in mechanisms of protein folding between the two membrane proteins. The different structural rigidity of the two proteins may also reflect their adaptation to differing functions.
Introduction
Protein folding is one of the most challenging problems of modern molecular biology.1–7 Though considerable progress has been made in the mechanistic understanding of the folding of soluble proteins, elucidating the principles underlying the folding of transmembrane proteins is especially challenging.8,9 Studying membrane protein folding is a daunting job because of aggregation of the proteins under in vitro conditions and the obstacle of being situated in an anisotropic lipid environment.8,10,11
Rhodopsin and bacteriorhodopsin have served as excellent model systems for studying various properties of membrane proteins.12–14 Rhodopsin is the light-activated G-protein coupled receptor (GPCR) involved in scotopic vision, and bacteriorhodopsin is a light-driven proton pump from the purple membrane of Halobacterium salinarum. Both proteins contain seven α-helical transmembrane domains but have different topologies. The debatable folding mechanism of membrane proteins6,15,16 and the increasing discovery of mutations in membrane proteins that cause instability, misfolding, and debilitating diseases17 have necessitated the invention of new approaches to answer pertinent questions related to the mechanistic details of membrane protein folding.
For more than a decade, the atomic force microscope (AFM) has permitted the use of single-molecule force spectroscopy (SMFS)18,19 to study the folding and unfolding of soluble globular proteins.20–23 A similar strategy has since been adopted for membrane proteins, with the first single-molecule mechanical unfolding experiments being performed on bacteriorhodopsin in 2000.24 Since then, detailed insights have been obtained using SMFS on the folding and unfolding mechanisms of a number of membrane proteins such as bacteriorhodopsin,25,26 human aquaporin-1,27 Na+/H+ antiporters NhaA28 and MjNhaP1,29 halorhodopsin,30 and bovine rhodopsin.31 (See ref 32 for a recent review.)
Single-molecule dynamic force spectroscopy (DFS) provides a glimpse into the complex energy landscape of a protein.23,33 DFS has gained momentum in extracting key characteristics of energy landscapes describing the unfolding of water-soluble proteins23,34–36 and ligand–receptor interactions.37–39 Previously, using DFS we have obtained insights into the unfolding mechanisms of individual secondary structure elements of bacteriorhodopsin.26,40 Here we explore the details of the energy landscape of bovine rhodopsin as obtained from DFS measurements. Using the parameters obtained by DFS for both rhodopsin and bacteriorhodopsin, we calculated the rigidity of each structural segment in these membrane proteins. Acomparison of the rigidity of structural segments in both light-activated membrane proteins revealed insights into possible mechanisms of their unfolding, folding, and function.
Materials and Methods
Rod Outer Segment Disc Membrane Preparation
All experimental procedures were carried out under dim red light. Centrifugation steps were performed at 4 °C. Rod outer segments were purified from fresh bovine retinas as described41 and stored at −80 °C. To obtain disc membranes, rod outer segment membranes were resuspended using a hand-held glass homogenizer with 13 mL of buffer A (2 mM Tris-HCl, pH 7.4) and incubated overnight at 4 °C. The membrane suspension was centrifuged at 26 500g for 30 min. Membranes were then washed twice with 13 mL of buffer A and three times with 3 mL of buffer B (2 mM Tris-HCl, 150 mM NaCl, 2 mM EDTA, pH 7.4), after collecting each time by centrifugation at 26 500g for 30 min. Membranes resuspended in buffer A were used for AFM imaging and SMFS. Alternatively, membranes were resuspended in buffer C (67 mM potassium phosphate, 1 mM magnesium acetate, 0.1 mM EDTA, 1 mM DTT, 18% sucrose, pH 7.0) and stored at −80 °C. Membranes stored in buffer C were washed twice with buffer A prior to SMFS studies.
SMFS and DFS
SMFSwas performed as described previously.42 Rod outer segment disc membranes were adsorbed onto a freshly cleaved mica surface. To unfold an individual rhodopsin molecule mechanically, the AFM stylus was brought into contact with the disc membrane surface. A contact force of ~1 nN was applied between the AFM stylus and the protein membrane to attach the terminus of rhodopsin nonspecifically to Si3N4 cantilevers (NPS, Veeco Metrology). After a contact time of ~0.5–1 s, the stylus was retracted from the membrane surface at a constant velocity. Experiments were performed using two different types of AFM equipment, viz., Picoforce (dI-Veeco) and Multimode (dI-Veeco).
DFS on rhodopsin was performed at six different speeds: 100, 349, 700, 1310, 2620, and 5230 nm/s. All DFS experiments were conducted at room temperature under identical physiological conditions (i.e., the pH and electrolyte composition of the assay buffer (150 mM KCl, 25 mM MgCl2, 20 mM Tris, pH 7.8) were kept constant). Spring constants of the 200-μm-long AFM cantilevers (NPS, di-Veeco; nominal spring constant ~0.08 N/m) were calibrated in buffer solution using the equipartition theorem.43 Measured spring constants were within ~10% of each other. To minimize errors due to cantilever spring constant deviations in DFS measurements, rhodopsin was unfolded at a specific speed using at least three different cantilevers from the same wafer. F–D curves were collected over a period of less than 1 h. The number of curves collected for rhodopsin at each speed were 100 nm/s (n = 76), 349 nm/s (187), 700 nm/s (143), 1310 nm/s (83), 2620 nm/s (79), and 5230 nm/s (73). The data at 349 nm/s were taken from a recent work.31 WT bacteriorhodopsin data were taken from a recent study,26 with the number of curves at 10 nm/s (n=10), 50 nm/s (84), 87.2 nm/s (79), 654 nm/s (165), 1310 nm/s (121), 2620 nm/s (23), and 5230 nm/s (51).
Selection and Analysis of F–D Curves
F–D curves were first separated on the basis of length.42 All F–D curves exhibiting similar unfolding spectra and lengths were selected and aligned using identical procedures and criteria to those established previously.44 Every peak of a single F–D curve was fitted using the wormlikechain (WLC) model with a persistence length of 0.4 nm.45 The number of extended amino acid residues at each peak was calculated from the contour length obtained from WL Cfits assuming an amino acid residue length of 0.36 nm. This approach allowed the assignment of unfolding events to specific structural segments of rhodopsin as described previously.44
Calculation of xu and ku from DFS
DFS involves unfolding a protein at different pulling speeds.46 Plotted as the most probable unfolding force versus loge(loading rate), the force spectrum maps the most prominent energy barriers in the energy landscape along the force-driven pathway and exposes the differences in energy between barriers.37 The most probable unfolding force, Fp, can be described as Fp=(kBT/xu) ln(xurf/kBTku), where kB is the Boltzmann constant, T is the temperature, xu is the distance from the free-energy minimum to the transition-state barrier, ku denotes the unfolding rate under no applied force, and rf is the loading rate. Instead of the most probable force, we used the mean force. The slope, kBT/xu, and the x intersection, kBTku/xu, of a line fit with the above equation to a semilogarithmic plot of the average force versus loading rate gave estimates of xu and ku. The loading rate was calculated using a line fit to the WL Ccurve of the same contour length as the corresponding force peak.47 The average unfolding force and 30% of this force were taken as the upper and lower boundary limits of the fit.40
Estimation of Transition Barrier Heights and Rigidity
The barrier height, ΔGu‡, for a transition state from a folded state was estimated using the Arrhenius equation, ΔGu‡ = −kBT ln(τA/τ0), where τ0 denotes the unloaded lifetime of the state (τ0 = 1/ku) and 1/τA is the Arrhenius frequency factor.23 For protein dynamics, τA has a value of 10−9 s.48 The ΔGu‡ values for all structural segments were estimated using this value. The errors in ΔGu‡ were estimated by propagating the errors of ku. ΔGu‡ and xu were used to calculate the spring constant κ using the equation κ = 2ΔGu‡/xu 2. 49–51 This value served as an estimate of protein rigidity in the direction of pulling. The errors in ΔGu‡ and xu were propagated in the estimation of errors of κ.
Results
DFS of Bovine Rhodopsin
In DFS, proteins are unfolded over a wide range of loading rates. This approach enables elucidation of the energy barriers in the unfolding energy landscape of the protein. For each structural segment unfolded in a membrane protein, a semilogarithmic plot of the average unfolding force versus loading rate gives the position of the unfolding transition state from the folded intermediate state, xu, and the unfolding rate at zero force, ku 33 (Materials and Methods section). The energy landscape of bacteriorhodopsin elucidated previously revealed the positions of transition-state barriers and the kinetic stability of each structural segment.26
In the current study, we performed DFS on bovine rhodopsin, and compared the energetics of this molecule with that of bacteriorhodopsin. A linear relationship was observed between the average unfolding force and loge(loading rate) for rhodopsin (Figure 1). This linear relationship is predicted by the Bell–Evans theory for dynamic pulling under force,33 which describes two-state unfolding behavior with a sharp transition for all structural segments of rhodopsin. The xu and ku values determined from these plots are given in Table 1.
Figure 1.

DFS of bovine rhodopsin. Rhodopsin was unfolded from native disc membranes of bovine retinal rod outer segments at six different speeds: 100, 349, 700, 1310, 2620, and 5230 nm/s. The slope of a semilogarithmic plot of the average unfolding force vs loading rate gave the xu and ku values for each structural segment. (A) Average unfolding forces of structural segments found in the N-terminal region of rhodopsin as displayed in (D). N1 and N2 in (A) denote the two stable structural segments found in the N-terminal end shown in (D). H1 denotes transmembrane α-helix I, C1 denotes the cytoplasmic loop I, and H2.1 denotes the cytoplasmic half of α-helix II. (B) Average unfolding forces of the central region of rhodopsin (E). (C) Average unfolding force of the C-terminal region of rhodopsin (F). H2.2 denotes the structural segment established by the extracellular half of α-helix II, and E1 denotes extracellular loop I. The structural segment H3, H4, C2, E2 is established by transmembrane α-helices III and IV, cytoplasmic loop II, and extracellular loop II. H5, C3 represents the structural segment established by α-helix V and cytoplasmic loop III. H6.1 and H6.2 denote the structural segments formed by cytoplasmic and extracellular ends of transmembrane α-helix VI, respectively. H7 and H8 denote the structural segments formed by α-helices VII and VIII, respectively. CT is assigned to the stable structural segment of the C-terminal end. Data points depict the average unfolding forces, and error bars denote the standard error of the mean (SEM).
Table 1.
xu, ku, ΔGu‡, and K of Structural Segments of Bovine Rhodopsina
| secondary structure |
structural segment |
xu (±SD) (nm) |
ku (±SD) (s−1) |
ΔGu‡ (kBT) | K (N/m) |
|---|---|---|---|---|---|
| N-terminal region | N1 | 0.29 ± 0.06 | (4.1 ± 7.5) × 10−1 | 22 | 2.1 |
| N-terminal region | N2 | 0.21 ± 0.03 | 1.7 ± 1.6 | 20 | 3.8 |
| α-helix I | H1 | 0.24 ± 0.02 | (5.0 ± 3.7) × 10−1 | 21 | 3.0 |
| loop C-I | C1 | 0.22 ± 0.04 | 1.3 ± 1.3 | 20 | 3.5 |
| α-helix II | H2.1 | 0.25 ± 0.03 | 1.6 ± 1.2 | 20 | 2.7 |
| α-helix II | H2.2 | 0.47 ± 0.09 | (2.1 ± 4.1) × 10−2 | 25 | 0.9 |
| loop E-I | E1 | 0.33 ± 0.03 | (7.9 ± 5.9) × 10−2 | 23 | 1.8 |
| α-helices III and IV, loops C-II and E-II |
H3, H4, C2, E2 | 0.21 ± 0.02 | (14.8 ± 9.3) × 10−2 | 23 | 4.2 |
| α-helix V and loop C-III | H5, C3 | 0.25 ± 0.03 | (9.0 ± 8.2) × 10−2 | 23 | 3.0 |
| α-helix VI | H6.1 | 0.34 ± 0.05 | (1.0 ± 1.2) × 10−1 | 23 | 1.6 |
| α-helix VI | H6.2 | 0.42 ± 0.07 | (1.3 ± 1.6) × 10−1 | 23 | 1.1 |
| loop E-III | E3 | 0.34 ± 0.04 | (1.8 ± 1.6) × 10−1 | 22 | 1.6 |
| α-helix VII | H7 | 0.36 ± 0.04 | (7.4 ± 7.0) × 10−2 | 23 | 1.5 |
| α-helix 8 | H8 | 0.44 ± 0.14 | (6.6 ± 22.1) × 10−3 | 26 | 1.1 |
| C-terminal region | CT | 0.33 ± 0.06 | (4.5 ± 7.0) × 10−2 | 24 | 1.8 |
Values shown for parameters xu and ku, obtained from DFS experiments (Figure 1) indicate structural and energetic properties of each structural segment. Structural segment N2, segments C1 and H3, H4, C2, and E2 constitute the rigid parts of rhodopsin, and segment H2.2 and segments H6.2 and H8 constitute the flexible regions.
Comparison of Parameters Describing the Unfolding Energy Landscapes of Rhodopsin and Bacteriorhodopsin
The relationship between values determined for the parameters xu, ku, and ΔGu‡ for rhodopsin (Table 1) and bacteriorhodopsin (Table 2) is shown in Figure 2. The parameters xu and ΔGu‡ were positively correlated whereas xu and log(ku) were negatively correlated for both membrane proteins. In apparent contrast, SMFS studies of the green fluorescent protein (GFP) showed no clear trend,50 which suggests that the relationship between these parameters may be different for soluble and membrane proteins or even specific to the protein itself. Values of these three parameters for all structural segments of rhodopsin fell within the range of those in bacteriorhodopsin. Five structural segments in bacteriorhodopsin exhibited larger values of xu and ΔGu‡ than the structural segment exhibiting the largest value for these parameters in rhodopsin. Similarly, five structural segments in bacteriorhodopsin exhibited higher kinetic stability than the most stable segment in rhodopsin. The higher kinetic stability observed in some of the structural segments of bacteriorhodopsin may represent an adaptation because its organism functions under much harsher environmental conditions than that of rhodopsin.
Table 2.
xu, ku, ΔGu‡, and K of Structural Segments of Bacteriorhodopsina
| structural segment |
xu (±SD) (nm) |
ku (±SD) (s−1) |
ΔGu‡ (kBT) |
K (N/m) |
|---|---|---|---|---|
| α-helix G | 0.16 ± 0.04 | 4.7 ± 8.9 × 10⁻¹ | 21 | 6.9 |
| loop GF | 0.15 ± 0.02 | 1.8 ± 1.7 | 20 | 7.3 |
| loop GF and α-helix F |
0.42 ± 0.32 | 7.9 ± 53.6 × 10⁻² | 23 | 1.1 |
| α-helix F | 0.32 ± 0.05 | 3.1 ± 3.2 × 10⁻¹ | 22 | 1.8 |
| α-helices E and D |
0.33 ± 0.02 | 9.8 ± 7.4 × 10⁻³ | 25 | 1.9 |
| α-helix E | 0.44 ± 0.07 | 2.3 ± 5.3 × 10⁻⁴ | 29 | 1.2 |
| α-helix D | 0.58 ± 0.19 | 2.1 ± 9.4 × 10⁻⁴ | 29 | 0.7 |
| α-helices B and C |
0.69 ± 0.18 | 4.2 ± 13.6 × 10⁻⁴ | 28 | 0.5 |
| α-helix C | 0.39 ± 0.05 | 5.9 ± 5.1 × 10⁻² | 24 | 1.3 |
| α-helix C and loop BC |
0.38 ± 0.09 | 7.3 ± 13.4 × 10⁻² | 23 | 1.3 |
| loop BC and α-helix B |
0.37 ± 0.04 | 9.1 ± 7.7 × 10⁻² | 23 | 1.4 |
| loop BC | 0.61 ± 0.18 | 1.4 ± 4.6 × 10⁻³ | 27 | 0.6 |
| α-helix B | 0.48 ± 0.07 | 6.6 ± 6.8 × 10⁻² | 23 | 0.8 |
| α-helix A (and N terminus) |
0.68 ± 0.1 | 1.9 ± 3.6 × 10⁻⁴ | 29 | 0.5 |
Values shown for parameters xu and ku, obtained from DFS experiments26 indicate structural and energetic properties of each structural segment.
Figure 2.
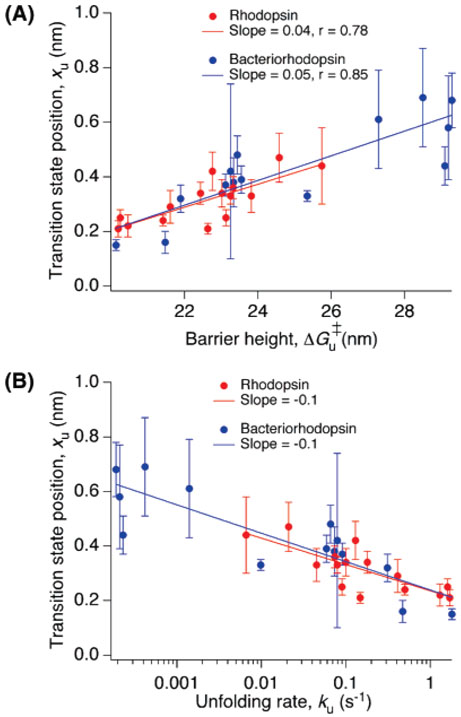
Relation between xu, ku and ΔGu‡. (A) xu increased with ΔGu‡, and (B) ku increased with decreasing xu for all structural segments in rhodopsin and bacteriorhodopsin. The values plotted for rhodopsin and bacteriorhodopsin are from Tables 1 and 2, respectively.
Mechanical Properties of Rhodopsin and Bacteriorhodopsin
The rigidity of a material depends on the curvature of the potential well in its energy profile, the energy difference between the folded state and the transition-state barrier (ΔGu‡), and the distance of the transition state from the folded state (xu) (Figure 3).51 Considering a parabolic potential for the partially folded intermediate states and a sharp transition barrier (also suggested by DFS data) for the structural segments of rhodopsin and bacteriorhodopsin, we calculated the spring constant, κ, of each structural segment using the equation κ = 2ΔGu‡/xu2.49–51 We used the spring constant as an indicator of the rigidity of structural segments.
Figure 3.
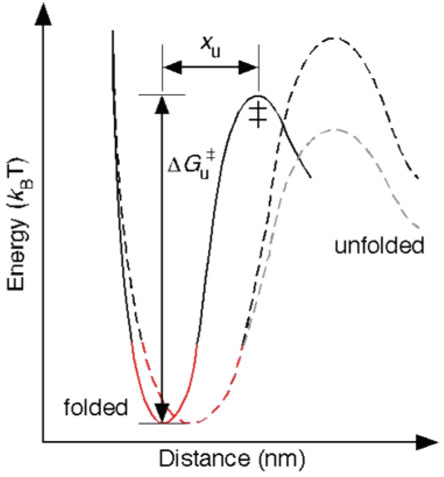
Unfolding energy profile of a structural segment in a membrane protein. DFS measurements give an estimate of the distance, xu, between the energy minimum of the folded state and the transition state (‡) as well as the height of the transition barrier, ΔGu‡. The rigidity of structural segments depends on the curvature of the potential well (shown in red) in the energy profile. Using xu and ΔGu‡ and assuming a parabolic shape of the potential well and a sharp transition barrier, we calculated the spring constant, κ, of each structural segment of rhodopsin and bacteriorhodopsin (Tables 1 and 2). The black dashed trace shows that an increase in xu decreases the rigidity of the structural segment in rhodopsin and bacteriorhodopsin. In general, the height of the energy barrier can increase or decrease with an increase in xu as shown by the black and gray dashed traces.
The value for κ of the structural segments in rhodopsin ranged from 0.9 to 4.2 N/m. The most rigid structural regions in rhodopsin are structural segment N2 (3.8 N/m), segment H3, H4, C2, E2 (4.2 N/m), and segment C1 (3.5 N/m), whereas the most flexible regions are segment H2.2 (0.9 N/m), segment H6.2 (1.1 N/m), and segment H8 (1.1 N/m) (Figure 4, Table 1). All structural segments after segment H5, C3 exhibited low rigidity.
Figure 4.

Rigidity of structural segments of rhodopsin. The rigidity of structural segments was estimated by calculating the spring constant, κ, from xu and ΔGu‡ values derived from DFS experiments. Colored bars in the graph correspond to the structural segments outlined in the secondary structures above.
κ was calculated for the different structural segments in bacteriorhodopsin using the values obtained previously by DFS.26 Except for the structural segments composed of α-helix G and loop GF individually, all of the structural segments exhibited a value for κ of less than 2 N/m (Table 2, Figure 5). The most rigid structural regions in bacteriorhodopsin include α-helix G and loop GF. The chromophore is covalently linked to a lysine residue in helix G, and the rigidity of this segment may relate in part to the interaction of the chromophore with other regions of the protein.
Figure 5.

Rigidity of structural segments of bacteriorhodopsin. The rigidity of structural segments in bacteriorhodopsin was estimated by calculating the spring constant, κ, from values of xu and ΔGu‡ derived from previous DFS studies.26 Structural segments α-helix G and loop GF constitute the most rigid regions of the protein. A structural segment could unfold via different pathways. The rigidity of structural segments unfolding via one pathway is shown here.
Discussion
Rigid Structural Segments and Folding of Rhodopsin and Bacteriorhodopsin
The unfolding of both bovine rhodopsin and bacteriorhodopsin by mechanical force shows the existence of well-defined structural segments.24,25,31 These segments, which are composed of complete or partial transmembrane α-helices, individual interhelical loops, or a combination of the two, resist unfolding under force and exhibit mechanical stability. The mechanical unfolding of rhodopsin reveals the presence of two states under the experimental conditions employed, one with an intact native disulfide bond between Cys110 and Cys187 and another in the absence of this native disulfide bond.31,52 For both states, the location of structural segments in the secondary structure of rhodopsin and the force required to unfold each of those regions were determined. These unfolding forces reflect the strength of interactions stabilizing structural segments of rhodopsin.32
Whereas forced unfolding experiments directly measure the tensile strength of a molecule, it has been shown previously that these types of measurements can provide a good indication of the rigidity of the intact protein53. The rigidity values of proteins under different experimental conditions have been estimated previously by force spectroscopy using the parameter xu,49,50 which is the thermally averaged distance between the folded state and the transition state in the direction of applied force. The magnitude of xu provides information on the physical characteristics of a protein. Structural segments with a smaller value of xu withstand force for smaller extensions before reaching their transition states, suggesting that they are brittle. Segments with larger values of xu are more compliant and resistant to the applied force for larger extensions of the protein before reaching their transition states and thus indicate a resilient nature.
Bovine rhodopsin and bacteriorhodopsin each contain seven transmembrane α-helices but have different topologies and functions. Four out of the first five segments pulled in rhodopsin (N2, H1, C1, and H2.1) exhibit increased rigidity compared to the rest of the segments, except for segments H3, H4, C2, E2, and H5, C3 (Figures 4 and 6). In contrast, the first two pulled structural segments of bacteriorhodopsin exhibit a significantly higher rigidity compared to the remaining segments (Figure 5). Thus, the distribution of rigid and flexible structural segments is different in rhodopsin and bacteriorhodopsin. The determination of the rigidity in structural segments using DFS, especially in those that occur later in the unfolding process, could be an underestimation because the protein is unfolded sequentially over time. Moreover, because of the anisotropy of the protein, the rigidity of structural segments may change if the protein is pulled from a different direction (e.g., the other terminus).54,55 The rigidity estimated for the later structural segments in the unfolding process is more a measure of their intrinsic rigidity because much of the protein has already been unfolded.
Figure 6.

Rigidity of structural segments of bovine rhodopsin. The rigidity, κ, of structural segments is mapped onto the crystal structure of bovine rhodopsin (PDB ID 1U1967). Segments are colored from white to blue according to their rigidity, where white represents the most flexible region (κ = 0.9 N/m) and blue represents the most rigid region (κ = 4.2 N/m). The rigidity of segments is also indicated by the thickness of the chain, where increasing thickness corresponds to increasing rigidity. The first 19 amino acid residues are dark gray because no rigidity value is available for that region. (A) Side view of rhodopsin with the extracellular side on the top and the cytoplasmic side on the bottom. 11-cis-Retinal is represented as pink spheres. (B) Top view of rhodopsin from the extracellular side looking down into the retinal-binding pocket. (C) Enlarged view of B with rhodopsin represented as spheres and 11-cis-retinal displayed in a stick representation. The amino terminus and extracellular loops have been removed in this image so that the chromophore is visible. Extracellular loop II forms a lid over the retinal-binding pocket and would cover the chromophore in this view. Images were created in PyMOL v. 0.99.68
The distribution of rigid and flexible segments in rhodopsin as observed by DFS is consistent with the computational studies of Tastan et al.,15 which proposed that rhodopsin has a folding core involving interactions between amino acids that are close in space but distant in sequence (long-range interactions). Our results indicate that the four structural segments at the beginning of the rhodopsin structure show high rigidity, presumably due to both an intact tertiary structure and the inherent stability of the segments. This high rigidity is followed by a decrease in the rigidity of segments H2.1 and H2.2 and then a large increase in the rigidity of structural segments H3, H4, C2, E2 and H5, C3. This core of rigid structural segments identified by DFS roughly corresponds to the rigid folding core observed in computational studies that include amino acid residues from α-helices II, III, IV, and V, the N terminus, and extracellular loops II and III.15,56 The rigid core in computational studies has been suggested to be indicative of a cooperative folding process involving longrange interactions similar to those in the highly cooperative folding observed in globular proteins that arise in part from interactions between residues that are distant in sequence but close in space. In contrast to rhodopsin, bacteriorhodopsin exhibits only rigid regions in the first two pulled structural segments whereas the rest of the segments are more flexible (Table 2). The same calculations of Tastan et al. showed that bacteriorhodopsin exhibits interactions within individual and groups of transmembrane helices that do not establish a rigid folding core. Thus, the rigid core of structural segments in rhodopsin observed in this DFS study (Figure 4)maybe related to the rigid folding core determined from computational unfolding studies.15
Each energy minimum in an energy landscape characterizes a conformational substate, and thus the number of minima describes the conformational flexibility of the structure. Whereas a flexible structure can be described by a rough energy landscape exhibiting many minima, a rigid structure may be represented by a smooth energy landscape exhibiting one or only a few energy minima. Rigid structures in rhodopsin may represent robust cores in which the different energy contributions are simultaneously minimized, resulting in a single or a few conformations on a minimally frustrated landscape.57 In contrast, flexible structures can result in the coexistence of numerous conformational substates on a rugged energy landscape because of the coexistence of numerous energy minima separated by low-energy barriers. Thus, competing interactions stabilizing these substates cannot be simultaneously minimized into a single or a few conformations, resulting in an energetically frustrated landscape. Recently, the ruggedness of the energy landscape describing the coexisting substates of transmembrane α-helices A–E of bacteriorhodopsin was determined by DFS to be ~5kBT.40 To enhance the robustness of the functional structure, inter- and intramolecular interactions should be mutually supportive and should cooperatively lead to a low-energy structure. Protein structures with minimally frustrated energy landscapes (i.e., rigid structural segments) will be kinetically favored to fold earlier than those with frustrated energy landscapes.57
Possible Functional Implications of Rigid Structural Segments in Rhodopsin
Proteins exhibit both flexible and rigid regions that contribute to their well-tuned functional purposes. The combination of rigid and flexible regions observed in the binding pocket of rhodopsin (Figure 6) must play a dual role. On one hand, this protein must maintain the inactive state, but on the other hand, it must accommodate the changes that lead to receptor activation. The presence of both rigid and flexible regions in the retinal-binding pocket of rhodopsin is not apparent by looking at B factors in crystal structures.14 However, it is supported by NMR studies, indicating that the retinal in the ground state of rhodopsin experiences restricted motions of appreciable amplitude. 58
The retinal rod cell has single-photon detection capability as a result of the extremely low levels of dark noise in rhodopsin and a significant degree of biochemical amplification. The chromophore 11-cis-retinal acts as an inverse agonist, thereby maintaining the ground state of the receptor. Thermal isomerization in a single rhodopsin molecule at physiological temperature has been estimated to occur about once in 470 years.59,60 The most rigid segment in rhodopsin includes transmembrane α-helix III and extracellular loop II, which make a large contribution to the retinal-binding pocket (Figure 6). It was also noted previously that the segment including α-helix III requires the largest force to unfold.31 Thus, a portion of the retinal-binding pocket is rigid, which may contribute to the stabilization of the 11-cis-retinal chromophore. Rigid structures would presumably aid in preventing any unwanted conformational change of 11-cis-retinal to all-trans-retinal, which would lead to constitutive activation of the signaling cascade and consequent retinal degeneration.61
Once the chromophore absorbs a photon, the isomerization must be accommodated within the retinal-binding cavity. Full activation of the receptor requires the signal from this isomerization to be transferred from the extracellular side to the cytoplasmic side. Rhodopsin activation has traditionally been thought to result from large conformational changes dictated by the rigid body movement of α-helices.62 The recently solved crystal structure of a photoactivated state of bovine rhodopsin did not display these expected conformational changes,63 which suggests that large conformational changes are not the sole requirement for receptor activation. The absence of significant conformational changes also suggests that dynamic changes in addition to conformational adjustments may underlie the activation process. In this context, dynamic changes occur from thermal fluctuations or motions within a protein, and conformational changes occur from distinct movements within the protein that result in a distinct mean structure. Photoisomerization induces a rather large structural change in retinal from the 11-cis to the all-trans form. The rhodopsin structure, however, shows that the retinal pocket is tightly packed and that the conformational change in the receptor upon photoactivation remains minor even though the retinal undergoes a rather large conformational change.63 Thus, it must be assumed that not all structures shaping the retinal pocket are rigid. Otherwise, much larger rigid body movements in the structure of the active receptor would have been observed.63 The minor structural changes occurring upon rhodopsin activation can be explained if the binding pocket is surrounded by a combination of rigid and flexible segments.
Conformational changes were observed in crystals of photoactivated rhodopsin at the cytoplasmic surface, where loops II and III became disordered.63 Whereas cytoplasmic loop II is connected to α-helix III, loop III connects to α-helix V. Among all transmembrane α-helices, these two helices show the highest rigidity in our DFS measurements of rhodopsin. From a mechanistic point of view, photoisomerization of the retinal would release steric constraints in the retinal-binding pocket (Figure 6C). Because both α-helices III and V form a considerable part of this pocket, one may assume that these rigid structures would be able to convert conformational changes of the retinal into precise conformational changes of the cytoplasmic loops. Depending on their flexibility, other α-helices may instead bend away locally or adopt alternate conformations. Additionally, one may assume that the presence of flexible regions would provide a structural environment to enable the conformational change in the rigid regions during protein activation. Such interplays between flexible and rigid structures to facilitate precise conformational changes are commonly found in membrane proteins.64 Together, the rigid α-helices of rhodopsin may play a role in converting the isomerization of the retinal into a precise conformational change of the cytoplasmic surface, whereas structurally flexible α-helices may be functionally required to allow the protein to achieve this conformational state that is recognized by G proteins of the signaling cascade.
Outlook
DFS offers a unique way to directly probe the mechanical properties of different regions within a protein. In this article, we show for the first time that DFS can be used to determine the rigidity of membrane proteins. We have shown that the mechanical properties of rhodopsin and bacteriorhodopsin are different, which may be suited for their functional roles. Many structural segments in rhodopsin are rigid compared to only a few in bacteriorhodopsin. The rigid structural regions in rhodopsin are interspersed with flexible ones. This combination of rigid and flexible regions must have a functional purpose. Rhodopsin and bacteriorhodopsin have evolved ways of carefully tinkering with the arrangement of amino acid sequences not only to reach complex structures with optimum stability but also to give polypeptides properties suited to their functions.
Our assumptions and analyses likely will require further refinement to gain more knowledge about the mechanical properties of these proteins. However, these analyses do provide us with a first approximation of the mechanical properties of these membrane proteins. Further investigations utilizing DFS will provide us with a clearer picture of how the mechanical and energetic properties of membrane proteins such as rhodopsin and bacteriorhodopsin contribute to their structure and function.
Acknowledgment
We thank Drs. Erik Schäffer, David Lodowski, and Jonne Helenius for discussions and valuable comments. This work was supported by the DFG, BMBF, EU, and NIH (EY08061, GM079191, and EY018085).
Abbreviations
- AFM
atomic force microscopy
- DFS
single-molecule dynamic force spectroscopy
- GPCR
G-protein coupled receptor
- SEM
standard error of the mean
- SMFS
single-molecule force spectroscopy
- ΔGu‡
energy barrier height
- ku
unfolding rate
- κ
spring constant/rigidity
- xu
distance from the energy minimum of the folded state to the transition state
References
- 1.Daggett V, Fersht A. The present view of the mechanism of protein folding. Nat. Rev. Mol. Cell Biol. 2003;4:497–502. doi: 10.1038/nrm1126. [DOI] [PubMed] [Google Scholar]
- 2.Dill KA, Chan HS. From Levinthal to pathways to funnels. Nat. Struct. Biol. 1997;4:10–19. doi: 10.1038/nsb0197-10. [DOI] [PubMed] [Google Scholar]
- 3.Klein-Seetharaman J. Dual role of interactions between membranous and soluble portions of helical membrane receptors for folding and signaling. Trends Phramacol. Sci. 2005;26:183–9. doi: 10.1016/j.tips.2005.02.009. [DOI] [PubMed] [Google Scholar]
- 4.Bowie JU. Solving the membrane protein folding problem. Nature. 2005;438:581–9. doi: 10.1038/nature04395. [DOI] [PubMed] [Google Scholar]
- 5.Matthews EE, Zoonens M, Engelman DM. Dynamic helix interactions in transmembrane signaling. Cell. 2006;127:447–50. doi: 10.1016/j.cell.2006.10.016. [DOI] [PubMed] [Google Scholar]
- 6.White SH, Wimley WC. Membrane protein folding and stability: Physical principles. Annu. Rev. Biophys. Biomol. Struct. 1999;28:319–65. doi: 10.1146/annurev.biophys.28.1.319. [DOI] [PubMed] [Google Scholar]
- 7.Daggett V, Fersht A. Is there a unifying mechanism for protein folding. Trends Biochem. Sci. 2003;28:19–26. doi: 10.1016/s0968-0004(02)00012-9. [DOI] [PubMed] [Google Scholar]
- 8.Booth PJ, Curnow P. Membrane proteins shape up: understanding in vitro folding. Curr. Opin. Struct. Biol. 2006;16:480–8. doi: 10.1016/j.sbi.2006.06.004. [DOI] [PubMed] [Google Scholar]
- 9.Hessa T, Kim H, Bihlmaier K, Lundin C, Boekel J, Andersson H, Nilsson I, White SH, von Heijne G. Recognition of transmembrane helices by the endoplasmic reticulum translocon. Nature. 2005;433:377–81. doi: 10.1038/nature03216. [DOI] [PubMed] [Google Scholar]
- 10.Bowie JU. Stabilizing membrane proteins. Curr. Opin. Struct. Biol. 2001;11:397–402. doi: 10.1016/s0959-440x(00)00223-2. [DOI] [PubMed] [Google Scholar]
- 11.Seddon AM, Curnow P, Booth PJ. Membrane proteins, lipids and detergents: not just a soap opera. Biochim. Biophys. Acta. 2004;1666:105–17. doi: 10.1016/j.bbamem.2004.04.011. [DOI] [PubMed] [Google Scholar]
- 12.Lanyi JK. Bacteriorhodopsin. Annu. Rev. Physiol. 2004;66:665–88. doi: 10.1146/annurev.physiol.66.032102.150049. [DOI] [PubMed] [Google Scholar]
- 13.Haupts U, Tittor J, Oesterhelt D. Closing in on bacteriorhodopsin: progress in understanding the molecule. Annu. Rev. Biophys. Biomol. Struct. 1999;28:367–99. doi: 10.1146/annurev.biophys.28.1.367. [DOI] [PubMed] [Google Scholar]
- 14.Palczewski K. Gprotein-coupled receptor rhodopsin. Annu. Rev. Biochem. 2006;75:743–67. doi: 10.1146/annurev.biochem.75.103004.142743. [DOI] [PMC free article] [PubMed] [Google Scholar]
- 15.Tastan O, Yu E, Ganapathiraju M, Aref A, Rader AJ, Klein-Seetharaman J. Comparison of stability predictions and simulated unfolding of rhodopsin structures. Photochem. and Photobiol. 2007;83:351–62. doi: 10.1562/2006-06-20-RA-942. [DOI] [PubMed] [Google Scholar]
- 16.Engelman DM, Chen Y, Chin CN, Curran AR, Dixon AM, Dupuy AD, Lee AS, Lehnert U, Matthews EE, Reshetnyak YK, Senes A, Popot JL. Membrane protein folding: beyond the two stage model. FEBS Lett. 2003;555:122–5. doi: 10.1016/s0014-5793(03)01106-2. [DOI] [PubMed] [Google Scholar]
- 17.Sanders CR, Myers JK. Disease-related misassembly of membrane proteins. Annu. Rev. Biophys. Biomol. Struct. 2004;33:25–51. doi: 10.1146/annurev.biophys.33.110502.140348. [DOI] [PubMed] [Google Scholar]
- 18.Florin E-L, Moy VT, Gaub HE. Adhesion forces between individual ligand-receptor pairs. Science. 1994;264:415–7. doi: 10.1126/science.8153628. [DOI] [PubMed] [Google Scholar]
- 19.Lee GU, Kidwell DA, Colton RJ. Sensing discrete streptavidinbiotin interactions with atomic force microscopy. Langmuir. 1994;10:354–7. [Google Scholar]
- 20.Fernandez JM, Li H. Force-clamp spectroscopy monitors the folding trajectory of a single protein. Science. 2004;303:1674–8. doi: 10.1126/science.1092497. [DOI] [PubMed] [Google Scholar]
- 21.Rief M, Gautel M, Oesterhelt F, Fernandez JM, Gaub HE. Reversible unfolding of individual titin immunoglobulin domains by AFM. Science. 1997;276:1109–12. doi: 10.1126/science.276.5315.1109. [DOI] [PubMed] [Google Scholar]
- 22.Schwaiger I, Kardinal A, Schleicher M, Noegel AA, Rief M. A mechanical unfolding intermediate in an actin-crosslinking protein. Nat. Struct. Mol. Biol. 2004;11:81–5. doi: 10.1038/nsmb705. [DOI] [PubMed] [Google Scholar]
- 23.Dietz H, Rief M. Exploring the energy landscape of GFP by singlemolecule mechanical experiments. Proc. Natl. Acad. Sci. U.S.A. 2004;101:16192–7. doi: 10.1073/pnas.0404549101. [DOI] [PMC free article] [PubMed] [Google Scholar]
- 24.Oesterhelt F, Oesterhelt D, Pfeiffer M, Engel A, Gaub HE, Müller DJ. Unfolding pathways of individual bacteriorhodopsins. Science. 2000;288:143–6. doi: 10.1126/science.288.5463.143. [DOI] [PubMed] [Google Scholar]
- 25.Müller DJ, Kessler M, Oesterhelt F, Möller C, Oesterhelt D, Gaub H. Stability of bacteriorhodopsin alpha-helices and loops analyzed by single-molecule force spectroscopy. Biophys. J. 2002;83:3578–88. doi: 10.1016/S0006-3495(02)75358-7. [DOI] [PMC free article] [PubMed] [Google Scholar]
- 26.Janovjak H, Struckmeier J, Hubain M, Kedrov A, Kessler M, Müller DJ. Probing the energy landscape of the membrane protein bacteriorhodopsin. Structure. 2004;12:871–9. doi: 10.1016/j.str.2004.03.016. [DOI] [PubMed] [Google Scholar]
- 27.Möller C, Fotiadis D, Suda K, Engel A, Kessler M, Müller DJ. Determining molecular forces that stabilize human aquaporin-1. J. Struct. Biol. 2003;142:369–78. doi: 10.1016/s1047-8477(03)00066-2. [DOI] [PubMed] [Google Scholar]
- 28.Kedrov A, Janovjak H, Ziegler C, Kühlbrandt W, Müller DJ. Observing folding kinetics and pathways of single antiporters. J. Mol. Biol. 2006;355:2–8. doi: 10.1016/j.jmb.2005.10.028. [DOI] [PubMed] [Google Scholar]
- 29.Kedrov A, Wegmann S, Smits SH, Goswami P, Baumann H, Muller DJ. Detecting molecular interactions that stabilize, activate and guide ligand-binding of the sodium/proton antiporter MjNhaP1 from Methanococcus jannaschii. J. Struct. Biol. 2007;159:290–301. doi: 10.1016/j.jsb.2007.02.010. [DOI] [PubMed] [Google Scholar]
- 30.Cisneros DA, Oesterhelt D, Müller DJ. Probing origins of molecular interactions stabilizing the membrane proteins halorhodopsin and bacteriorhodopsin. Structure. 2005;13:235–42. doi: 10.1016/j.str.2004.12.005. [DOI] [PubMed] [Google Scholar]
- 31.Sapra KT, Park PS, Filipek S, Engel A, Müller DJ, Palczewski K. Detecting molecular interactions that stabilize native bovine rhodopsin. J. Mol. Biol. 2006;358:255–69. doi: 10.1016/j.jmb.2006.02.008. [DOI] [PubMed] [Google Scholar]
- 32.Kedrov A, Janovjak H, Sapra KT, Muller DJ. Deciphering molecular interactions of native membrane proteins by single-molecule force spectroscopy. Annu. Rev. Biophys. Biomol. Struct. 2007;36:233–60. doi: 10.1146/annurev.biophys.36.040306.132640. [DOI] [PubMed] [Google Scholar]
- 33.Evans E. Probing the relation between force-lifetime-and chemistry in single molecular bonds. Annu. Rev. Biophys. Biomol. Struct. 2001;30:105–28. doi: 10.1146/annurev.biophys.30.1.105. [DOI] [PubMed] [Google Scholar]
- 34.Best RB, Fowler SB, Toca-Herrera JL, Clarke J. A simple method for probing the mechanical unfolding pathway of proteins in detail. Proc. Natl. Acad. Sci. U.S.A. 2002;99:12143–8. doi: 10.1073/pnas.192351899. [DOI] [PMC free article] [PubMed] [Google Scholar]
- 35.Williams PM, Fowler SB, Best RB, Toca-Herrera JL, Scott KA, Steward A, Clarke J. Hidden complexity in the mechanical properties of titin. Nature. 2003;422:446–9. doi: 10.1038/nature01517. [DOI] [PubMed] [Google Scholar]
- 36.Li H, Carrion-Vazquez M, Oberhauser AF, Marszalek PE, Fernandez JM. Point mutations alter the mechanical stability of immunoglobulin modules. Nat. Struct. Biol. 2000;7:1117–20. doi: 10.1038/81964. [DOI] [PubMed] [Google Scholar]
- 37.Evans E. Energy landscapes of biomolecular adhesion and receptor anchoring at interfaces explored with dynamic force spectroscopy. Faraday Discuss. 1998;111:1–16. doi: 10.1039/a809884k. [DOI] [PubMed] [Google Scholar]
- 38.Merkel R, Nassoy P, Leung A, Ritchie K, Evans E. Energy landscapes of receptor-ligand bonds explored with dynamic force spectroscopy. Nature. 1999;397:50–3. doi: 10.1038/16219. [DOI] [PubMed] [Google Scholar]
- 39.Evans EA, Calderwood DA. Forces and bond dynamics in cell adhesion. Science. 2007;316:1148–53. doi: 10.1126/science.1137592. [DOI] [PubMed] [Google Scholar]
- 40.Janovjak H, Knaus H, Muller DJ. Transmembrane helices have rough energy surfaces. J. Am. Chem. Soc. 2007;129:246–7. doi: 10.1021/ja065684a. [DOI] [PubMed] [Google Scholar]
- 41.Papermaster DS. Preparation of retinal rod outer segments. Methods Enzymol. 1982;81:48–52. doi: 10.1016/s0076-6879(82)81010-0. [DOI] [PubMed] [Google Scholar]
- 42.Sapra KT, Park PS, Filipek S, Engel A, Muller DJ, Palczewski K. Detecting molecular interactions that stabilize native bovine rhodopsin. J. Mol. Biol. 2006;358:255–69. doi: 10.1016/j.jmb.2006.02.008. [DOI] [PubMed] [Google Scholar]
- 43.Florin E-L, Rief M, Lehmann H, Ludwig M, Dornmair C, Moy VT, Gaub HE. Sensing specific molecular interactions with the atomic force microscope. Biosens. Bioelectron. 1995;10:895–901. [Google Scholar]
- 44.Müller DJ, Kessler M, Oesterhelt F, Moller C, Oesterhelt D, Gaub H. Stability of bacteriorhodopsin alpha-helices and loops analyzed by single-molecule force spectroscopy. Biophys. J. 2002;83:3578–88. doi: 10.1016/S0006-3495(02)75358-7. [DOI] [PMC free article] [PubMed] [Google Scholar]
- 45.Rief M, Gautel M, Oesterhelt F, Fernandez JM, Gaub HE. Reversible unfolding of individual titin immunoglobulin domains by AFM. Science. 1997;276:1109–12. doi: 10.1126/science.276.5315.1109. [DOI] [PubMed] [Google Scholar]
- 46.Evans E. Looking inside molecular bonds at biological interfaces with dynamic force spectroscopy. Biophys. Chem. 1999;82:83–97. doi: 10.1016/s0301-4622(99)00108-8. [DOI] [PubMed] [Google Scholar]
- 47.Dettmann W, Grandbois M, Andre S, Benoit M, Wehle AK, Kaltner H, Gabius HJ, Gaub HE. Differences in zero-force and force-driven kinetics of ligand dissociation from beta-galactoside-specific proteins (plant and animal lectins, immunoglobulin G) monitored by plasmon resonance and dynamic single molecule force microscopy. Arch. Biochem. Biophys. 2000;383:157–70. doi: 10.1006/abbi.2000.1993. [DOI] [PubMed] [Google Scholar]
- 48.Bieri O, Wirz J, Hellrung B, Schutkowski M, Drewello M, Kiefhaber T. The speed limit for protein folding measured by triplet-triplet energy transfer. Proc. Natl. Acad. Sci. U.S.A. 1999;96:9597–601. doi: 10.1073/pnas.96.17.9597. [DOI] [PMC free article] [PubMed] [Google Scholar]
- 49.Schlierf M, Rief M. Temperature softening of a protein in single-molecule experiments. J. Mol. Biol. 2005;354:497–503. doi: 10.1016/j.jmb.2005.09.070. [DOI] [PubMed] [Google Scholar]
- 50.Dietz H, Berkemeier F, Bertz M, Rief M. Anisotropic deformation response of single protein molecules. Proc. Natl. Acad. Sci. U.S.A. 2006;103:12724–8. doi: 10.1073/pnas.0602995103. [DOI] [PMC free article] [PubMed] [Google Scholar]
- 51.Howard J. Mechanics of motor proteins and the cytoskeleton. Sinauer Associates Inc.; Sunderland, Massachusetts: 2001. [Google Scholar]
- 52.Park PS, Sapra KT, Kolinski M, Filipek S, Palczewski K, Muller DJ. Stabilizing effect of Zn2+ in native bovine rhodopsin. J. Biol. Chem. 2007;282:11377–85. doi: 10.1074/jbc.M610341200. [DOI] [PMC free article] [PubMed] [Google Scholar]
- 53.Ikai A. Local rigidity of a protein molecule. Biophys. Chem. 2005;116:187–91. doi: 10.1016/j.bpc.2005.04.003. [DOI] [PubMed] [Google Scholar]
- 54.Kedrov A, Ziegler C, Janovjak H, Kuhlbrandt W, Müller DJ. Controlled unfolding and refolding of a single sodium-proton antiporter using atomic force microscopy. J. Mol. Biol. 2004;340:1143–52. doi: 10.1016/j.jmb.2004.05.026. [DOI] [PubMed] [Google Scholar]
- 55.Kessler M, Gaub H. Unfolding barriers in bacteriorhodopsin probed from the cytoplasmic and the extracellular side by AFM. Structure. 2006;14:521–7. doi: 10.1016/j.str.2005.11.023. [DOI] [PubMed] [Google Scholar]
- 56.Rader AJ, Anderson G, Isin B, Khorana HG, Bahar I, Klein-Seetharaman J. Identification of core amino acids stabilizing rhodopsin. Proc. Natl. Acad. Sci. U.S.A. 2004;101:7246–51. doi: 10.1073/pnas.0401429101. [DOI] [PMC free article] [PubMed] [Google Scholar]
- 57.Oliveberg M, Wolynes PG. The experimental survey of protein-folding energy landscapes. Q. Rev. Biophys. 2006:1–44. doi: 10.1017/S0033583506004185. [DOI] [PubMed] [Google Scholar]
- 58.Struts AV, Salgado GF, Tanaka K, Krane S, Nakanishi K, Brown MF. Structural analysis and dynamics of retinal chromophore in dark and meta I states of rhodopsin from (2)H NMR of aligned membranes. J. Mol. Biol. 2007 doi: 10.1016/j.jmb.2007.03.046. in press. [DOI] [PMC free article] [PubMed] [Google Scholar]
- 59.Baylor DA, Lamb TD, Yau KW. Responses of retinal rods to single photons. J. Physiol. 1979;288:613–34. [PMC free article] [PubMed] [Google Scholar]
- 60.Baylor DA. Photoreceptor signals and vision. Invest. Ophthalmol. Vis. Sci. 1987;28:34–49. [PubMed] [Google Scholar]
- 61.Woodruff ML, Wang Z, Chung HY, Redmond TM, Fain GL, Lem J. Spontaneous activity of opsin apoprotein is a cause of Leber congenital amaurosis. Nat. Genet. 2003;35:158–64. doi: 10.1038/ng1246. [DOI] [PubMed] [Google Scholar]
- 62.Meng EC, Bourne HR. Receptor activation: what does the rhodopsin structure tell us? Trends Pharmacol. Sci. 2001;22:587–93. doi: 10.1016/s0165-6147(00)01825-3. [DOI] [PubMed] [Google Scholar]
- 63.Salom D, Lodowski DT, Stenkamp RE, Trong IL, Golczak M, Jastrzebska B, Harris T, Ballesteros JA, Palczewski K. Crystal structure of a photoactivated deprotonated intermediate of rhodopsin. Proc. Natl. Acad. Sci. U.S.A. 2006;103:16123–8. doi: 10.1073/pnas.0608022103. [DOI] [PMC free article] [PubMed] [Google Scholar]
- 64.Müller DJ, Hand GM, Engel A, Sosinsky G. Conformational changes in surface structures of isolated Connexin26 gap junctions. EMBO J. 2002;21(14):3598–3607. doi: 10.1093/emboj/cdf365. [DOI] [PMC free article] [PubMed] [Google Scholar]
- 65.Taverna DM, Goldstein RA. Why are proteins marginally stable? Proteins: Structure, Function and Genetics. 2002;46:105–9. doi: 10.1002/prot.10016. [DOI] [PubMed] [Google Scholar]
- 66.Stenson PD, Ball EV, Mort M, Phillips AD, Shiel JA, Thomas NS, Abeysinghe S, Krawczak M, Cooper DN. Human Gene Mutation Database (HGMD): 2003 update. Hum. Mutat. 2003;21:577–81. doi: 10.1002/humu.10212. [DOI] [PubMed] [Google Scholar]
- 67.Okada T, Sugihara M, Bondar AN, Elstner M, Entel P, Buss V. The retinal conformation and its environment in rhodopsin in light of a new 2.2 A crystal structure. J. Mol. Biol. 2004;342:571–83. doi: 10.1016/j.jmb.2004.07.044. [DOI] [PubMed] [Google Scholar]
- 68.DeLano WL. The PyMOL molecular graphics system. DeLano Scientific, Palo Alto, CA, U.S.A. 2002.