Quartz crystal microbalance (QCM) has been explored as an alternative to optical biosensors in recent years for detection of biological reagents.1 Some researchers are still skeptical about the potential of piezoelectric mass sensing devices as biosensors,2 because the physics of biofilms in liquids are complex. This complexity makes it difficult to obtain an explicit relationship between the added mass and the change in the frequency output. Quite generally, the QCM gives a response that characterizes the binding event between a sensing layer, immobilized on the surface of transducer, and the analytes to be detected. However, the mass estimated with the QCM response through the Sauerbrey equation3 (i.e., Δf = −2Δmnf02/[A(µqρq)1/2], where n is the overtone number, µq is the shear modulus of the quartz (2.947 × 10¹¹ g/(cm•s2), and ρq is the density of the quartz (2.648 g/cm3), Δm/A is the areal density) depends on the layer rheology. The Sauerbrey relationship was derived by assuming the attached mass is rigid and strongly coupled to the resonator. It does not apply if the deposited mass is, for example, viscoelastic. Quartz crystal resonators are sensitive to viscoelastic properties,4 which limits QCM application for the precise mass detection of biological materials in a liquid phase. In such a case, the true mass and that calculated using the Sauerbrey relationship may be quite different. Several papers have demonstrated that the deposited mass can be overestimated.1
Another limitation of QCM biosensors arises from the large size of biomolecules such as immunoglobulins that are immobilized on the Au surface. They may have low areal densities and random orientations that are associated with significant nonspecific adsorption phenomena. There have been reports on improvement in the orientation of proteins on gold surfaces5 by using biotin streptavidin binding or sandwich layers. However, in the case of sensing molecules with low areal densities, nonspecific adsorption still remains as a problem.
We report here our novel immobilization approaches that overcome the above limitations for the use of the QCM with certain biofilms. We demonstrate the success of this method by determining the crystal impedance of the resonator without and with the attached biofilms and show that series resistance in the Butterworth–Van-Dyek-equivalent circuit hardly changes. This result is a proof that the attached biofilms behave as a rigidly attached mass and that the Sauerbrey equation is valid. A QCM acoustic impedance analysis was used to determine changes in energy loss upon the binding of anti-Gal to the trisaccharide α-Gal. Our end goal, in this case, is to develop a methodology for screening α-Gal oligosaccharides and its derivatives to remove anti-Gal antibodies for therapeutics in xenotransplantation. Studying the dissociation constant between α-Gal and anti-Gal is a particular objective of this work.
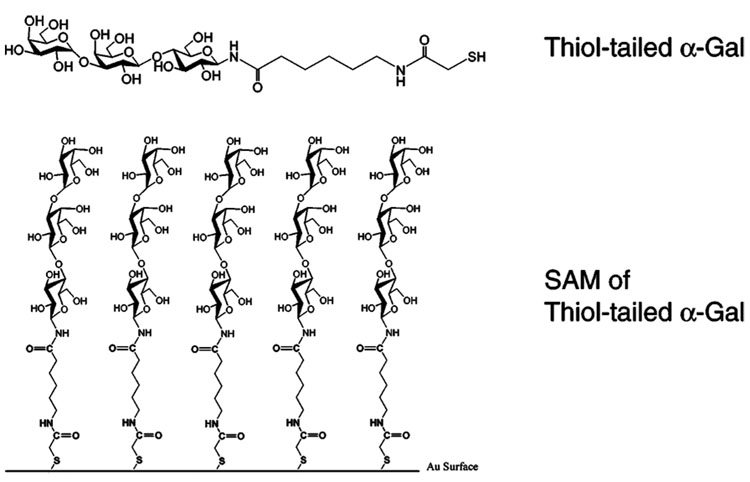
Large areal densities enhance the rigidity of a bound biological monolayer. Furthermore, the lack of available surface sites minimizes the possibility of nonspecific adsorption. In our first strategy that leads to a rigid biofilm, we immobilized the relatively small carbohydrate epitope (α-galacosyl trisaccharide) that binds with a specific protein (anti-Gal) rather than immobilizing a large antibody on the Au substrate. This significantly increased the areal density of the immobilized sensing molecules since the molecular volume of α-Gal is much smaller than that of anti-Gal. Second, α-galacosyl epitope was tailored with a thiol linker that formed self-assembled monolayers (SAMs) on the gold surface (Figure 1). By taking advantage of the SAM technology,6 immobilized molecules acquire a defined orientation with high areal densities that lead to more rigidly bound surface films. For example, Porter et al. have shown7 that long-chain alkanethiols (n > 10) assemble in a crystalline-like way. Thus, either strategy yields QCM data that can be used to determine the dissociation constant (Kd) from the frequency decrease found at various protein concentrations by plotting [anti-Gal]0/Δf vs [anti-Gal]0.8
Figure 1.
Thiol-tailored trisaccharide α-Gal immobilized on Au surface.
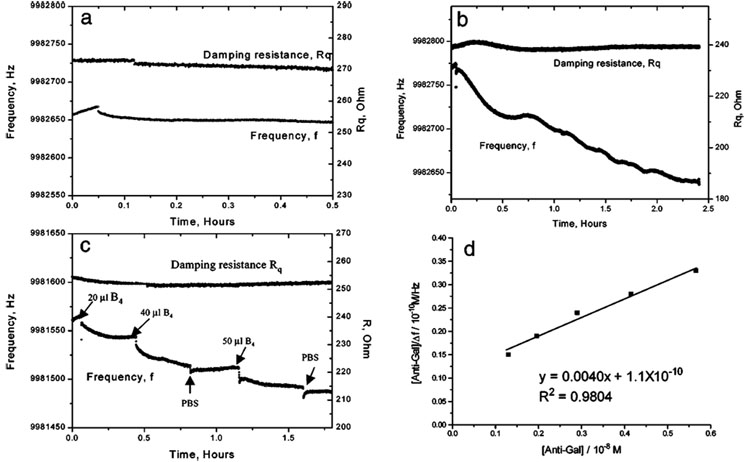
A protein, concanavalian A (conA), from Canavalia ensilformis, which binds to mannoside and glucoside specifically,9 was used to study whether the frequency change was affected by nonspecific binding. Figure 2a shows that when conA was added to the cell with the immobilized α-Gal SAM on Au QCM electrode, there was negligible frequency and damping resistance change. This is strong evidence that the structure of the immobilized α-Gal SAM is unaltered and that nonspecific adsorption has not occurred.
Figure 2.
(a–c) Frequency change vs time curve when (a) 50 µL of 1 × 10⁻⁵ M ConA; (b) 30 µL of 1 × 10⁻⁶ M polycolonal anti-Gal antibody; (c) 20 µL, 40 µL, and 50 µL of 7.6 × 10⁻⁶ M lectin GS-1-B4 and 40 µL of PBS (pH 7.2) buffer were added to trisaccharide α-Gal modified unpolished Au electrode in 3 mL of PBS buffer, respectively. (d) Reciprocal plot of [anti-Gal]0/Δf vs [anti-Gal]0, apparent Kd value was (2.8 ± 0.3) × 10−8 M. The average value of four measurements was (3.5 ± 1.2) × 10−8 M (Table 1).
Figure 2b shows typical time courses of the frequency changes of Au QCM covered with α-Gal SAM, responding to the addition of polyclonal anti-Gal antibody. Rather than a single-exponential decay of the frequency change, stepwise frequency decreases are observed. We rationalize this observation as caused by the polycolonal nature of the anti-Gal antibody, with those having the strongest affinity to α-Gal binding first and those with weaker affinities binding later. Testing this hypothesis is the subject of ongoing work. The ratio of the amount of α-Gal immobilized and the amount of anti-Gal bound calculated from frequency data indicates the binding efficiency for α-Gal SAM is 0.5%. We suggest that this low binding coverage is because the large adsorbed anti-Gal physically blocked most of the immobilized α-Gal binding sites.
We also studied a lectin, Griffonia simplicifolia lectin-1-B4 (GS-1-B4), binding with the same trisaccharide α-Gal, as an immobilized α-Gal SAM on an Au QCM electrode. GS-1-B4 isolectin is composed of four B subunits and has a high affinity for the Galα1–3Gal sequence.10 Figure 2c shows the frequency vs time curve that was obtained on adding successive volumes of 7.6 µM of lectin to the cell. α-Gal binding sites are saturated upon the third addition of lectin GS-1-B4 as demonstrated by the smaller frequency shift compared to those from the first and second addition of lectin GS-1-B4. Figure 2c also shows that there was negligible frequency shift when an aliquot of PBS buffer was added. This demonstrates that nonspecific adsorption of the buffer species was not occurring. These studies also show that the change of damping resistance was |ΔRq|Rq ≤ 0.6% (in Figure 2, a–c), which confirmed that the biofilm was exhibiting rigid, rather than viscoelastic, behavior in our experiment.
Figure 2d is a representative reciprocal plot of [anti-Gal]0/Δf vs [anti-Gal]0. The average value of apparent Kd of four measurements is (3.5 ± 1.2) × 10−8 M (Table 1). Table 1 lists the literature values for dissociation constants of comparable α-Gal or lectins with similar proteins obtained by other methods and by our QCM method here. Although the antigen has a little difference, the binding between α-Gal and anti-Gal depends mainly on the Galα1–3Gal end of α-Gal,11 so that the data may be compared. The mushroom Marasmius oreades lectin also has high affinity for the Galα1–3Gal sequence.12 For anti-Gal, Kd value between α-Gal and anti-Gal (polycolonal or monoclonal; IgM or IgG) were 10−6–10−11 M by SPR,11a,13 ELISA,14 and equilibrium dialysis technique.15 The QCM approach gave (3.5 ± 1.2) × 10−8 M. For lectins, the Kd values found were 4.95 × 10⁻⁵ M (GS-1-B4) by equilibrium dialysis16 technique and 1.03 × 10⁻⁴ to 1.82 × 10⁻⁴ M (Marasmius oreades) by isothermal titration microcalorimetry technique11b (ITC), respectively. Our QCM data gave (1.1 ± 0.2) × 10−5 M (GS-1-B4) and (3.3 ± 0.7) × 10−5 M (Marasmius oreades), respectively. The Kd data obtained by QCM was in good agreement with that of other methods.
Table 1.
Kd Value in Literature and Its Measurement by QCM
| antibody | antigen | assay method | Kd, M |
|---|---|---|---|
| IgG | Galα1,3Galβ1,4GlcNAc or Galα1,3Galβ1,4GlcNAcβ1, 3Galβ1,4Glc | SPR13 | 4.9 × 10⁻⁷ |
| IgG, mono- | DNP-KLH | SPR13 | 7.9 × 10⁻¹¹ |
| IgM | Galα1,3Galβ1,4GlcNAc or Galα1,3Galβ1,4GlcNAcβ1, 3Galβ1,4Glc | SPR11a | 1.1 × 10⁻¹⁰ |
| IgG | Galα1,3Galβ1,4GlcNAc | ELISA14a | 10−6 |
| porcine endothelial cells | ELISA14b | 10−8–10−10 | |
| IgM | [3H]Galα1,3Galβ1,4GlcNAc | equilibrium dialysis15 | 10−6–10−7 |
| polyclonal | Galα1,3Galβ1,4Glc | QCM | (3.5 ± 1.2) × 10−8 a |
| GS-1-B4 | Methyl Galα1,3Gal | equilibrium dialysis16 | 4.95 × 10⁻⁵ |
| Galα1,3Galβ1,4Glc | QCM | (1.1 ± 0.2) × 10−5 | |
| Marasmius oreades | Galα1,3Gal | ITC11b | 1.82 × 10⁻⁴ |
| Galα1,3Galβ1,4GlcNAc | ITC11b | 1.03 × 10⁻⁴ | |
| Galα1,3Galβ1,4Glc | QCM | (3.3 ± 0.7) × 10−5 | |
Apparent Kd.
The strategies used here shows that the QCM approach is competitive with established label-free techniques such as SPR and interferometry. Immobilization strategy by SAM used here could also improve the performance of the SPR technique. QCM approach is significantly less expensive and more user-friendly and can be used to quantitate affinities in binding situations such as those for α-Gal and anti-Gal whose Kd is between 10−6 and 10−12 M.
Acknowledgment
X.Z. thanks the Oakland University Research Excellent Fund, Faculty Start-up funds and NIH Grant 1R21EB000672-01 support. P.G.W. thanks the NIH for support from Grant AI44040. We thank Dr. Goldstein I. J. in Department of Biological Chemistry, University of Michigan for providing the lectin from the mushroom, Marasmius oreades, and Dr. Q. Xie for software.
Footnotes
Supporting Information Available: Synthesis of thiol tailed α-Gal and experimental details for QCM measurement (PDF). This material is available free of charge via the Internet at http://pubs.acs.org.
References
- 1.Janshoff A, Galla H, Steinem C. Angew Chem., Int. Ed. 2000;39:4004–4032. doi: 10.1002/1521-3773(20001117)39:22<4004::aid-anie4004>3.0.co;2-2. [DOI] [PubMed] [Google Scholar]
- 2.Rodahl M, Höök F, Fredriksson C, Keller CA, Krozer A, Brzezinski P, Voinova M, Kasemo B. Faraday Discuss. 1997;107:229–246. doi: 10.1039/a703137h. [DOI] [PubMed] [Google Scholar]
- 3.Sauerbrey GZ. Phys. 1959;155:206–222. [Google Scholar]
- 4.Nwankwo E, Durning CJ. Sens. Actuators, A. 1998;64:119–124. [Google Scholar]
- 5.(a) Davis KA, Leary TR. Anal. Chem. 1989;61:1227–1230. doi: 10.1021/ac00186a010. [DOI] [PubMed] [Google Scholar]; (b) Vikholm I, Albers WM. Langmuir. 1998;14:3865–3872. [Google Scholar]
- 6.Ulman A, Kang JF, Shnidman Y, Liao S, Jordan R, Choi GY, Zaccaro J, Myerson AS, Rafailovich M, Sokolov J, Fleischer C. Mol. Biotechnol. 2000;74:175–188. doi: 10.1016/s1389-0352(00)00013-1. [DOI] [PubMed] [Google Scholar]
- 7.Porter MD, Bright TB, Allara DL, Chidsey CE. J. Am. Chem. Soc. 1987;109:3559–3568. [Google Scholar]
- 8.Ebara Y, Itakura K, Okahata Y. Langmuir. 1996;12:5165–5170. [Google Scholar]
- 9.Weatherman RV, Mortell KH, Chervenak M, Kiessling LL, Toone E. J. Biochemistry. 1996;35:3619–3624. doi: 10.1021/bi951916z. [DOI] [PubMed] [Google Scholar]
- 10.Murphy LA, Goldstein IJ. J. Biol. Chem. 1977;252:4739–4742. [PubMed] [Google Scholar]
- 11.(a) Lee J, Cairns T, McKane M, Rashid M, George AJT, Taube D. Transplantation. 1998;66:1117–1119. doi: 10.1097/00007890-199810270-00028. [DOI] [PubMed] [Google Scholar]; (b) Winter HC, Mostafapour K, Goldstein IJ. J. Biol. Chem. 2002;277:14996–15001. doi: 10.1074/jbc.M200161200. [DOI] [PubMed] [Google Scholar]
- 12.Kruger RP, Winter HC, Simonson-Leff N, Stuckey JA, Goldstein IJ, Dixon JE. J. Biol. Chem. 2002;277:15002–15005. doi: 10.1074/jbc.M200165200. [DOI] [PubMed] [Google Scholar]
- 13.Bakker R, Lasonder E, Bos NA. Eur. J. Immun. 1995;25:1680–1686. doi: 10.1002/eji.1830250630. [DOI] [PubMed] [Google Scholar]
- 14.(a) Pothoulakis C, Galili U, Castagliuolo I, Kelly CP, Nikulasson S, Dudeja PK, Brasitus TA, Lamont JT. Gastroenterology. 1996;110:1704–1712. doi: 10.1053/gast.1996.v110.pm8964394. [DOI] [PubMed] [Google Scholar]; (b) Parker M, Bruno D, Holzknecht ZE, Platt JL. J. Immunol. 1994;153:3791–3804. [PubMed] [Google Scholar]
- 15.Wang L, Anaraki F, Henion TR. J. Gerontol. 1995;50A:M227–M233. doi: 10.1093/gerona/50a.4.m227. [DOI] [PubMed] [Google Scholar]
- 16.(a) Murphy LA, Goldstein I. J. Biochemistry. 1979;18:4999–5005. doi: 10.1021/bi00589a030. [DOI] [PubMed] [Google Scholar]; (b) Lamb JE, Goldstein I. J. Arch. Biochem. Biophys. 1984;229:15–26. doi: 10.1016/0003-9861(84)90125-5. [DOI] [PubMed] [Google Scholar]


